
Support for this work is provided by First 5 California.
Nearly 3 in 4 States Have Parent Lifetime Time Limits That Are More Generous Than California's
February 2020 | By Sara Kimberlin
Download Full Data HitSupport for this work is provided by First 5 California.
Join our email list!

Download a PDF version of this Infographic.

Join our email list!
Supplemental Security Income/State Supplementary Payment (SSI/SSP) grants are a critical source of income for well over 1 million California seniors and people with disabilities who have low incomes and need help paying for basic necessities, such as housing. Grants are funded with both federal (SSI) and state (SSP) dollars. The maximum monthly grant for an individual is about $944, which consists of an SSI grant of $783 and an SSP grant of $160.72.
To help close budget shortfalls during the Great Recession, the state made deep cuts to the SSP portion, reducing it from $233 per month in early 2009 to $156.40 per month by mid-2011. State policymakers increased the SSP grant by $4.32 per month starting in January 2017. However, no additional state grant increases have been provided since then, and the Governor’s proposed 2020-21 state budget assumes the SSP portion will remain frozen for another year.
Because state cuts largely remain in place, SSI/SSP recipients have less money to meet their basic needs, including housing. This is particularly concerning in light of California’s high housing costs. In all 58 California counties, the “Fair Market Rent” (FMR) for a studio apartment exceeds 50% of the maximum SSI/SSP grant for an individual. Moreover, the studio FMR exceeds the entire grant in 22 counties. People are at greater risk of becoming homeless when housing costs account for more than half of household income.
Join our email list!
State policymakers have many opportunities to continue building the state’s fiscal health and invest in the people of California as they consider policy priorities for 2020-21 and beyond. While California is a wealthy state home to many high-income households and businesses that have been able to greatly leverage resources and expand their wealth in the last several decades, millions more Californians live a different reality every day. Workers in low- and mid-wage jobs are unable to afford the high cost of living – from paying for housing and child care to stretching their paychecks at the end of the month to cover food and medical bills. This is true no matter what region Californians work in across the state and call home. For women, Californians of color, and immigrants the economic challenges and disparities are vast. The state is in danger of allowing millions of Californians to spend their lifetimes in financial distress.
California can do better for its people. The state’s policy choices can help more people earn adequate incomes, build wealth, and afford basic necessities that will allow them to live, learn, work, and age comfortably in their homes and communities. With renewed discussions about the state’s available resources, healthy reserves, and the need to plan for the future, this analysis provides five facts that show why state leaders should ensure that all Californians share in the state’s vast wealth.
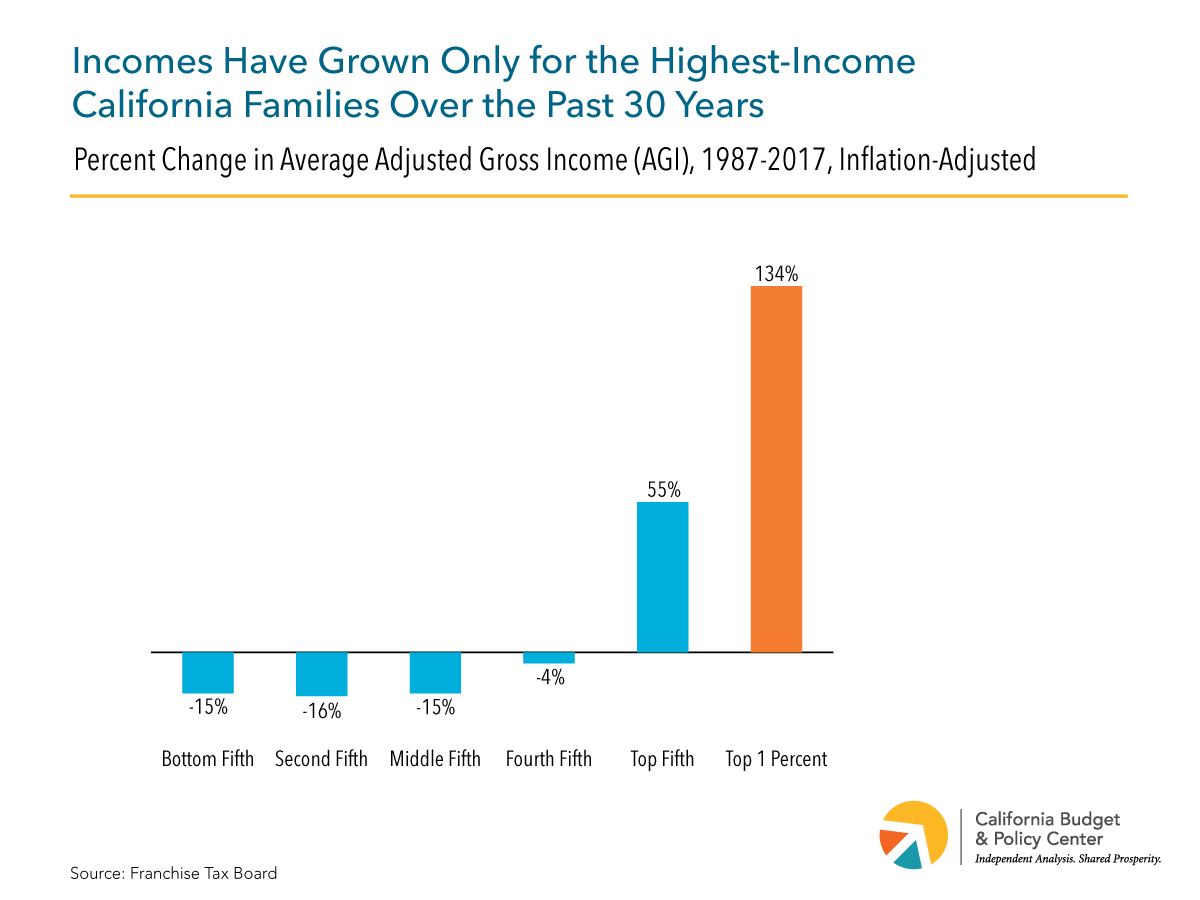
In the last three decades, economic inequality in California has significantly increased as incomes have grown only for the highest-income families. This increase in inequality is especially dramatic when accounting for not just earnings from work, but also unearned investment income, such as capital gains, which mostly goes to families with the highest incomes.1 Specifically, the average adjusted gross income – income reported for tax purposes, including investment income – for the top 1% has more than doubled, increasing by 134% between 1987 and 2017, while average incomes for the bottom 80% of Californians have decreased, after accounting for inflation.
The yearly income for the average California household in the top 1% in 2017 was $2 million, while the average household in the middle quintile received just $41,000. This means that, on average, the top 1% brought home in one week what Californians in the middle quintile received in one year. Viewed another way, in 2017 alone, the top 1% of California households – totaling 168,000 households – collectively received over $340 billion.2 This is more than double California’s General Fund spending in the 2019-20 budget and more than 10 times the income needed to lift every Californian above the poverty line.3 This concentration of income at the top reinforces racial and ethnic disparities and prevents economic gains from being shared equitably as Black and Latinx Californians are underrepresented among the highest-income households due to legacies of racist policies and ongoing discrimination.4

Child poverty is one of the most significant challenges facing Californians. Nearly 1 in 5 children in the state (19.8%) – 1.8 million in total – lived in a family that could not afford basic needs in 2018.5 The vast majority of these children live in working families, which means that their families’ economic challenges largely result from low pay, especially relative to high housing costs. Children of color, particularly Latinx and Black children, are far more likely to experience economic hardship in California. Nearly one-third of Latinx children (31%) and over one-quarter of Black children (26%) lived in poverty between 2013 and 2017 – more than twice the share of white children in poverty (12%). This substantial gap reflects a number of factors. For example, Latinx and Black Californians are more likely to be paid low wages and to experience financial strain due to high housing costs than white Californians. In addition, Latinx, Black and other Californians of color are less likely to own their homes and have other forms of wealth that help families weather financial setbacks.6

Rising housing costs and stagnating wages are two key challenges Californians face each day as too many struggle to make ends meet. The high cost of housing in many parts of California is one of the primary drivers of California’s high poverty rate – ranked first among the 50 states – under the Supplemental Poverty Measure, which accounts for differences in the local cost of living. Unaffordable housing costs contribute to the homelessness crisis California faces, with over 150,000 homeless residents in 2019, the vast majority of them unsheltered .7 Housing affordability is a challenge Californians experience in all regions of the state, even in areas with lower housing costs, because incomes are also typically lower in these areas. Renters and households with the lowest incomes are hit the hardest. Specifically, more than half of California renter households and 8 in 10 households with incomes below 200% of the federal poverty line pay an unaffordable share of income toward housing.
Why is housing affordability particularly challenging for Californians with lower incomes? A key reason is that earnings for low- and mid-wage workers have not kept pace with rising housing costs. In the last decade alone, median household rent has increased by 16%, far outpacing the growth in annual earnings for the typical full-time worker, which grew by only about 2% during the same period, after accounting for inflation. In fact, wages for workers at the low end and middle of the wage scale have been largely stagnant across the past few decades, growing by just 1% and 4%, respectively, after adjusting for inflation. Californians of color are especially affected by these problematic wage trends, because they are disproportionately represented at the low end of the wage scale, typically earning less per hour than white workers. These simultaneous trends of rising housing costs and stagnant earnings for workers with low and middle incomes have triggered a crisis that calls for bold and immediate interventions.

What are the consequences when families and individuals find themselves unable to make ends meet? Californians struggling with economic insecurity face difficult decisions about which basic needs to cover and which to forego. For a single-parent family with two children in California, the average cost of a modest basic needs budget – including housing and utilities, child care, food, health care, transportation, taxes, and miscellaneous other necessary expenses – totals more than $65,000, with housing and child care making up more than half of the total budget. When families do not have enough resources to cover their basic costs, they may be forced to go without adequate food, leave health problems untreated, rely on unstable or unsafe child care, or even fall into homelessness. These experiences can have serious consequences for individuals’ health and for children’s long-term educational and economic outcomes. However, policy choices coupled with state investments can help more Californians achieve economic security, and many different policy approaches are available. Policies that increase incomes or make basic needs more affordable allow families and individuals to stretch their resources further and address their most pressing needs.

Supporting policy decisions and ongoing investments to ensure that all Californians share in the state’s prosperity requires a fair and stable revenue system. This is also necessary to protect Californians against hardships during economic downturns. California has the space to generate additional revenue, and policymakers can start by re-evaluating the state’s current system of “tax expenditures.”8 These are tax breaks for individuals and businesses that reduce revenues available to invest in the millions of Californians who face challenges, such as persistent poverty and housing cost increases that have far outpaced wage growth. California will lose an estimated $63 billion – more than 43% of the General Fund budget – to individual and business tax expenditures in the 2019-20 fiscal year. Many of the state’s most expensive tax expenditures primarily benefit higher-income households, exacerbating income and wealth inequality, while others – targeted to businesses – serve dubious purposes or are of questionable effectiveness. One consequence of business tax expenditures, combined with corporate tax rate cuts over past decades, is that the share of corporate income paid in state taxes has declined by more than half since the 1980s. Policymakers could make the tax system fairer and raise additional revenue to support investments that not only help Californians cover the costs of their basics needs but also help low- and middle-income households build their wealth. Achieving these priorities requires not just examining tax rates and exploring potential new sources of revenue, but also engaging in a comprehensive review of the state’s tax expenditures – and eliminating or restructuring those that are ineffective or inequitable.
Policymakers can make a commitment to all Californians: as the state looks to secure and build its wealth it can also seek policies that support children, families, and individuals struggling to afford the costs of living who are blocked from sharing in the state’s prosperity. By pursuing policies that prevent the concentration of wealth and income from being held amongst a few, state lawmakers can also address the structural racism that blocks Californians of color from expanding their incomes and wealth. California has the resources to do better for all its people.
1 Capital gains income is income earned when an asset, such as shares of stock or real estate, is sold for more than its purchase price.
2 Budget Center analysis of Franchise Tax Board data.
3 The poverty line calculation is based on the Supplemental Poverty Measure and comes from a Budget Center analysis of US Census Bureau, Current Population Survey data.
4 Budget Center analysis of US Census Bureau, American Community Survey data.
5 This is based on the Supplemental Poverty Measure, which is more accurate than the official poverty measure in part because it takes into account California’s high housing costs.
6 Wealth is commonly measured in terms of net worth — the difference between gross assets and debt. Wealth provides families with financial security because the greater a family’s net worth, the more resources they have to weather costly unexpected events.
7 US Department of Housing and Urban Development, Secretary Carson Certifies Annual Data: Homeless Ticked Up in 2019, Driven by
Major Increases in California (December 20, 2019).
8 Tax expenditures are exceptions to “normal tax law” and include, but are not limited to, exemptions, deductions, exclusions, credits, deferrals, elections, and preferential tax rates. Unlike direct state spending, tax expenditures are not regularly debated or considered as part of the budget process, and can only be eliminated with a two-thirds vote of each house of the Legislature.
Join our email list!
It’s hard work to be able to afford to live, raise a family, and eventually retire in California, especially for workers with low or moderate incomes. While the plight of these workers has never been easy — and workers who are black, Latinx, or women experience some of the greatest economic disadvantages and discrimination in the workplace — research shows that wages and benefits have significantly eroded for many Californians in recent decades. Many workers are being paid little more today than workers were in 1979 even as worker productivity has risen. Fewer employees have access to retirement plans sponsored by their employers, leaving individual workers on their own to stretch limited dollars and resources to plan how they’ll spend their later years affording the high cost of living and health care in California. And as union representation has declined, most workers today cannot negotiate collectively for better working conditions, higher pay, and benefits, such as retirement and health care, like their parents and grandparents did. On top of all this, workers who take on contingent and independent work (often referred to as “gig work”), which in many cases appears to be motivated by the need to supplement their primary job or fill gaps in their employment, are rarely granted the same rights and legal protections as traditional employees. In other words, this work arrangement further shifts responsibilities away from businesses, causing workers to shoulder significant risk and, where supports exist, causing the public sector to help fill the gap.
In this report, we look at five key changes in the job market that show that the contract between workers and businesses has shifted such that many Californians can no longer count on their jobs to provide economic security. Specifically:
This report also shows how state leaders have begun to take steps to respond to some of these challenges, but highlights the fact that additional policies are needed to ensure that California’s workers can share in the prosperity that they help to create.
Earnings for California’s workers at the low end and middle of the wage scale have generally declined or stagnated for decades. In 2018, the median hourly earnings for workers ages 25 to 64 was $21.79, just 1% higher than in 1979, after adjusting for inflation ($21.50, in 2018 dollars) (Figure 1). Inflation-adjusted hourly earnings for low-wage workers, those at the 10th percentile, increased only slightly more, by 4%, from $10.71 in 1979 to $11.12 in 2018. Much of this increase occurred in recent years, likely due to the rising state minimum wage as well as the improving job market. In contrast with the experience of low- and mid-wage workers, high-wage workers — those at the 90th percentile — saw their hourly earnings increase by 43%, after adjusting for inflation, from $40.19 in 1979 to $57.65 in 2018. These hourly wage disparities translate into sizeable income gaps. Someone earning at the 90th percentile in 2018 would earn an annual salary of $115,300 if she worked full-time, year-round, while someone working just as much but earning at the 10th percentile would have an annual income of just $22,240. (As striking as this income gap is, disparities in wealth are even greater.)[1]

Decades of stagnating wages represent an especially big challenge considering California’s high cost of living and particularly high housing costs. In just the last decade alone, the increase in the typical household’s rent far outpaced the rise in the typical full-time worker’s annual earnings, suggesting that working families and individuals are finding it increasingly difficult to make ends meet.[2] In fact, the basic cost of living in many parts of the state is more than many single individuals or families can expect to earn, even if all adults are working full-time.[3]
Black and Latinx workers in California are disproportionately represented at the low-end of the wage scale where wages have stagnated. They also are typically paid far less than white workers. Between 2016 and 2018, the median hourly wage for Latinx workers ($16.51) was just 60% of the median hourly wage of their white counterparts ($27.64) and the median hourly wage for black workers ($19.04) was just 69% of that of white workers (Figure 2).[4]

Other workers of color also tend to be paid less per hour than white workers. The median hourly wage for American Indian and Alaska Native workers ($20.41) and for Hawaiian and Pacific Islander workers ($20.66) was only about three-quarters of that of white workers between 2016 and 2018. Additionally, the median hourly wage for workers who identify with more than one race ($22.92) was 83% of their white counterparts’ median wage. The typical hourly earnings for Asian workers ($27.27), on the other hand, was nearly on par with what white workers were typically paid (27.64).[5]
Gender disparities in hourly earnings also persist. Women in California are paid less per hour than men across the earnings distribution. For instance, the median hourly wage for women ($19.95) was about 85% of that of men ($23.38) between 2016 and 2018. Among highly paid workers, this gap was even wider. Women at the 90th percentile earned $37.18 per hour — 81% of what men at the 90th percentile earned per hour ($45.64). At the low-end of the wage scale, the gender wage gap was narrower, but still notable. Women at the 10th percentile earned $12.22 per hour between 2016 and 2018 — 89% of what men at the 10th percentile earned per hour ($13.72).[6]
Discrimination — both explicit and implicit — contributes to racial, ethnic, and gender disparities in workers’ wages in two ways. First, discrimination is a factor in racial, ethnic, and gender differences in worker characteristics that directly affect how much workers are paid, such as educational attainment and occupation. For example, discrimination can affect where families live, which can determine whether their children have access to high-quality schools, which in turn can influence whether their children attend college, which affects the career opportunities they are able to pursue as adults. At the same time, racial, ethnic, and gender discrimination in the workplace plays an important role in pay disparities between otherwise similar workers. Specifically, research finds that differences in education, occupation, and other easily measurable worker characteristics cannot fully explain why workers of color tend to earn less than white workers and why women typically earn less than men. This indicates that harder-to-measure factors, such as workplace discrimination, play a role. For instance, one study found that nearly half of the earnings gap between black and white men could not be explained by easily measurable worker factors, such as educational attainment.[7] It also found that the unexplained portion of the wage gap had increased substantially since 1979 for both men and women. Another study found that much of the earnings gap between Latinx and white workers could not be explained by worker characteristics, including age — which serves as a proxy for years of work experience — and immigration status.[8] Additionally, one study found that more than one-third of the difference in women’s and men’s pay cannot be explained by gender differences in easily measurable factors, such as occupation and race.[9]
The state’s economy — as measured by its Gross Domestic Product (GDP) — can be broken into two main segments: 1) income going to worker compensation in the form of wages, salaries, and benefits, and 2) income going to owners of capital, such as corporate profits and rents collected by property owners. Additionally, a smaller third segment represents taxes paid by businesses as costs of production.
While California’s private-sector economy has grown by more than half since the beginning of the 21st century, a declining share has been going to workers. (Private-sector GDP accounts for nearly 90% of California’s total GDP.) Since 2001, the share of state private-sector GDP that has gone to worker compensation has fallen by 5.6 percentage points — from 52.9% to 47.3% (Figure 3). While workers’ share of income has increased from its 20-year low point in 2010, it still has yet to recover from its sharp decrease since its peak in 2001. Meanwhile, the share of the state’s private-sector GDP comprised of capital income increased from 41.0% in 2001 to 46.0% in 2017.[10]

National data examining workers’ share of net income generated only by private corporations — representing a clearer picture of how much income generated by businesses is paid to workers employed in those businesses — also show a similar sharp decline after 2001.[11] These data suggest that workers have lost bargaining strength relative to their employers.
This divergence between the shares of both state and national income going to workers and owners of capital contributes to rising income inequality since lower- and middle-income households depend more heavily on income from employment while high-income households receive larger shares of their income from investments. Additionally, capital income itself is highly concentrated among the highest-income households.
The decline in labor’s share of income has also contributed to the growing gap between productivity growth and workers’ pay. When workers become more productive (that is, they produce more per hour worked), businesses become more profitable, and that can result in higher compensation for workers. Instead businesses can choose to retain those profits or distribute them to shareholders. At the national level, productivity and compensation for the average worker grew at roughly the same rates until the early 1970s; after that, productivity grew much faster than the typical worker’s compensation, as the benefits of productivity growth have increasingly gone to the owners of capital and highly paid managers while wages have stagnated.[12] An increasingly substantial portion of the gap between productivity and compensation growth can be explained by the decline in workers’ share of income.[13]
California’s workers today are far less likely to have access to employer-sponsored retirement plans than workers did 40 years ago. As of 2018, fewer than 2 in 5 private-sector workers ages 25 to 64 (39%) had access to a retirement plan sponsored by their employer, compared to more than half (54%) of prime working-age private-sector workers in 1980 (Figure 4).[14] Meanwhile, more than two-thirds of public-sector workers ages 25 to 64 (68%) had access to an employer-sponsored retirement plan in 2018, down from 83% in 1980.[15] While access to this benefit has eroded for both private- and public-sector workers, employees in the public sector are far more likely than their private sector counterparts to have the ability to save for retirement through their job.

The rising share of workers without access to employer-sponsored retirement plans is a troubling trend given that workers who lack these plans tend not to have the ability to save for retirement at all given limited resources, and that Social Security benefits — while critical — are not sufficient to provide security in retirement for many people.[16] Moreover, changes in the type of retirement plans offered by employers mean that many workers cannot count on having a secure retirement even if they do participate in these plans. Specifically, private-sector employers are much less likely today to offer “defined-benefit” plans, which are employer-funded and guarantee workers a fixed benefit in retirement typically based on salary, years of work, and age at retirement.[17] Instead, they are much more likely to offer “defined-contribution” plans, such as 401(k)s, which do not guarantee a fixed benefit and which shift substantial, and sometimes all, responsibility onto workers to save and invest since employers generally are not required to make any contributions to these plans.[18]
The share of workers in California who are either union members or who are covered by a union contract has been decreasing for decades. In 1984, one in four (25%) workers belonged to a union, including 57% of public sector workers and 19% of private sector workers (Figure 5). By 2018, that share had fallen to about one in six (16%), including 53% of public sector workers and 9% of private sector workers.

Nationally, the fall in union membership is associated with changes such as manufacturing’s shrinking share of the workforce, a shifting global economy, and a restrictive political environment.[19] The falling unionization rate is also associated with weaker protections for workers. Workers in a union tend to have higher wages, as well as greater access to employment-based health coverage and retirement benefits, compared to similar workers without union coverage.[20] Unions are also particularly beneficial to women, black and Latinx workers, and immigrants.[21] Additionally, research indicates that workers whose workplace is not unionized also gain when a substantial share of workers in their industry are represented by unions. For example, in industries with sufficient worker representation, nonunion firms must offer higher wages and benefits to compete with unionized workplaces.[22]
As noted above, the share of workers who are members of unions or covered by union contracts is much higher in the public sector than in the private sector. However, a recent Supreme Court decision (Janus vs AFSCME Council 31), which prohibits public sector unions from collecting fees from workers who are covered by union contracts but are not themselves union members, is likely to weaken public sector unions moving forward by decreasing the financial resources available to them. This decline in the strength of public sector unions, on top of the overall decline in the share of California workers who are represented by unions, could lead to negative consequences for the well-being of California’s workers, including rising wage, income, and workplace inequality.[23]
Economists, scholars, and advocates have raised concerns about a rise in “contingent work,” or jobs that fail to provide workers with stable or predictable incomes, benefits, and/or key worker protections. These jobs may include some workers in on-call, temporary agency, and contract company jobs, as well as some kinds of independent contractors.[24]
Lack of good data makes it difficult to know how common these various forms of work and workers are today, particularly at the state level, and whether they are more common than in the past. However, a recent study provides detailed information about one subset of these workers: independent contractors who work for companies and whose earnings are reported to tax agencies. These data are particularly relevant to recent debates about changes in the job market that have focused on the rapid growth of the “online gig economy,” where web applications are used to request and schedule workers who provide services, such as ride-sharing and delivery. Concerns have been raised that these “apps” are fueling the growth of a contingent workforce made up of workers generally classified as independent contractors who actually should be classified as employees.[25] This distinction is important because independent contractors, unlike traditional employees, are not protected by labor laws, including minimum wage and anti-discrimination provisions; do not qualify for employer-provided benefits; are excluded from social insurance programs, such as unemployment insurance and workers’ compensation; and cannot organize in labor unions. When workers are misclassified as independent contractors instead of employees they are more likely to lack key worker protections and benefits.[26]
The aforementioned study finds that nationally a small, but growing share of workers has earnings from independent contracting with businesses.[27] Similarly, in California, 13.7% of workers had earnings from this source in 2016, up from 11.5% in 2000 — a 2.2 percentage point increase (Figure 6).[28] The majority of this growth (1.2 percentage points) occurred since 2012 and was entirely driven by an increase in workers engaged in online gig work. In fact, if it weren’t for online gig work, the share of workers with earnings from independent contracting in California would have declined slightly between 2012 and 2016. (Online gig work was virtually non-existent prior to 2012.)

Nevertheless, online gig workers make up just a fraction of the total workers examined through this study and only a small share of firm-facing independent contractors.[29] In addition, the majority of these workers appear to receive only small amounts of income from online gigs and use this form of work to supplement a wage and salary job that constitutes the primary source of their earnings.[30] It is not clear whether these workers are using online gig work to cover gaps in employment while they are between wage and salary jobs or to boost their incomes by working contracting gigs on the side at the same time that they are working in wage and salary jobs.
Although this study contributes significantly to our understanding of independent contracting, it does not provide a complete picture of this work, nor of the broader category of contingent work. For example, it does not include people engaged in independent contracting with individuals or households, such as nannies, landscapers, housecleaners, and day laborers, and it excludes all “under the table” independent contracting that is not reported to tax agencies.[31] Even among the workers covered by the data, it also does not shed light on the extent to which these workers are properly classified as independent contractors or are misclassified and should be considered employees, nor what impact misclassification may have on these workers’ economic security. Nevertheless, this study shows that at the very least millions of Californians are engaged in a form of work that is excluded from labor laws and social insurance programs, raising questions about what these forms of work mean for workers’ economic security. More data are needed to better understand the full scale and range of contingent work arrangements and how these arrangements affect workers.
Major changes in the job market in recent decades show that businesses are assuming less responsibility for helping workers achieve economic security, leaving workers to shoulder much greater risk than in the past and causing the public sector to fill in, where supports are available. The end result is that California’s workers are increasingly locked out of the prosperity that they helped to create.
The challenges facing workers today present an opportunity for state leaders to restore the promise that hard work pays off and to leverage the potential of the state’s workforce to build a stronger economy. California’s leaders have already begun to respond to some of these challenges, including by raising the state’s minimum wage, establishing and subsequently expanding the CalEITC — a refundable state tax credit targeted to low-earning workers — and creating CalSavers, a workplace retirement savings option for private sector employees.[32] But far more is needed for workers and their families to be able to thrive and improve the quality of their lives. Additional policies in a range of areas are needed, including:
Californians labor every day to provide for their families, build success in their workplaces, and keep the state’s economy strong, but there is no guarantee that their contributions will be rewarded with economic security. As a result, the well-being of California’s people as well as the strength of the state’s economy are increasingly at risk. This problem necessitates public policy responses to ensure that all of us — businesses, government, and workers — share in the responsibility for taking care of workers so that the people who help make California’s prosperity possible can prosper themselves.
[1] Wealth is commonly measured in terms of net worth — the difference between gross assets and debt. Wealth inequality is even starker than income inequality. The top 1% of Americans took home 24% of all income, but they also had 39% of all wealth in 2016. See Esi Hutchful, The Racial Wealth Gap: What California Can Do About a Long-Standing Obstacle to Shared Prosperity (California Budget & Policy Center: December 2018).
[2] Specifically, inflation-adjusted median household rent rose by 16% between 2006 and 2017, while inflation-adjusted median annual earnings for individuals working at least 35 hours per week and 50 weeks per year rose by just 2%, according to a Budget Center analysis of US Census Bureau, American Community Survey data.
[3] Sara Kimberlin and Amy Rose, Making Ends Meet: How Much Does It Cost to Support a Family in California? (California Budget & Policy Center: December 2017).
[4] Three years of data were pooled together to increase the reliability of the estimates for demographic groups based on small samples. Racial and ethnic groups are mutually exclusive.
[5] These figures provide only a preliminary understanding of disparities by race and ethnicity, as the data are not available or cannot be reported for all racial and ethnic groups.
[6] These data provide only a preliminary understanding of disparities by gender because they are not available for non-binary and gender-nonconforming people.
[7] Mary C. Daly, Bart Hobijn, and Joseph H. Pedtke, Disappointing Facts About the Black-White Wage Gap (Federal Reserve Bank of San Francisco: September 5, 2017).
[8] Marie T. Mora and Alberto Dávila, The Hispanic-White Wage Gap Has Remained Wide and Relatively Steady: Examining Hispanic-White Gaps in Wages, Unemployment, Labor Force Participation, and Education by Gender, Immigrant Status, and Other Subpopulations (Economic Policy Institute: July 2, 2018).
[9] Francine D. Blau and Lawrence M. Kahn, The Gender Wage Gap: Extent, Trends, and Explanations (National Bureau of Economic Research: January 2016)
[10] The Bureau of Economic Analysis (BEA) labels this as “Gross Operating Surplus,” which includes corporate profits, proprietors’ income, rental income of persons, net interest, capital consumption allowances, business transfer payments, nontax payments, the current surplus/deficit of government enterprises, and fixed investment. As the BEA notes, “proprietors’ income includes some portion of labor compensation that should be included in the employee compensation component of GDP by state, but it is not possible to separate the labor share of proprietors’ income from the capital share.” Bureau of Economic Analysis, Gross Domestic Product by State Estimation Methodology (2017), p. 2. Additionally, since this measure includes rental incomes – including “imputed rent,” or the hypothetical income that a homeowner could get from renting out their home – the sharp increase in property values in California may explain part of the decrease in labor’s share of income.
[11] Focusing on the corporate sector rather than the whole economy provides a clearer breakdown of the relative shares of labor and capital income because it does not include items that cannot clearly be assigned to either labor or capital. For example, proprietor’s income – the income of non-corporate businesses – is included in measures of the total economy, but includes both labor and capital components. In addition to focusing only on the corporate sector, this national measure uses a net measure of income that accounts for depreciation – or the reduction in value of assets over time through normal wear and tear and technological obsolescence. Looking at labor’s share of net income may be more appropriate in explaining labor market dynamics, since resources used to reinvest in corporate capital stock are not distributed to either workers or owners of capital. Josh Bivens, The Fed Shouldn’t Give Up on Restoring Labor’s Share of Income — And Measure It Correctly (Economic Policy Institute: January 30, 2019).
[12] Josh Bivens and Lawrence Mishel, Understanding the Historic Divergence Between Productivity and a Typical Worker’s Pay (Economic Policy Institute: September 2, 2015). “Typical workers” are defined as those that the Bureau of Labor Statistics classifies as production and nonsupervisory employees, who make up about 80% of the nation’s private nonfarm workforce. “Productivity growth” is defined as the growth of output of goods and services minus depreciation per hour worked.
[13] Josh Bivens and Lawrence Mishel, Understanding the Historic Divergence Between Productivity and a Typical Worker’s Pay (Economic Policy Institute: September 2, 2015), Table 1.
[14] Because not all workers offered retirement plans through their employers participate in those plans, the share of private-sector workers with workplace retirement savings was even lower – 32% in 2018. Budget Center analysis of US Census Bureau, Current Population Survey data. Figures reflect a two-year moving average. For example, 2018 reflects data for 2017 and 2018 combined. Two years of data were pooled together to increase the reliability of the estimates. The majority of private-sector workers in each major racial or ethnic group in California lack access to employer-sponsored retirement plans; however, the share of Latinx workers without access is particularly high. Nearly seven in 10 Latinx workers ages 25 to 64 who were employed in the private sector (69%) had no access to a retirement plan through their job in 2014-2017, compared to 55% of white workers, 57% of black workers, and 60% of Asian workers. Nari Rhee, Half of California Private Sector Workers Have No Retirement Assets (University of California Berkeley Center for Labor Research and Education: July 2019).
[15] The share of public-sector workers who were participating in retirement plans through their employers was even lower – 61% in 2018.
[16] Alicia H. Munnel, et al., The Pension Coverage Problem in the Private Sector (Center for Retirement Research at Boston College: September 2012), p. 3; Nari Rhee, Half of California Private Sector Workers Have No Retirement Assets (University of California Berkeley Center for Labor Research and Education: July 2019); Paul N. Van de Water and Kathleen Romig, Social Security Benefits Are Modest: Benefit Cuts Would Cause Hardship for Many (Center on Budget and Policy Priorities: Updated August 7, 2017); and Steven A. Sass, Can We Increase Retirement Saving? (Center for Retirement Research at Boston College: September 2016).
[17] US Government Accountability Office, The Nation’s Retirement System: A Comprehensive Re-evaluation Is Needed to Better Promote Future Retirement Security (October 2017), p. 9. In contrast with the private sector, nearly all full-time workers in the public sector have access to defined-benefit plans. However, many state and local governments have made significant changes to their public pension systems in recent years in order to reduce costs, including reducing benefit levels for new employees and increasing current employees’ contributions. See Urban Institute, State and Local Finance Initiative and Jean-Pierre Aubry and Caroline V. Crawford, State and Local Pension Reform Since the Financial Crisis (Center for Retirement Research at Boston College: January 2017).
[18] Experts attribute the shift toward defined-contribution plans to a number of factors, including that these plans give employers greater control over spending on wages and benefits, particularly during economic downturns. In addition, experts point to policy changes, such as those enacted through the Employee Retirement Income Security Act (ERISA) of 1974 and the Pension Protection Act (PPA) of 2006 as likely having reduced the incentive for employers to offer defined-benefit plans. Experts also suggest that the declining share of workers with access to defined-benefit plans reflects declining union membership, which reduced the ability of workers to collectively negotiate access to those plans. Edward A. Zelinsky, “The Defined Contribution Paradigm” Yale Law Journal 114:3 (2004), pp. 451-534 and US Government Accountability Office, The Nation’s Retirement System: A Comprehensive Re-evaluation Is Needed to Better Promote Future Retirement Security (October 2017).
[19] John Schmitt, Unions and Upward Mobility for Service-Sector Workers (Center for Economic and Policy Research: April 2009), p. 2.
[20] Ken Jacobs and Sarah Thomason, The Union Effect in California #1: Wages, Benefits, and Use of Public Safety Net Programs (University of California Berkeley Labor Center: May 31, 2018).
[21] Sarah Thomason and Annette Bernhardt, The Union Effect in California #2: Gains for Women, Workers of Color, and Immigrants (University of California Berkeley Labor Center: June 7, 2018).
[22] Jake Rosenfeld, Patrick Denice, and Jennifer Laird, Union Decline Lowers Wages of Nonunion Workers (Economic Policy Institute: August 30, 2016), p. 2.
[23] Jake Rosenfeld, Patrick Denice, and Jennifer Laird, Union Decline Lowers Wages of Nonunion Workers (Economic Policy Institute: August 30, 2016), p. 2.
[24] Definitions of what constitutes contingent work vary. There is general agreement that contingent workers should include those without job security and those whose schedules vary, such as temporary workers, on-call workers, and contract workers. There is less agreement as to whether they should include independent contractors, self-employed workers, and standard part-time workers. US Government Accountability Office, Contingent Workforce: Size, Characteristics, Earnings, and Benefits (April 20, 2015). Some researchers believe that subcontracting is a more important example of the changing nature of work than independent contracting, but data limitations make understanding its scope and consequences difficult. See, Annette Bernhardt, Making Sense of the New Government Data on Contingent Work (June 10, 2018).
[25] Whether these workers should be classified as independent contractors or employees is currently being debated. Independent contractors in the online gig economy could be reclassified as employees following a recent California Supreme Court ruling, Dynamex Operations West, Inc. v. Superior Court of Los Angeles County, which specified a three-part test that companies must use to prove that they have lawfully classified workers as independent contractors. Whether Dynamex actually means online gig workers have to be reclassified as employees will either be determined through litigation or legislation. One bill that could potentially clarify that these workers and some other workers currently treated as independent contractors should be classified as employees by codifying the Dynamex ruling in state law, Assembly Bill 5 (Gonzalez), is currently moving through the Legislature.
[26] Concerns about misclassified workers actually extend well beyond the online gig economy, as the misclassification of independent contractors is thought to occur within a wide range of industries throughout the job market, including home care, janitorial services, construction, trucking, hospitality, and restaurants. Annette Bernhardt and Sarah Thomason, What Do We Know About Gig Work in California? An Analysis of Independent Contracting (University of California Berkeley Center for Labor Research and Education: June 2017).
[27] Brett Collins, et al., Is Gig Work Replacing Traditional Employment? Evidence From Two Decades of Tax Returns (Internal Revenue Service: March 25, 2019). “Workers” refers to individuals with earnings on certain tax forms. Specifically, it includes those who have any wage earnings reported on W2 forms, self-employment earnings reported on Schedule SE, or non-employee compensation reported on 1099-MISC or 1099-K forms as long as the individuals appear on a tax return. 1099-MISC and 1099-K forms are used to identify self-employed independent contractors as these forms indicate annual compensation of at least $600 provided to such workers. This study does not look at all independent contractors, but rather only those who provide work to firms or whose work is mediated by firms and whose earnings are reported to tax agencies. This means that people who contract with individuals or households as well as those whose earnings are not reported to tax agencies are excluded from this study.
[28] Findings for California reflect a Budget Center analysis of data presented in the appendix of Brett Collins, et al., Is Gig Work Replacing Traditional Employment? Evidence From Two Decades of Tax Returns (Internal Revenue Service: March 25, 2019).
[29] As mentioned earlier, this study includes workers who have any wage earnings reported on W2 forms, self-employment earnings reported on Schedule SE, or non-employee compensation reported on 1099-MISC or 1099-K forms as long as the individuals appear on a tax return. Fewer than 2 in 100 California workers (1.8%) were engaged in online gig work in 2016, up from just 0.02% in 2012, according to this study, and 13.5% of independent contractors had earnings from the online gig economy in 2016, up from 0.1% in 2012. This confirms findings of other research that online gig workers represent just a fraction of the total workforce.
[30] The share of US workers with earnings from independent contracting who also had wage earnings exceeded 60% each year from 2000 to 2016, according to this study. Also, US workers with earnings from independent contracting generally earn less than $7,500 annually. Among workers engaged in online gig work, more than 8 in 10 coupled that work with wage earnings in 2016 and more than half earned just $2,500 or less from the online gig economy. This study does not provide comparable data specific to California. This confirms findings of other studies, such as Diana Farrell, Fiona Greig, and Amar Hamoudi, The Online Platform Economy in 2018: Drivers, Workers, Sellers, and Lessors (JPMorgan Chase & Co. Institute: September 2018).
[31] As largely “under the table” work, it is difficult to determine how many people are engaged in this work and estimates vary widely. See Demetra Smith Nightingale and Stephen A. Wandner, Informal and Nonstandard Employment in the United States: Implications for Low-Income Working Families (The Urban Institute: August 2011). Like online gig workers, these independent contractors lack the protections and benefits of standard employment, but unlike online gig workers, they are not performing work that is new and therefore have not received significant attention in recent public debates.
[32] To learn more about California’s plan to raise the statewide minimum wage to $15 per hour, see Alissa Anderson and Chris Hoene, California’s $15 Minimum Wage: What We Know and Don’t Know (California Budget & Policy Center: April 13, 2016). To learn more about the CalEITC, see Alissa Anderson and Sara Kimberlin, Expanding the CalEITC: A Smart Investment to Broaden Economic Security in California (California Budget & Policy Center: March 11, 2019) and California Budget & Policy Center, “Budget Significantly Expands California Earned Income Tax (CalEITC)” in First Look: 2019-20 Budget Includes Balanced Investments, Leaves Opportunities to Improve the Economic Well-Being of More Californians (July 2019). To learn more about CalSavers, see https://www.calsavers.com/.
Join our email list!
Over the span of a career, most working adults need time off to care for a new child or a sick family member. California policymakers, administrators, and advocates — past and present — have forged a path in building the first comprehensive paid family leave program in the nation. Since the implementation of paid leave in California in 2004, workers across the state have received $8.8 billion in payments while taking time off work to care for their loved ones. Research shows that paid family leave has been beneficial for the workers who have accessed the program and for their employers.
Even though the vast majority of workers in California contribute to the program, paid family leave often does not meet the needs of workers due to an absence of job protections and inadequate payments. Lack of job protections means that workers are not guaranteed their jobs when they return to work. Inadequate payments mean that workers — particularly those with low incomes — often cannot pay their bills if they choose to take paid leave. Moreover, the length of leave — currently just six weeks in California — may not provide enough time for workers to care for their families.
After 15 years of paid family leave, it is time to update and improve this critical program so that more Californians can benefit. Governor Newsom has pledged to expand paid family leave during his time in office, and state leaders took initial steps toward this goal as part of the 2019-20 budget agreement.
Read the full report.
Monica Davalos provided research assistance on this report.
Support for this work is provided by First 5 California.
Join our email list!
State policymakers have significantly expanded California’s Earned Income Tax Credit — the CalEITC — since the credit was first enacted in 2015. However, hundreds of thousands of immigrant families are excluded from benefiting from the CalEITC as well as from California’s new Young Child Tax Credit, which is tied to CalEITC eligibility.1
In the 2019-20 budget negotiations, both the Assembly and Senate approved a proposal to extend the credits to these families to increase their economic security and allow more people to share in the economic prosperity that they help to create. Nevertheless, this proposal was left out of the final 2019-20 budget, despite the strong equity and economic cases for making the credits inclusive of immigrant families. With considerable ongoing interest in reviving this proposal next year, this analysis highlights five reasons that policymakers should include in the CalEITC and Young Child Tax Credit immigrant families who pay taxes, earn little from their jobs, and experience significant economic disparities in our communities.
Read the full report.
Join our email list!
The California Budget & Policy Center’s guide, The CalEITC and Young Child Tax Credit: Smart Investments to Broaden Economic Security for Californians, provides an overview of how refundable state income tax credits to help people who earn little form their jobs to pay for basic necessities and support families, children, and communities.
Under the 2019-20 state budget, Governor Newsom and the Legislature expanded the California Earned Income Tax Credit (CalEITC) and created the Young Child Tax Credit. The expansion of the CalEITC — originally created in 2015 — included increasing the income limit and increasing the size of the credit for tax filers with low incomes.
Join our email list!
|
|
|
|