The federal Supplemental Poverty Measure (SPM), which improves on the official poverty measure (see note), shows that:
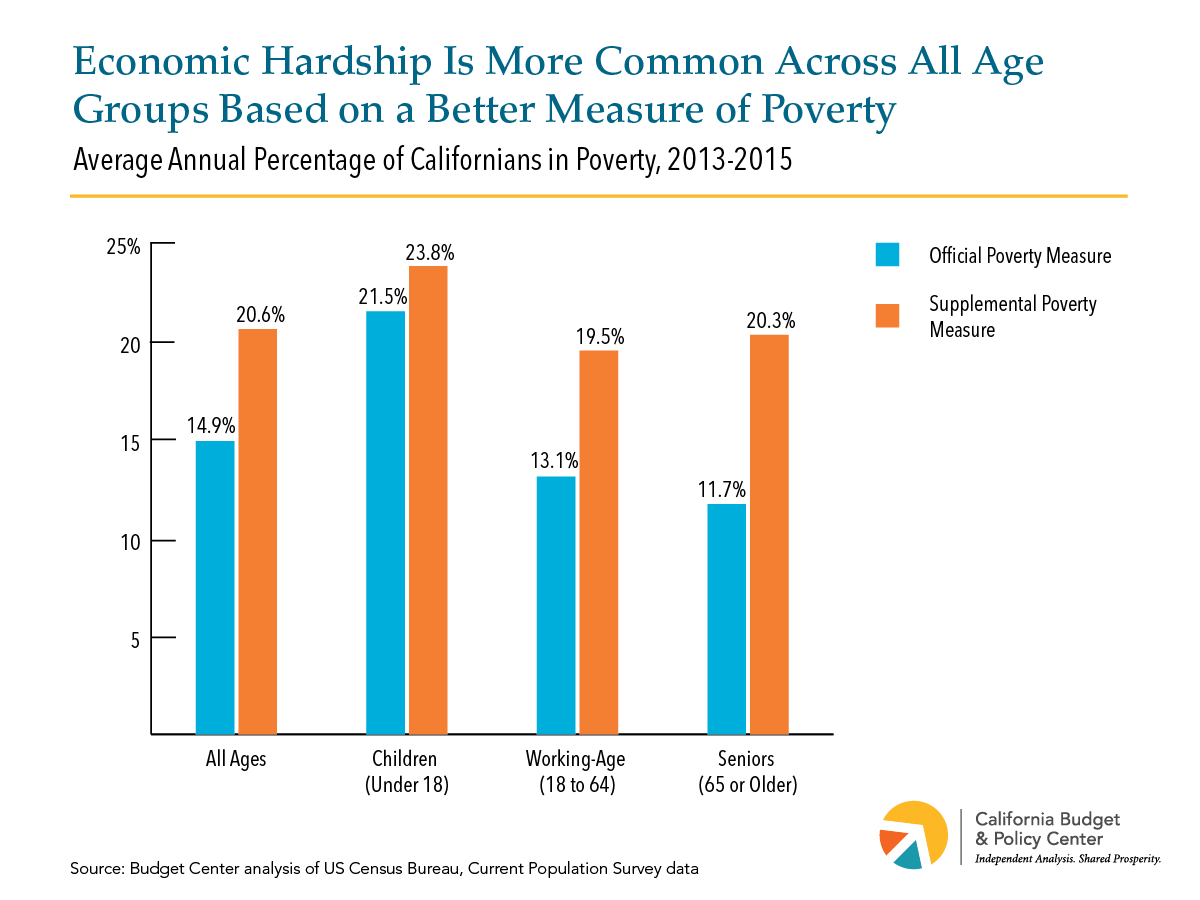
- 1 in 5 Californians (20.6%) struggle to afford basic necessities, up from 14.9% under the official poverty measure.
- Nearly one-quarter of children (23.8%) live in families struggling to get by — a larger share than for adults regardless of which poverty measure is used.
- Seniors are nearly twice as likely to lack adequate resources under this more accurate measure.
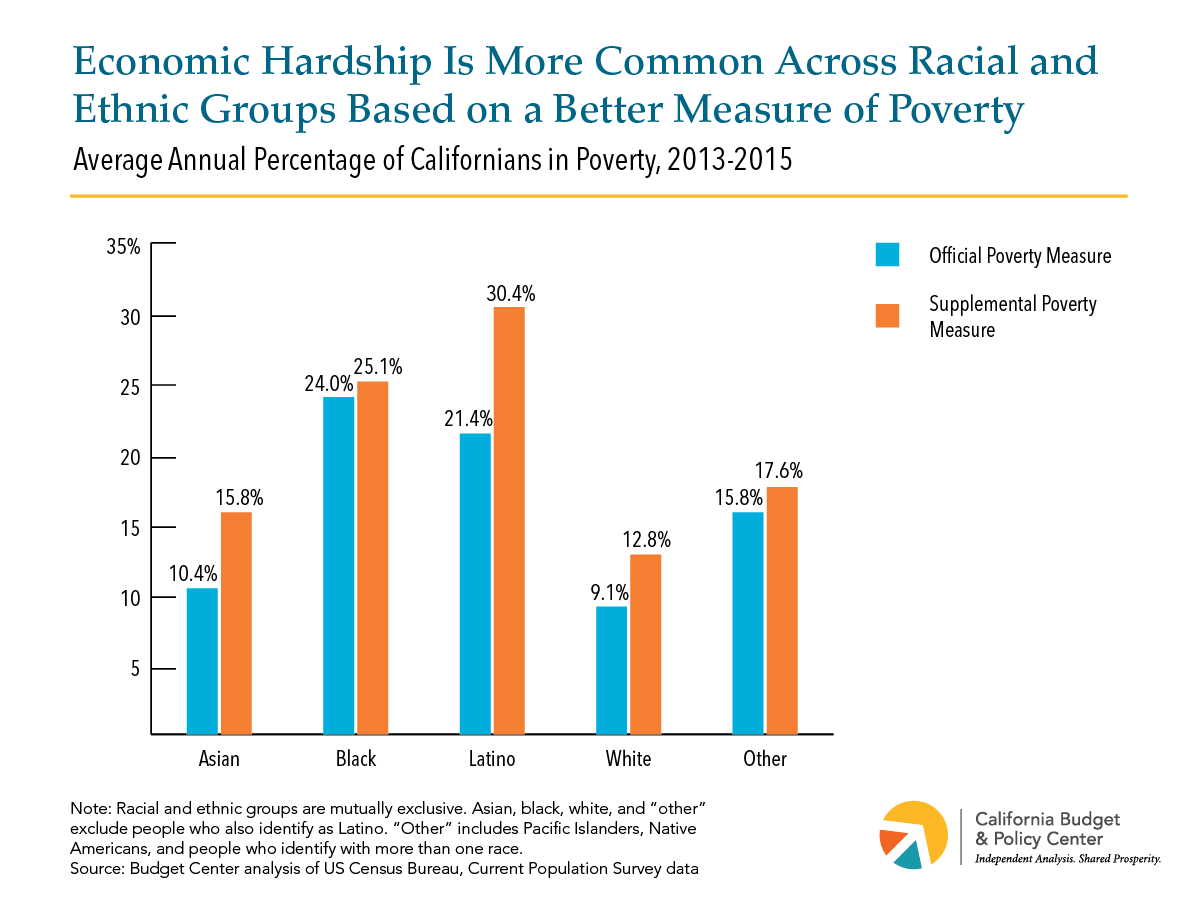
- 1 in 4 black Californians (25.1%) and 3 in 10 Latinos (30.4%) are struggling financially based on the SPM (see chart below).
- Black Californians and Latinos are more likely to face economic hardship than whites, regardless of how poverty is measured.
- The share of Latinos struggling to get by is 9 percentage points higher based on this better measure of hardship.
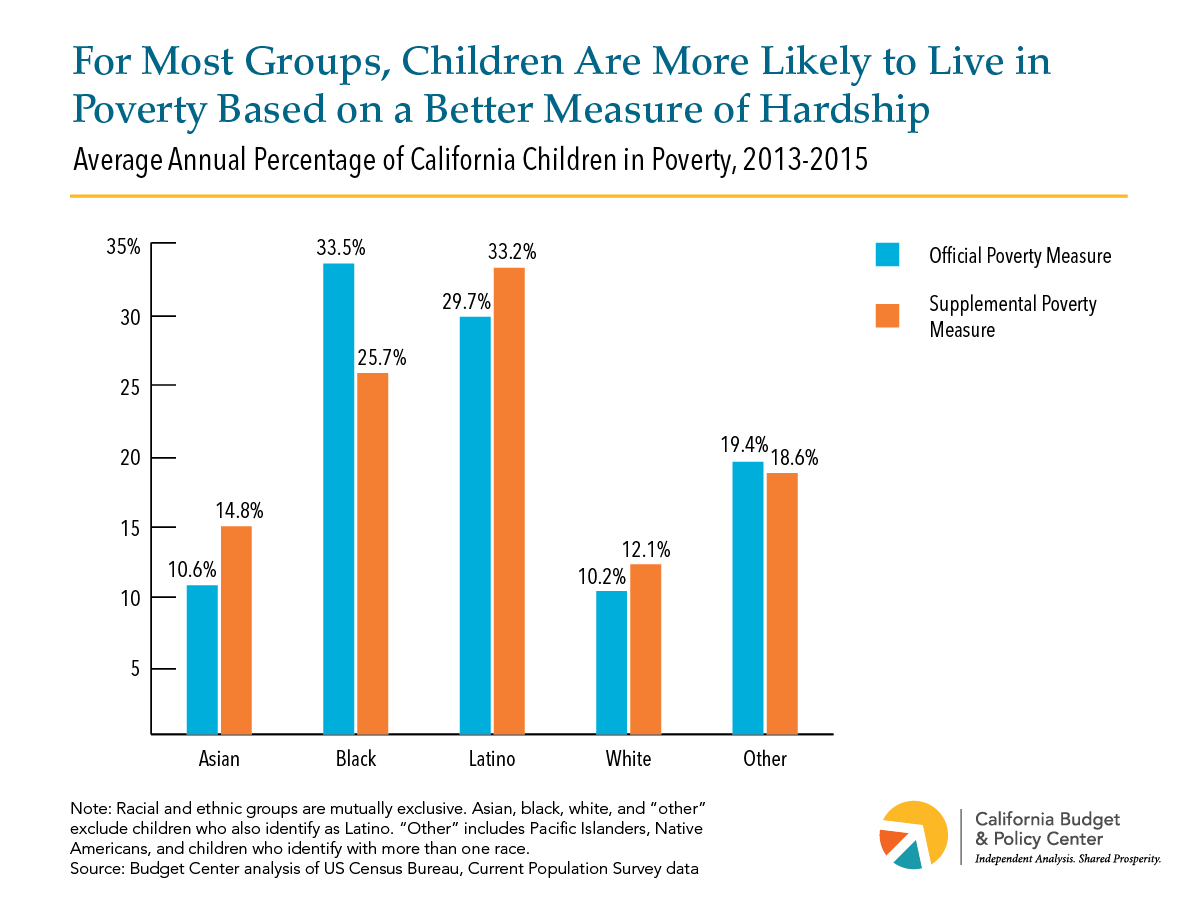
- One-third of Latino children (33.2%) live in poverty based on the SPM, compared to 29.7% under the official measure (see chart below).
- Over one-quarter of black children (25.7%) live in poverty based on the SPM. Although this is unacceptably high, it is nearly 8 percentage points lower than the official poverty rate (33.5%) due to the impact of public supports like CalFresh food assistance and housing assistance.
- Latino and black children are more than twice as likely as white children to live in families that are struggling to get by.
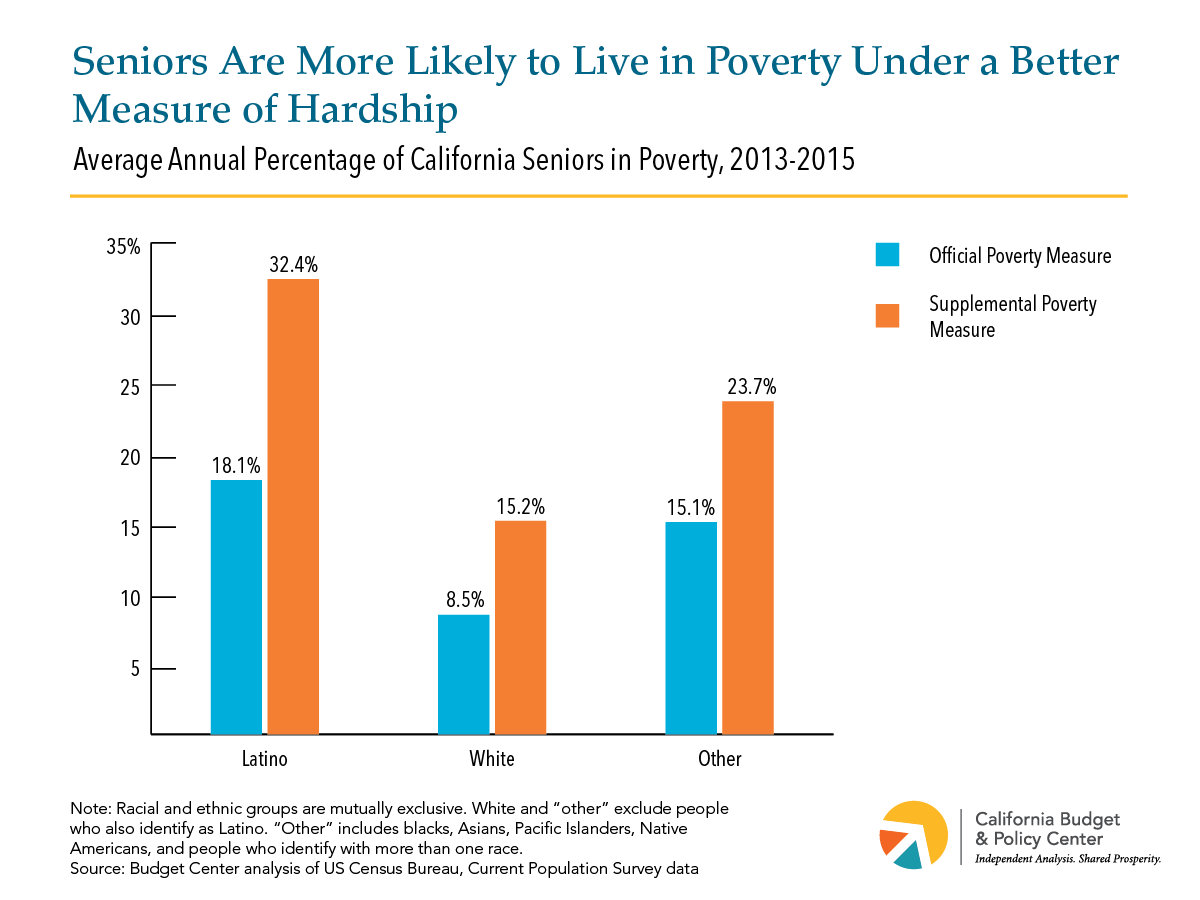
- The share of seniors struggling to make ends meet is substantially higher under the SPM (see chart below).
- Nearly one-third of Latino seniors (32.4%) and nearly one-quarter of other seniors of color (23.7%) struggle financially.
- Seniors of color are more likely than white seniors to live in poverty regardless of which measure of hardship is used.