For the California State Student Association’s “California Higher Education Student Summit (CHESS) 2019,” Policy Analyst Amy Rose presented on the 2019-20 state budget proposal through the lens of higher education and discussed her research on creating an affordable-college model for California.
You may also be interested in the following resources:
-
Report
Trends in Transitional Kindergarten Enrollment in California
key takeaway TK enrollment in California has doubled since 2021-22, with growth across all student groups and high-poverty schools. To ensure all children benefit, the state must address disparities in access for students of color and those from low-income families. Early childhood education is foundational for young children’s development and their long-term outcomes, and preschool … ContinuedEducation -
Report
How California Is Expanding Transitional Kindergarten
key takeaway California is expanding Transitional Kindergarten to all four-year-old children by 2025-26, supported by state investments to improve access, staffing, and equity in public preschool programs. Early learning is foundational for young children’s development, and preschool programs provide essential opportunities for 3- and 4-year-olds. Recognizing this, in 2021, California policymakers embarked on a significant … ContinuedEducation
Stay in the know.
Join our email list!

View the Technical Appendix for this report.
View a presentation of this research.
Earlier estimates of this research were published in The Institute for College Access and Success’ (TICAS) compendium Designing Financial Aid for California’s Future.
Introduction
Historically, the state paid most of the cost of higher education at California’s public institutions: the California Community Colleges (CCC), the California State University (CSU) and the University of California (UC). However, years of budget cuts and tuition hikes have shifted more of the cost to students and their families, especially at the state’s four-year institutions: the CSU and the UC. This cost-shift undermines California’s commitment — as outlined in the Master Plan for Higher Education — to ensuring that a quality higher education is accessible and affordable to all eligible Californians. It also means that more students are graduating with increasing amounts of student loan debt and working excessive hours that impact their ability to graduate on time while others are forgoing higher education altogether.[1] A well-educated workforce is critical to the state’s economic future. Yet, at current rates, California will not produce enough college graduates to meet the demands of the state’s economy in the years ahead.[2]
In order to meet the state’s workforce demands, reforms must be made to ensure all students have access to an affordable higher education that will prepare them to enter the workforce with the skills they need to be successful. One of the greatest challenges for students seeking a higher education, and one of the greatest opportunities for reform, is the design of the financial aid system. Most state and federal student financial aid is linked primarily to tuition and largely fails to assist students with other major costs of college attendance, including housing, food, and transportation. Understanding the full cost of college is essential for decision-makers, advocates, and others who seek to expand college opportunities for all Californians.
This analysis estimates the cost of implementing a state financial aid program designed to enable qualified Californians to pursue undergraduate study full time at any of the three public higher education sectors — the CCC, CSU and UC — eliminating the need for students to take out loans or work unmanageable hours. This analysis develops two models to estimate the cost of an affordable-college program in California. One model estimates the cost of a “shared responsibility” program, in which the state covers students’ remaining unmet financial need after taking into account selected federal grants, an expected parent contribution, an expected student contribution from work earnings, and any currently available state and institutional aid. The second model estimates the cost of a “government responsibility” program, in which the state covers students’ remaining unmet financial need after taking into account only selected federal grants and any currently available state and institutional aid, with no student or parent contribution.
These models are intended to show how the state might calculate the cost of reforms (see the “cost of college” and “paying for college” tables) as well as the total cost of any such changes (see the “total costs” tables). As a point of departure, both of these models assume that all qualified students — based on current estimated enrollment levels at the CCC, the CSU, and the UC during the 2018-19 academic year — would be eligible for new state assistance, regardless of family income. Of course, policymakers could pursue other options. For example, policymakers could choose to focus new state resources on low- and middle-income students, rather than all students, in which case total costs would be lower.
This analysis provides estimates on a per-student, per-sector, and statewide basis. The estimates regarding 1) the cost of college and 2) paying for college are based on the most recent data available from multiple sources. The “cost of college” category consists of institutional costs, such as tuition and fees, and living costs, such as housing and food. The “paying for college” category consists of financial aid as well as expected parent and student contributions (the latter of which are estimated only for the shared responsibility model). A full description of the methodology used to develop this analysis can be found in the Technical Appendix.
Cost of College
Students pursuing a college degree face two main costs: tuition and fees charged by the institution and student-related living expenses such as housing, food, transportation, and books and supplies (often referred to as “non-tuition and fees”). The following table estimates the per-student cost of attendance for each sector. These estimates are for California residents who attend full-time (12 units or more) as an undergraduate at one of the state’s public colleges. This analysis uses full-time enrollment to weight per-student costs by housing type (on-campus, off-campus, or with family), dependency status (dependent or independent), and income (low-income, middle-income, or high-income).

Paying for College
This analysis incorporates three financial resources that help students to cover the cost of college: an expected parent contribution, students’ earnings from work, and financial aid. Parent contribution refers to the amount a student’s parents are estimated to be able to contribute toward college expenses. Expected parent contributions vary by income level — the estimates displayed in the table below are average contributions weighted by family income level. The student earnings figures assume that all students work 15 hours per week at the California minimum wage ($11 per hour) during the academic year and 40 hours per week at the minimum wage during the summer, though some students may choose to make their contribution through borrowing or other means.[3]
The following table shows the average annual amount students and parents are estimated to contribute towards students’ total cost of attendance.

In addition to student and parent contributions, many students pay for college with assistance from federal financial aid. This analysis assumes that all eligible students receive some federal gift aid from the Pell Grant and the Federal Supplemental Educational Opportunity Grant (FSEOG). The following table shows average per-student federal award amounts.

California and its public institutions provide a generous amount of financial aid to students from families with low incomes, administering over $4 billion in need-based aid annually. However, most of this aid is targeted towards tuition and fees. Because the goal of this analysis is to estimate the cost of a new state financial aid program that covers any remaining unmet financial need for students’ total cost of attendance, state and institutional aid estimates are not provided on a per-student level.
Affordable College: Two Models
This analysis provides detailed cost estimates for a new state program that allows full-time resident undergraduate Californians to receive an affordable college education at one of the state’s public higher education institutions. This section presents two models for achieving this goal. Each model displays the estimated costs and unmet financial need per sector, based on 2018-19 full-time resident enrollment (430,000 at CCC; 370,000 at CSU; and 180,000 at UC).
Option #1: Shared Responsibility Model
Option #1 estimates the total unmet financial need for qualified students after accounting for an expected parent contribution, an expected student contribution, and existing federal, state, and institutional aid.

Option #2: Government Responsibility Model
Option #2 estimates the total unmet financial need for qualified students after accounting for existing federal, state, and institutional aid, with no parent or student contribution.

Total Costs
The following table displays the total unmet financial need for all three sectors combined, after accounting for existing state and institutional aid, federal aid, and — where applicable — parent and student contributions. The total estimated unmet financial need for the shared responsibility model is $1.8 billion ($411 million at CCC, $939 million at CSU, and $475 million at UC). The total estimated unmet financial need for the government responsibility model is $15 billion ($4.5 billion at CCC, $7 billion at CSU, and $3.5 billion at UC). Both sets of estimates are on top of existing need-based state and institutional aid.

The program costs associated with these two models rely on several assumptions and the best available data regarding costs and enrollment. Actual program costs could vary considerably — increasing or decreasing the estimates presented here. Costs could be higher if enrollment increased significantly due to the availability of additional state-funded financial aid; living costs increased significantly (or were adjusted to reflect regional cost variations); more students lived off-campus; tuition increased; or federal and institutional aid decreased. Alternatively, costs could be lower if more students applied for and received federal financial aid due to increased outreach efforts; the minimum wage increased; more campuses participated in the FSEOG program; parents’ contributions exceeded expectations; federal or institutional aid increased significantly; or the program were limited to students from low-income families.
Conclusion
Ensuring that higher education is accessible and affordable for all Californians who wish to pursue a college degree is a widely shared goal among policymakers. Even with state and institutional aid, students experience significant unmet financial needs that create a barrier to success. Understanding how the current system falls short in helping students to afford a college education is essential to addressing California’s college affordability challenges. This analysis provides two estimates of what an affordable-college program might cost California if the state were to cover unmet financial need for qualified students. While the path forward requires significant investments, California’s students and economy cannot afford to wait.
[1] Estimate based on California’s 2018 minimum wage for employers with 26 employees or more. For more information, see the Technical Appendix.
[2] Michael Mitchell, et al., Unkept Promises: State Cuts to Higher Education Threaten Access and Equity (Center on Budget Priorities: October 2018); and Lauren Dundes and Jeff Marx, Balancing Work and Academics in College: Why Do Students Working 10-19 Hours per Week Excel? (Journal of College Student Retention: May 2006).
[3] Hans Johnson, Marisol Cuellar Mejia, and Sarah Bohn, Will California Run Out of College Graduates? (Public Policy Institute of California: October 2015).
You may also be interested in the following resources:
-
Report
Trends in Transitional Kindergarten Enrollment in California
key takeaway TK enrollment in California has doubled since 2021-22, with growth across all student groups and high-poverty schools. To ensure all children benefit, the state must address disparities in access for students of color and those from low-income families. Early childhood education is foundational for young children’s development and their long-term outcomes, and preschool … ContinuedEducation -
Report
How California Is Expanding Transitional Kindergarten
key takeaway California is expanding Transitional Kindergarten to all four-year-old children by 2025-26, supported by state investments to improve access, staffing, and equity in public preschool programs. Early learning is foundational for young children’s development, and preschool programs provide essential opportunities for 3- and 4-year-olds. Recognizing this, in 2021, California policymakers embarked on a significant … ContinuedEducation
Stay in the know.
Join our email list!
Policy Analyst Amy Rose presented on college students’ unmet need for food and housing affordability at the Community College League of California’s “Affordability, Food and Housing Access Taskforce: Capitol Briefing.”
You may also be interested in the following resources:
-
Report
Trends in Transitional Kindergarten Enrollment in California
key takeaway TK enrollment in California has doubled since 2021-22, with growth across all student groups and high-poverty schools. To ensure all children benefit, the state must address disparities in access for students of color and those from low-income families. Early childhood education is foundational for young children’s development and their long-term outcomes, and preschool … ContinuedEducation -
Report
How California Is Expanding Transitional Kindergarten
key takeaway California is expanding Transitional Kindergarten to all four-year-old children by 2025-26, supported by state investments to improve access, staffing, and equity in public preschool programs. Early learning is foundational for young children’s development, and preschool programs provide essential opportunities for 3- and 4-year-olds. Recognizing this, in 2021, California policymakers embarked on a significant … ContinuedEducation
Stay in the know.
Join our email list!
- Introduction
- Wealth Is Critical to Economic Security and Mobility, but Access Varies by Race and Ethnicity
- The Path to the Racial Wealth Gap
- Key Factors Contributing to the Growing Wealth Divide
- Key State Policies to Address the Racial Wealth Gap
- The Future of Wealth
- Appendix
View the PDF version of this report.
Introduction
In the years since the 2007 Great Recession, economic commentary has veered between hailing the subsequent recovery and sounding the alarm about rising inequality. Income inequality is often identified as a sign of both the country’s underlying economic troubles and public policies that disproportionately benefit the wealthy. An alternative indicator of the nation’s social and economic health pertains to wealth, specifically the growing wealth gap among people of different races and ethnicities.[1] This report illuminates the racial wealth gap, explores its underlying historical context, discusses some key factors driving the wealth gap, and lays out a set of public policies that could put California and the nation as a whole on a better path to building wealth for millions of families.
Wealth Is Critical to Economic Security and Mobility, but Access Varies by Race and Ethnicity
Building wealth is a crucial factor in promoting generational economic mobility and opportunity. Commonly measured in terms of net worth — the difference between gross assets and debt — wealth provides families with financial security. The greater a family’s net worth, the more resources they have to weather costly unexpected events, pay for higher education, take risks on a business, purchase a home, and invest in other wealth-generating assets. Moreover, wealth can be transferred to the next generation through financial gifts or inheritances.
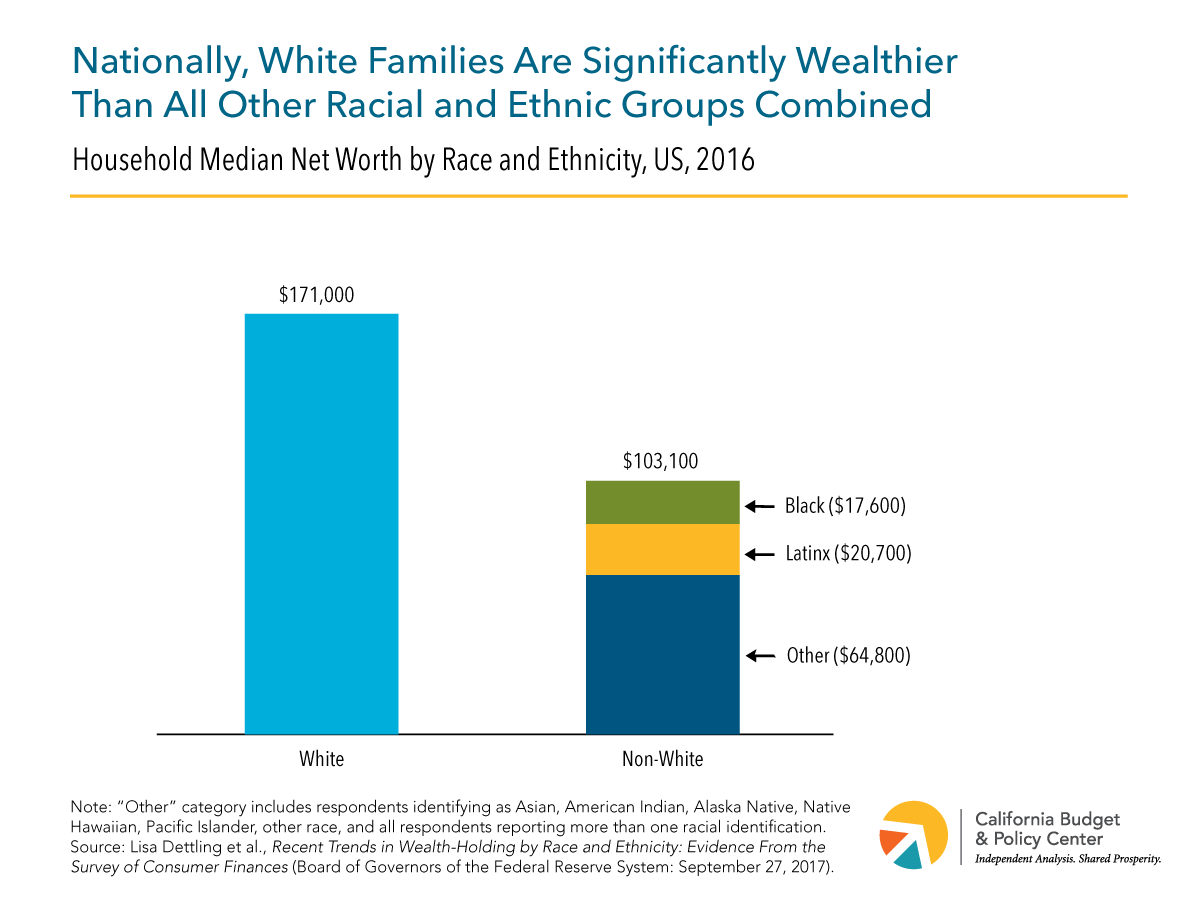
Income inequality has been extensively documented at both the state and national levels. Unfortunately, wealth inequality is even starker than income inequality. The top 1% of Americans took home 24% of all income, but they also had 39% of all wealth in 2016.[2] However, wealth is not only inequitably distributed across the income spectrum. It is also unfairly allocated among people of different races and ethnicities. For example, in 2016, the typical — or median — white family’s wealth nationally was $171,000 (Figure 1).[3] For black families, median wealth amounted to $17,600, or roughly 10% of that for white families. For Latinx families, median wealth was $20,700, or about 12% of that for white families. Put another way, the typical white household has $9.72 in wealth for every $1 that a typical black family has and $8.26 in wealth for every $1 that a typical Latinx family has.
National data show that this wealth disparity is not simply explained by racial and ethnic differences in income. Though one might expect that those with greater income would also have greater wealth, the data indicate that this is not the case. In 2014, black households in the middle of the income distribution had $22,150 in median net wealth, far less than did whites in the second lowest 20% of the distribution ($61,070) and only somewhat greater than that of whites in the bottom quintile ($18,361).[4]
Data specific to the Los Angeles area highlights wealth inequality at the local level in California (Figure 2).[5] In 2014 in Los Angeles and Orange counties, US-born whites had a much higher median household net worth ($355,000) than did most non-whites, including Latinx households ($46,000) and US-born blacks ($4,000). At the same time, among non-white groups, Japanese ($592,000), Asian Indian ($460,000), and Chinese ($408,200) households had greater median net worth than whites. The variation among Asian groups may reflect differing socioeconomic histories and migration patterns, and it echoes findings of substantial wealth inequality among Asian American communities in the United States.[6] These racial and ethnic differences reveal how some groups are better positioned to make the kinds of critical investments in their futures that benefit their families and the broader community.

Weathering adverse events is more challenging for households that lack sufficient wealth. When families face financial setbacks such as job loss or unexpected expenses, liquid assets — which can be converted easily to cash, such as money in the bank — offer a needed financial cushion. Unfortunately, many black and Latinx families across the country do not have enough liquid wealth to absorb sudden shocks. Nationally, blacks in 2011 had only $25 in median liquid wealth, and Latinx residents had just $100.[7] In contrast, the typical white family had $3,000 in assets that they could quickly convert to cash if needed. In the Los Angeles area, the median value of liquid assets for white households in 2014 was $110,000, compared to $200 for US-born blacks, $0 and $7 for Mexican and non-Mexican Latinx households, respectively, $500 for Vietnamese, and $245,000 for Asian Indians.[8] Moreover, while the majority of American families own some wealth, too many have zero or negative net worth (indicating more debt than assets). This problem also varies by race and ethnicity, with far fewer white households nationally (9%) having no wealth in 2016 than did black (19%) or Latinx households (13%).[9]
Families with greater wealth are better positioned to be able to transfer resources to family or friends. In addition to having more wealth, whites generally are better able to rely on their social networks during hard times. In 2016, more than 7 in 10 white families expected that they could get $3,000 from friends or family during a financial emergency, with less than half of black and Latinx households reporting the same.[10]
These disparities are not a natural occurrence nor are they due to the individual failings of people of color. Rather, as the next section points out, there are structural problems deeply rooted in our nation’s long history of racism, which has infused every aspect of our economy and which our nation has failed to fully remedy.
The Path to the Racial Wealth Gap
Why Is There a Racial Wealth Divide?
The roots of the racial wealth divide can be found in racist policies and practices dating back to our nation’s early days. Under the institution of chattel slavery, enslaved Africans were valuable assets whose labor generated wealth for their white owners. After emancipation, blacks worked as landless tenant farmers and sharecroppers. They were also largely shut out of the Homestead Acts, through which the federal government gave approximately 246 million acres to homesteaders — land that was the original source of family wealth for about one-quarter of the US adult population by 2004.[11] Public land acquisition and private land ownership were often explicitly restricted by race. White expansion westward depended on the displacement of Native Americans from their territories and in many states — including California — land ownership was limited to citizens, precisely to discriminate against non-whites ineligible for citizenship.[12]
In the period following the Great Depression and World War II, US policy substantially restricted communities of color from benefiting from the wealth-building policies that helped grow the American middle class. Housing was a key area in which both public policy and private actions clearly advantaged whites. From 1934 to 1968, the Federal Housing Administration (FHA) financed mortgages to expand homeownership, but also deliberately created segregated white neighborhoods to keep out “incompatible racial element[s].”[13] Federal policies also harmed black neighborhoods by excluding many residents of these areas from eligibility for government-backed loans and mortgages and discouraging lending to people of color by designating their neighborhoods as bad credit risks. Nationally, due to the FHA’s underwriting practices, just 2% of government-backed mortgages during this period (1934 to 1968) went to homebuyers of color.[14] These practices helped whites build assets, reduced home values in non-white neighborhoods, and pushed would-be homebuyers of color into predatory land contracts that systematically stripped wealth from their communities.[15] While the Fair Housing Act of 1968 banned racial discrimination in housing rentals and sales, it initially carried no real federal enforcement mechanism for discrimination claims, light penalties for violators, and high burdens for victims of discrimination.[16] Additionally, due to political resistance to desegregation, the Department of Housing and Urban Development often avoided exercising or outright obstructed its legal mandate to affirmatively promote integration, thus entrenching these inequalities.[17] Today, housing discrimination remains a barrier for people of color, who are recommended and shown fewer housing units than are equally qualified whites.[18]
The Racial Wealth Gap Has Widened in Recent Decades
Due to a long history of discrimination, the racial wealth gap has been an ever-present feature of American economic life. Yet over the past several decades, this disparity has worsened. Although black and Latinx households saw their net worth rise incrementally, albeit fitfully, from 1983 to 2007, the net worth of white households was still steadily outpacing these gains.[19] Unfortunately, the Great Recession and the housing crisis reversed the gains made by black and Latinx families, rolling back a generation’s worth of progress.
The recession hit Americans hard; from 2007 to 2010, median net worth for all racial and ethnic groups dropped by about 30%.[20] However, for people of color, the pain did not end there. While white families’ net worth stabilized in the immediate aftermath of the downturn (2010 to 2013), black and Latinx families continued to see their wealth decline by an additional 20%.[21] Latinx and Asian American households were disproportionately hurt by the foreclosure crisis, as they were far more likely to live in one of the five states that were hardest hit, including California.[22] Though median net worth has since risen for all groups, the racial wealth divide has continued to increase. From 2013 to 2016, median net worth for Latinx and black families rose 30% to 50%, respectively, compared to an increase of 17% for white families.[23] Despite these gains, the white-black wealth gap still increased by 16% and the white-Latinx gap rose by 14% during the same period.
Exacerbating the racial wealth divide is the nation’s current wealth-building incentive structure. The federal government subsidizes savings and investment through certain tax benefits — including tax credits, deductions, exclusions, and preferential rates — which do not show up on the federal government’s balance sheet but still count as public spending.[24] These subsidies perpetuate inequality by favoring those who are already wealthy, with the top 20% of earners receiving most of the benefits.[25] With the exception of tax credits, these tax breaks are more likely to benefit white households, which disproportionately belong to the top 20%.
Just as wealth is distributed unevenly, so are practices that strip wealth from communities. In the years leading up to the foreclosure crisis, predatory lenders made subprime mortgage loans — which have higher interest rates, fees, and penalties — irrespective of borrowers’ ability to repay. People of color, especially women, were particularly targeted by subprime lenders for bad mortgages even when they qualified for better loans, with black, Latinx, and Asian Pacific Islander women more likely to receive subprime mortgages than whites.[26] When the mortgage market crashed, these households lost substantial wealth. Payday lenders, which offer short-term, high-cost loans with excessive interest rates that borrowers must repay quickly, present another obstacle to wealth-building for communities of color.[27] Lenders tend to be concentrated in neighborhoods of color, and 60% of borrowers are women, particularly Latinx and black women.[28] These borrowers are often living paycheck to paycheck and use these loans to cover basic needs. They can become trapped by debt, taking out new loans with increasing fees to pay the previous loan. As a result of this “loan churn,” only 14% of borrowers can repay their loans within the short-term window and half of all loans are extended over 10 times.[29] In California, 83% of the total payday loan transactions in 2016 were for subsequent transactions by the same borrower and 79% of these subsequent loans were made within a week of the previous loan, the majority on the same day.[30]
Key Factors Contributing to the Growing Wealth Divide
Many factors are driving the growth of the racial wealth gap. This section examines three key causes: housing, unemployment and the labor market, and higher education.[31]
Unequal Access to Homeownership and Affordable Housing
Throughout the US as well as in California, housing has become unaffordable for many families, whether they own or rent their homes. In 2015, more than 4 in 10 California households had unaffordable housing costs, meaning these costs exceeded 30% of household income.[32] More than 1 in 5 households statewide faced severe housing cost burdens, spending more than half of their income on housing. This affordability crisis predominantly affects Californians of color. Among all of the state’s renters paying more than 30% of their income toward rent, more than two-thirds (68%) were people of color and nearly half (46%) were Latinx.[33]
For those who own their homes, a house is often a family’s greatest investment, and it represents the largest single segment of their wealth portfolio. Among all homeowners, housing comprised about 30% to 40% of their assets in 2016.[34] Historically less able to access homeownership, black and Latinx Americans have lower homeownership rates than whites. Nationally, more than 7 in 10 white households (73%) own their homes, compared to less than half of Latinx and black households.[35] In California, where homeownership rates are lower than the national average, more than 6 in 10 whites (63%) own their homes, while only one-third of blacks and about 4 in 10 Latinx Californians (42%) are homeowners (Figure 3).[36] In Los Angeles and Orange counties specifically, over two-thirds of whites were homeowners in 2014, which was significantly greater than the homeownership rate for most other racial and ethnic groups.[37]

Racial disparities in housing wealth account for a substantial share of the wealth divide. According to one study, the number of years a household owned their home explained 27% of the growth in the racial wealth gap between blacks and whites from 1984 to 2009.[38] Whites are more likely to receive family assistance in making a down payment on a home and generate housing wealth years earlier than black and Latinx families. Even among homeowners, a substantial racial wealth gap exists: black and Latinx homeowners still see lower returns to homeownership. In 2016, net housing wealth among homeowners was $215,800 for white families, compared to only $94,400 for blacks and $129,800 for Latinx families.[39] Greater access to assistance from family means that white buyers are more likely to be able to make a down payment earlier in their lives as well as to make more sizable down payments, which leads to lower interest rates and lending costs.[40] Additionally, because of the legacy of residential segregation, blacks tend to own homes in majority black neighborhoods, and these homes do not appreciate at the same rate as those in largely white neighborhoods.[41]
Given these deep disparities, some researchers argue that in order to help people of color build housing wealth on par with whites, increasing both homeownership rates and returns is key.[42] If black and Latinx families owned their homes at the same rates as whites, the wealth gap would decrease by 31% and 28%, respectively.[43] Separately, equalizing returns to homeownership would reduce the black-white wealth gap by 16% and the Latinx-white gap by 41%.
Higher Unemployment and Unequal Access to Well-Paying Jobs With Benefits
Earned income and employer-provided benefits are an important source of economic security for many American households. Taken together, unemployment and household income explain almost 30% of the growth in the white-black wealth gap.[44]
Across all levels of education, the unemployment rate for blacks is higher than for whites.[45] Equal rates of employment would not be enough to eliminate the racial wealth divide, as white families with an unemployed head of household possess five times the wealth of black families headed by a person who works full-time.[46] Clearly, people of color remain at a disadvantage in the labor market even when they are employed. Furthermore, black and Latinx workers are less likely to hold higher-paying jobs that offer key benefits like retirement plans, health coverage, or paid leave, all of which are important for wealth-building.[47] This insecurity may affect women of color to an even greater extent. They face a “larger wage gap, greater job segregation, higher rates of unemployment, and primary caregiving responsibility” than do white women.[48] Latinx and black women are less likely than white women to have employers who offer retirement plans, and women in general are more likely than men to work part-time or low-wage jobs that restrict access to wealth-building benefits.[49]
The Heavier Burden of Higher Education Costs
Having at least a college degree is increasingly tied to greater economic security. Workers with a college degree have higher lifetime earnings than those with only a high school diploma and are more likely to be stably employed in a job with benefits.[50] Californians with a bachelor’s degree can expect more than double the average annual earnings of those with only a high school diploma.[51] Increasing access to higher education is also beneficial for the state. Some research suggests that the lifetime return to the state per graduate with a bachelor’s degree is over $200,000.[52] However, state investments in public higher education lag far below pre-recession levels.[53] Over the years, spending cuts have shifted the cost of higher education from the state to students and their families through increased tuition and fees.
Yet not all families can support their children’s education equally. In 2013, whites were more than twice as likely as blacks to receive financial help from their parents for higher education.[54] This disparity in financial support is not due to a difference in parents’ supportiveness of their children’s postsecondary education. Indeed, research indicates that black parents are more likely to spend a larger share of their resources on their children’s education.[55] Those black parents who support their children financially have less wealth and income than white parents who provide no financial support. However, in general, black families simply have less wealth to leverage toward the cost of an education.
Families may consider financial aid, but that assistance is not always available or sufficient. In California, low- and middle-income students turn to Cal Grants, which are the foundation of California’s financial aid program.[56] Only 16% and 25% of very low-income black and Latinx students in California, respectively, receive a Cal Grant award.[57] The vast majority of black and Latinx students who do receive state financial aid get the Cal Grant B access award, which is intended to help low-income students pay for basic expenses yet has not kept pace with the state’s rising housing costs.[58] The federal Pell Grant has also eroded in value, failing to keep up with rising costs of college attendance.[59]
Disproportionately burdened by rising tuition and fees, facing insufficient financial aid, and less able to rely on family resources, low-income students as well as students of color are more likely to face economic barriers to completing their degrees. These students often have to employ a range of coping strategies that impede their academic progress, including enrolling part-time, dropping courses, skipping semesters, or taking a job to cover expenses.[60] They also are more likely to take on debt to finance their education. Among all households, black families are more burdened by student debt than are white families. Over half (54%) of all black households headed by those ages 25 to 40 have student debt, compared to 39% of their white counterparts.[61] For Latinx households, just over 1 in 5 (21%) have student debt, likely due to lower rates of college attendance and attainment. Black borrowers also tend to owe more than white borrowers and both black and Latinx borrowers are more likely to take out riskier private loans.[62] This debt burden can be an obstacle to attaining a degree, as black and Latinx student borrowers are more likely to drop out.[63] As a result, they lack access to the relative labor market stability and asset-building opportunities that come with a college degree.
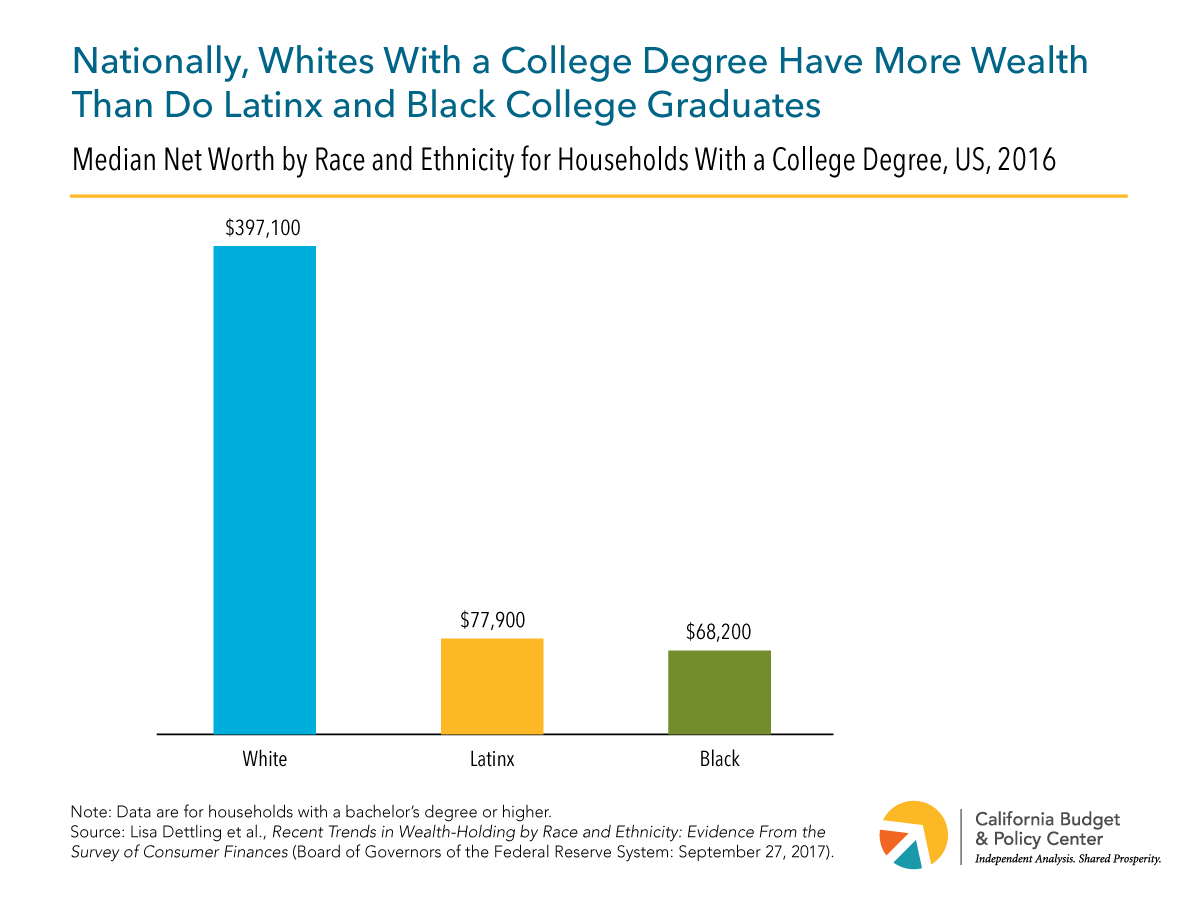
Yet while higher education is associated with greater earning potential, boosting the number of black and Latinx students who attain a degree in and of itself will not eliminate the wealth divide. In part due to debt payments, higher risk of default, and disparate experiences in the labor market, black and Latinx graduates do not see returns to their education that are equal to those of their white peers. At every level of educational attainment, black and Latinx families have less median wealth than their white peers. Not only do white college graduates hold more than five times the wealth of black and Latinx graduates, but even whites without a degree are wealthier (Figures 4 and 5).[64] Nor does the disparity disappear for those who received parental financial support for a degree, which is associated with degree completion but does little to reduce racial gaps in income or net worth.[65] In short, attaining a degree does not necessarily protect graduates of color from debt burdens or the discriminatory policies and practices that contribute to the racial wealth gap over the course of a lifetime.

Key State Policies to Address the Racial Wealth Gap
The research on wealth overwhelmingly concludes that individual achievement is not sufficient to overcome growing racial and ethnic wealth inequalities. Given the important role of public policy in fostering both an American middle class and the racial wealth divide, closing the wealth gap will require a new approach to public policy at both the state and national levels. This section suggests some state-level policy changes that could increase wealth for communities of color and decrease the disparity between whites and other groups.
The Need for Action: Four Key Policies to Build Wealth
1. Create a state-level estate tax
An estate tax is levied on large accumulations of wealth that are transferred from the estate of people who have died to their beneficiaries.[66] Ideally, the US would have a robust estate tax that would reduce wealth accumulation, with the proceeds invested in wealth-building strategies designed to level the playing field for all Americans. However, the federal estate tax has been weakened dramatically since the late 1990s to the point that nearly all estates are exempt from this tax.[67] Most recently, the Tax Cuts and Jobs Act of 2017 raised the exemption from the federal estate tax to more than $10 million per person.[68] This change will further concentrate wealth among families that are already highly advantaged. California should create its own estate tax, joining 18 other states and the District of Columbia that tax inherited wealth.[69] With such a tax, California could both reduce wealth disparities and use the resulting revenues — potentially in the billions per year — to fund wealth-building policies or other public investments that would benefit the vast majority of Californians.[70]
2. Support homeownership for low-income Californians
To ease the burdensome housing costs and help Californians build wealth, state policymakers can further help low-income Californians become homeowners, which could benefit Californians of color. One option is to invest in shared equity programs, which offer subsidies to lower the initial costs of a home for new buyers.[71] When homeowners sell their home, a portion of the proceeds is reinvested in the program, allowing future low-income buyers to afford a home and keeping the program sustainable. California could significantly invest in affordable homeownership by providing funding for shared equity housing for those otherwise priced out of the housing market and tie funds to long-term affordability requirements. Local governments and nonprofits could be responsible for monitoring units and resales, and offering support to homeowners.
To help fund this investment, California should consider eliminating the state mortgage interest tax deduction. The deduction allows households to reduce their taxable incomes by the value of qualified mortgage interest expenses paid on up to $1 million in debt and primarily benefits wealthy homeowners.[72] This tax break exacerbates racial and ethnic disparities, with white families not only more likely to own homes, but also to have more valuable homes.[73] Eliminating the deduction would both make California’s tax code more equitable and yield substantial revenue for shared equity programs.[74]
3. Create debt-free public higher education for low- and middle-income households
California policymakers should take steps to substantially deepen the state’s investment in higher education, with a particular focus on subsidizing the full cost of attendance for low- and middle-income households. Targeting students with lower incomes would reduce the racial wealth divide by eliminating borrowing for many students of color, thus removing one barrier to completion and increasing the return on a college degree by allowing students to avoid wealth-stripping student debt.[75] To this end, policymakers should increase the supply of competitive Cal Grants and raise the value of the Cal Grant B access award for living expenses.
4. Boost investments in children through Children’s Savings Accounts (CSAs).
CSAs are savings accounts for children that have the potential to reduce generational inequities in wealth-building. Seeded with an initial deposit from the state that would accrue interest throughout childhood, a CSA could be automatically opened for each child at birth (with greater endowments for children from less wealthy families) or applied only to children from low-wealth households. Contributions from family and friends could receive a public match, the size of which could increase for families with less wealth. Once the child reaches adulthood, the savings could be used for higher education, homeownership, or other investments throughout their lifetime. Such a program could substantially reduce the racial wealth gap and increase asset security.[76]
The Future of Wealth
The rise of a strong American middle class did not happen accidentally. It required a healthy economy supported by large and intentional public investments. These actions were largely structured to benefit whites to the exclusion of communities of color, and that decision bears serious moral and economic consequences for our future well-being. Nationally, whites are projected to become a racial minority by 2045.[77] In California, people of color already constitute the majority of the state’s population, and their share is projected to rise to more than two-thirds (68%) by 2045.[78] As a result, the economic welfare of people of color will increasingly determine the welfare of our state and of the larger society. Californians and all Americans need to decide which future we want. One option is to continue down our current path, disproportionately concentrating wealth and opportunity with a handful of whites, while locking out people of color. A better option is to improve public policies at the state and federal levels in order to ensure equitable investments in all of our people and create a strong and inclusive economy.
Appendix
Measuring Wealth
Researchers primarily use three surveys to explore the distribution of wealth in the US: the US Census Bureau’s Survey of Income and Program Participation (SIPP), the Federal Reserve Board’s Survey of Consumer Finances (SCF), and the Panel Study of Income Dynamics (PSID) conducted by University of Michigan faculty. While all three of these surveys allow for comparisons by race and ethnicity, these categories tend to be limited. For example, due to sample size constraints, Asians, Native Americans, Pacific Islanders, and those who report more than one race are grouped into a single “Other” category, as in the SCF.[79] Wealth-related data by race and ethnicity is available for certain localities — including the Los Angeles area — from The National Asset Scorecard and Communities of Color survey (NASCC).[80] Due to these data limitations, The Racial Wealth Gap: What We Can Do About a Long-Standing Obstacle to Shared Prosperity focuses on the national differences in wealth between white, black, and Latinx households and reports local data when available.
Endnotes
[1] In this report, the term “racial wealth gap” is used to refer to an economic problem that affects various races and ethnicities.
[2] Jesse Bricker, et al., Changes in US Family Finances From 2013 to 2016: Evidence From the Survey of Consumer Finances (Board of Governors of the Federal Reserve System: September 2017), p. 10.
[3] Though these gaps decrease when accounting for other demographic and economic factors associated with wealth, sizable disparities remain. See Lisa Dettling, et al., Recent Trends in Wealth-Holding by Race and Ethnicity: Evidence From the Survey of Consumer Finances (Board of Governors of the Federal Reserve System: September 27, 2017).
[4] William Darity Jr., et al., What We Get Wrong About Closing the Racial Wealth Gap (Samuel DuBois Cook Center on Social Equity and Insight Center for Community Economic Development: April 2018), p. 9.
[5] Data are from the 2014 National Asset Scorecard and Communities of Color survey and are for Los Angeles and Orange counties. The authors do not account for nativity status, with the exception of distinguishing between US-born blacks and African blacks. Median net worth for African blacks was $72,000. See Melany De La Cruz-Viesca, et al., The Color of Wealth in Los Angeles (Duke University, The New School, the University of California, Los Angeles, and the Insight Center for Community Economic Development: March 2016), p. 40.
[6] Christian E. Weller and Jeffrey Thompson, Wealth Inequality Among Asian Americans Greater Than Among Whites (Center for American Progress: December 20, 2016).
[7] This analysis excludes retirement savings. Including retirement savings, black and Latinx Americans had $200 and $340 in median liquid wealth, respectively, while whites had $23,000. See Rebecca Tippett, et al., Beyond Broke: Why Closing the Racial Wealth Gap Is a Priority for National Economic Security (Center for Global Policy Solutions and Duke Research Network on Racial and Ethnic Inequality at the Social Science Research Institute: May 2014), p. 2.
[8] Data are from the 2014 National Asset Scorecard and Communities of Color survey and are for Los Angeles and Orange counties. The authors do not account for nativity status, with the exception of distinguishing between US-born blacks and African blacks. See Melany De La Cruz-Viesca, et al., The Color of Wealth in Los Angeles (Duke University, The New School, the University of California, Los Angeles, and the Insight Center for Community Economic Development: March 2016), p. 38.
[9] Lisa Dettling, et al., Recent Trends in Wealth-Holding by Race and Ethnicity: Evidence From the Survey of Consumer Finances (Board of Governors of the Federal Reserve System: September 27, 2017).
[10] Lisa Dettling, et al., Recent Trends in Wealth-Holding by Race and Ethnicity: Evidence From the Survey of Consumer Finances (Board of Governors of the Federal Reserve System: September 27, 2017).
[11] Thomas M. Shapiro, The Hidden Cost of Being African American: How Wealth Perpetuates Inequality (New York: Oxford University Press, 2004), p. 190.
[12] Office of the Historian, United States Department of State, Indian Treaties and the Removal Act of 1830; Gregory P. Downs and Kate Masur, The Era of Reconstruction: 1861-1900 (National Park Service, US Department of the Interior: 2017), p. 70; and Masao Suzuki, “Important or Impotent? Taking Another Look at the 1920 California Alien Land Law,” The Journal of Economic History 64 (2004), pp. 125-130.
[13] Richard Rothstein, The Racial Achievement Gap, Segregated Schools, and Segregated Neighborhoods: A Constitutional Insult (Economic Policy Institute: November 12, 2014).
[14] Dedrick Asante-Muhammad, et al., The Road to Zero Wealth: How the Racial Wealth Divide Is Hollowing Out America’s Middle Class (Institute for Policy Studies and Prosperity Now: September 2017), p. 15.
[15] Jeremiah Battle, Jr., et al., Toxic Transactions: How Land Installment Contracts Once Again Threaten Communities of Color (National Consumer Law Center: July 2016), pp. 3-4.
[16] Under the 1968 Fair Housing Act, the Department of Housing and Urban Development (HUD) had to investigate complaints of discrimination within 30 days. If HUD pursued the claim, it could only seek voluntary settlements with noncompliant parties or advise complainants to file private lawsuits, for which penalties were capped at $1,000. In 1988, Congress updated the Act to provide administrative enforcement of the law, extend HUD’s investigation time to 100 days, and increase the maximum civil penalties, which currently range from $20,111 for a first offense to $100,554 for those with a history of offenses. See Douglas S. Massey, “The Legacy of the 1968 Fair Housing Act” Sociological Forum 30 (2015), pp. 571-588; Administrative Conference of the United States, Enforcement Procedures Under the Fair Housing Act (June 18, 1992); and 82 Federal Register 24523 (2017).
[17] Douglas S. Massey, “The Legacy of the 1968 Fair Housing Act” Sociological Forum 30 (2015), pp. 571-588; Nikole Hannah-Jones, “Living Apart: How the Government Betrayed a Landmark Civil Rights Law,” ProPublica (June 25, 2015).
[18] US Department of Housing and Urban Development, Housing Discrimination Against Racial and Ethnic Minorities 2012: Executive Summary, (June 2013), p. 1.
[19] This analysis excludes durable goods. Dedrick Asante-Muhammad, et al., The Road to Zero Wealth: How the Racial Wealth Divide Is Hollowing Out America’s Middle Class (Institute for Policy Studies and Prosperity Now: September 2017), p. 8.
[20] Lisa Dettling, et al., Recent Trends in Wealth-Holding by Race and Ethnicity: Evidence From the Survey of Consumer Finances (Board of Governors of the Federal Reserve System: September 27, 2017).
[21] Lisa Dettling, et al., Recent Trends in Wealth-Holding by Race and Ethnicity: Evidence From the Survey of Consumer Finances (Board of Governors of the Federal Reserve System: September 27, 2017).
[22] Rebecca Tippett, et al., Beyond Broke: Why Closing the Racial Wealth Gap Is a Priority for National Economic Security (Center for Global Policy Solutions and Duke Research Network on Racial and Ethnic Inequality at the Social Science Research Institute: May 2014), p. 4.
[23] Lisa Dettling, et al., Recent Trends in Wealth-Holding by Race and Ethnicity: Evidence From the Survey of Consumer Finances (Board of Governors of the Federal Reserve System: September 27, 2017).
[24] Refundable tax credits are the exception, as they are recorded in the federal budget. See Lewis Brown Jr. and Heather McCulloch, Building an Equitable Tax Code: A Primer for Advocates (PolicyLink: 2014), p. 3.
[25] Lewis Brown Jr. and Heather McCulloch, Building an Equitable Tax Code: A Primer for Advocates (PolicyLink: 2014), p. 7.
[26] Heather McCulloch, Closing the Women’s Wealth Gap: What It Is, Why It Matters, and What Can Be Done About It (Closing the Women’s Wealth Gap Initiative: updated January 2017), p. 9; Suparna Bhaskaran, Pinklining: How Wall Street’s Predatory Products Pillage Women’s Wealth, Opportunities, and Futures (June 2016), p. 16.
[27] Scott Graves and Alissa Anderson, Payday Loans: Taking the Pay Out of Payday (California Budget & Policy Center: September 2008), p. 7.
[28] Suparna Bhaskaran, Pinklining: How Wall Street’s Predatory Products Pillage Women’s Wealth, Opportunities, and Futures (June 2016), p. 18-19.
[29] Suparna Bhaskaran, Pinklining: How Wall Street’s Predatory Products Pillage Women’s Wealth, Opportunities, and Futures (June 2016), p. 17.
[30] California Department of Business Oversight, Summary Report: California Deferred Deposit Transaction Law—Annual Report and Industry Survey (May 31, 2017), p. 8.
[31] In a 2013 analysis, these areas explained 61% of the ongoing racial wealth divide between whites and blacks. See Thomas Shapiro, Tatjana Meschede, and Sam Osoro, The Roots of the Widening Racial Wealth Gap: Explaining the Black-White Economic Divide (Institute on Assets and Social Policy: February 2013), pp. 2-3.
[32] Sara Kimberlin, Californians in All Parts of the State Pay More Than They Can Afford for Housing (California Budget & Policy Center: September 2017).
[33] Sara Kimberlin, Californians in All Parts of the State Pay More Than They Can Afford for Housing (California Budget & Policy Center: September 2017).
[34] Lisa Dettling, et al., Recent Trends in Wealth-Holding by Race and Ethnicity: Evidence From the Survey of Consumer Finances (Board of Governors of the Federal Reserve System: September 27, 2017).
[35] Lisa Dettling, et al., Recent Trends in Wealth-Holding by Race and Ethnicity: Evidence From the Survey of Consumer Finances (Board of Governors of the Federal Reserve System: September 27, 2017).
[36] California Budget & Policy Center analysis of US Census Bureau, American Community Survey data. Data are for household heads age 18 and older in 2016.
[37] Melany De La Cruz-Viesca, et al., The Color of Wealth in Los Angeles (Duke University, The New School, the University of California, Los Angeles, and the Insight Center for Community Economic Development: March 2016), p. 33.
[38] Thomas Shapiro, Tatjana Meschede, and Sam Osoro, The Roots of the Widening Racial Wealth Gap: Explaining the Black-White Economic Divide (Institute on Assets and Social Policy: February 2013), p. 2.
[39] Lisa Dettling, et al., Recent Trends in Wealth-Holding by Race and Ethnicity: Evidence From the Survey of Consumer Finances (Board of Governors of the Federal Reserve System: September 27, 2017).
[40] Thomas Shapiro, Tatjana Meschede, and Sam Osoro, The Roots of the Widening Racial Wealth Gap: Explaining the Black-White Economic Divide (Institute on Assets and Social Policy: February 2013), p. 3.
[41] Thomas Shapiro, Tatjana Meschede, and Sam Osoro, The Roots of the Widening Racial Wealth Gap: Explaining the Black-White Economic Divide (Institute on Assets and Social Policy: February 2013), p. 3.
[42] Laura Sullivan, et al., The Racial Wealth Gap: Why Policy Matters (Institute for Assets and Social Policy and Demos: 2015), p. 1.
[43] If black families owned their homes at the same rate as whites, the median black household’s wealth would increase by over $32,000 (451%). For Latinx families, equalizing homeownership rates would increase the median household wealth by over $29,000 (350%). Laura Sullivan, et al., The Racial Wealth Gap: Why Policy Matters (Institute for Assets and Social Policy and Demos: 2015), pp. 11-13.
[44] Thomas Shapiro, Tatjana Meschede, and Sam Osoro, The Roots of the Widening Racial Wealth Gap: Explaining the Black-White Economic Divide (Institute on Assets and Social Policy: February 2013), pp. 2-3.
[45] William Darity Jr., et al., What We Get Wrong About Closing the Racial Wealth Gap (Samuel DuBois Cook Center on Social Equity and Insight Center for Community Economic Development: April 2018), p. 7.
[46] William Darity Jr., et al., What We Get Wrong About Closing the Racial Wealth Gap (Samuel DuBois Cook Center on Social Equity and Insight Center for Community Economic Development: April 2018), p. 8.
[47] Laura Sullivan, et al., The Racial Wealth Gap: Why Policy Matters (Institute for Assets and Social Policy and Demos: 2015), p. 25.
[48] Heather McCulloch, Closing the Women’s Wealth Gap: What It Is, Why It Matters, and What Can Be Done About It (Closing the Women’s Wealth Gap Initiative: updated January 2017), p. 7.
[49] The data refers specifically to defined contribution plans. See Heather McCulloch, Closing the Women’s Wealth Gap: What It Is, Why It Matters, and What Can Be Done About It (Closing the Women’s Wealth Gap Initiative: updated January 2017), p. 12.
[50] Tatjana Meschede, et al., “‘Family Achievements’? How a College Degree Accumulates Wealth for Whites and Not for Blacks,” Federal Reserve Bank of St. Louis Review 99 (2017), p. 123.
[51] Hans Johnson, Testimony: The Need for College Graduates in California’s Future Economy (The Public Policy Institute of California: November 1, 2017).
[52] Jon Stiles, Michael Hout, and Henry Brady, California’s Economic Payoff: Investing in College Access and Completion (The Campaign for College Opportunity: April 2012), p.13.
[53] Amy Rose, State Spending Per Student at CSU and UC Remains Well Below Pre-Recession Levels, Despite Recent Increases (California Budget & Policy Center: March 2018).
[54] Yunju Nam, et al., Bootstraps Are for Black Kids: Race, Wealth, and the Impact of Intergenerational Transfers on Adult Outcomes (Insight Center for Community Economic Development: September 2015), p. 8.
[55] Tatjana Meschede, et al., “’Family Achievements?’ How a College Degree Accumulates Wealth for Whites and Not for Blacks,” Federal Reserve Bank of St. Louis Review 99 (2017), p. 124.
[56] There are three types of Cal Grant awards: Cal Grant A is used for tuition and fees; Cal Grant B provides an allowance for living costs known as an “access award” (in addition to tuition and fee assistance after the first year); and Cal Grant C is for students who attend occupational or career colleges. See California Student Aid Commission, What Is a Cal Grant Award?
[57] Data are from 2008. See The Campaign for College Opportunity, The State of Higher Education in California: Latinos (April 2015), p. 18 and The Campaign for College Opportunity, The State of Higher Education in California: Blacks (May 2015), p. 29.
[58] The Campaign for College Opportunity, The State of Higher Education in California: Latinos (April 2015), p.19; The Campaign for College Opportunity, The State of Higher Education in California: Blacks (May 2015), p. 29; and Amy Rose, Barriers to Higher Education Attainment: Students’ Unmet Basic Needs (California Budget & Policy Center: May 2018).
[59] Spiros Protopsaltis and Sharon Parrott, Pell Grants — a Key Tool for Expanding College Access and Economic Opportunity — Need Strengthening, Not Cuts (Center on Budget and Policy Priorities: July 27, 2017).
[60] Amy Rose, Barriers to Higher Education Attainment: Students’ Unmet Basic Needs (California Budget & Policy Center: May 2018).
[61] Mark Huelsman, et al., Less Debt, More Equity: Lowering Student Debt While Closing the Black-White Wealth Gap (Demos and Institute on Assets and Social Policy: 2015), pp. 16-17.
[62] Latinx students tend to borrow smaller amounts than both blacks and whites at public institutions but may borrow greater amounts at private for-profit institutions. See Mark Huelsman, The Debt Divide: The Racial and Class Bias Behind the “New Normal” of Student Borrowing (Demos: May 19, 2015), pp. 7-8.
[63] Mark Huelsman, The Debt Divide: The Racial and Class Bias Behind the “New Normal” of Student Borrowing (Demos: May 19, 2015), pp. 14-16.
[64] For a white household whose head does not have a bachelor’s degree, median net worth is $98,100. For a black household whose head does have a college degree, median net worth is $68,200. For Latinx households, the equivalent figure is $77,900. See Lisa Dettling, et al., Recent Trends in Wealth-Holding by Race and Ethnicity: Evidence From the Survey of Consumer Finances (Board of Governors of the Federal Reserve System: September 27, 2017).
[65] Yunju Nam, et al., Bootstraps Are for Black Kids: Race, Wealth, and the Impact of Intergenerational Transfers on Adult Outcomes (The Insight Center for Community Economic Development: September 2015), p. 12.
[66] Jonathan Kaplan, Repeal of the Estate Tax Would Reduce Federal Resources While Key Public Services Are on the Chopping Block (California Budget & Policy Center: October 26, 2017).
[67] Even before the passage of the Tax Cuts and Jobs Act of 2017, which further scaled back the national estate tax, only 2 out of every 1,000 estates were subject to the tax. Jonathan Kaplan, Repeal of the Estate Tax Would Reduce Federal Resources While Key Public Services Are on the Chopping Block (California Budget & Policy Center: October 26, 2017).
[68] Steven Bliss and Chris Hoene, Final GOP Tax Plan Is a Big Gift to the Wealthy, but Would Harm Most Households and Our Economy (California Budget & Policy Center: December 18, 2017).
[69] In order to establish a state estate tax, the Legislature would have to ask voters to repeal or amend Proposition 6 of 1982, which prohibits the state from imposing an estate, inheritance, or wealth tax. See California Budget & Policy Center, Principles and Policy: A Guide to California’s Tax System (April 2013), p. 21. For more information about state estate taxes, see Elizabeth McNichol, State Estate Taxes: A Key Tool for Broad Prosperity (Center on Budget and Policy Priorities: May 11, 2016).
[70] For estimates on the amount of revenue an estate tax could raise, see Elizabeth McNichol, State Estate Taxes: A Key Tool for Broad Prosperity (Center on Budget and Policy Priorities: May 11, 2016) and Legislative Analyst’s Office, A.G. File No. 2017-038 (November 30, 2017).
[71] Brett Theodos, et al., Affordable Homeownership: An Evaluation of Shared Equity Programs (Urban Institute: March 2017), p. 1.
[72] William Chen, Spending Through California’s Tax Code (California Budget & Policy Center: August 2016).
[73] In 2016, the average net housing wealth in the US was $215,800 for white homeowners versus $94,400 for black homeowners and $129,800 for Latinx homeowners. See Lisa Dettling, et al., Recent Trends in Wealth-Holding by Race and Ethnicity: Evidence From the Survey of Consumer Finances (Board of Governors of the Federal Reserve System: September 27, 2017).
[74] The Department of Finance estimates that California will lose $4 billion in revenue due to the mortgage interest deduction in state fiscal year 2018-19. See California Department of Finance, Tax Expenditure Report: 2018-19, p. 5.
[75] Mark Huelsman, et al., Less Debt, More Equity: Lowering Student Debt While Closing the Black-White Wealth Gap (Demos and Institute on Assets and Social Policy: 2015), pp. 18-20.
[76] Laura Sullivan,, et al., Equitable Investments in the Next Generation: Designing Policies to Close the Racial Wealth Gap (Institute on Assets and Social Policy and CFED: 2016), pp. 9-11.
[77] William H. Frey, The US Will Become “Minority White” in 2045, Census Projects (The Brookings Institution: Updated September 10, 2018).
[78] California Budget & Policy Center analysis of Department of Finance data.
[79] This report uses the terms “Asian” and “Asian American” depending on the cited source. For more on the SCF’s racial and ethnic categories, see Lisa Dettling, et al., Recent Trends in Wealth-Holding by Race and Ethnicity: Evidence From the Survey of Consumer Finances (Board of Governors of the Federal Reserve System: September 27, 2017).
[80] Melany De La Cruz-Viesca, et al., The Color of Wealth in Los Angeles (Duke University, The New School, the University of California, Los Angeles, and the Insight Center for Community Economic Development: March 2016), pp. 19-20.
You may also be interested in the following resources:
-
Issue Brief
California’s Persistent Poverty Crisis: 2024 Rates Remain Alarmingly High
key takeaway California’s poverty rate remains among the highest in the nation (17.7%), with children, people of color, and renters most affected. Recent federal actions threaten to worsen these trends, highlighting the urgent need for bold state leadership. California’s poverty rate, at 17.7%, continued to be the highest (alongside Louisiana) in the United States in … ContinuedPoverty & Inequality -
Report
How Federal and State Budget Cuts Threaten Latinx Californians
key takeaway Federal budget cuts to essential services threaten to worsen long-standing inequities for Latinx Californians and immigrants, underscoring the urgent need for state leaders to protect communities through stronger investments and fairer tax policies. Access to affordable health care, child care, housing, and food is necessary for all Californians to thrive. However, congressional members … ContinuedCalFreshCalWORKsMedi-CalPoverty & Inequality
Stay in the know.
Join our email list!
The Center on Budget and Policy Priorities’ annual conference, Impact 2018: Building Momentum for Equity and Opportunity, brought together members of the State Priorities Partnership (SPP), a network of independent, nonprofit research and policy organizations representing more than 40 states, and others interested in state policy. Executive Director Chris Hoene presented to the SPP Leadership Institute on the results of a strategic planning retreat he attended earlier this year and also introduced the conference’s closing plenary speaker, Professor Manuel Pastor of USC. Also, Steven Bliss, Director of Strategic Communications, presented “Using Digital Tools to Expand Reach and Engagement” for the workshop “Digital Advocacy 101.”
Stay in the know.
Join our email list!
California has one of the most generous state financial aid programs in the country. In addition to receiving federal financial aid such as the Pell Grant, many California resident students also attend college tuition-free through various state and institutional grants at the California Community Colleges (CCCs), the California State University (CSU), and the University of California (UC). For California’s undocumented students, the road to higher education is a bit rockier. Extending financial resources to “Dreamers” (undocumented immigrants brought to the US as children) would boost their opportunities and produce long-term economic benefits to the state.
California has an estimated undocumented immigrant population of 2.6 million, more than 6% of the state’s population. Immigrants, including those without permanent legal status, play a vital role in our state’s economy and local communities, contributing billions in federal, state, and local tax contributions annually. Since higher education attainment is closely linked with higher earnings, ensuring that undocumented students have the support they need to succeed in college is vital to California’s economic well-being.
What Challenges Do Undocumented Students Face?
Undocumented students must navigate a complex set of challenges in pursuing higher education, complicated by their legal status. A study from the University of California at Los Angeles found that undocumented students reported significantly elevated levels of anxiety and constant concerns over deportation.
In addition to social stressors, one of the greatest barriers Dreamers face in pursuing higher education is accessing financial aid support. Undocumented students come from families with lower average incomes than other families, which means paying for college is out of reach for many without financial assistance. Undocumented students do not qualify for federal financial aid such as the Pell Grant, which provides low-income students with up to $6,095 to help pay for college. They are also unable to receive federal student loans or participate in work-study programs that provide part-time jobs for students with financial need. In addition to being barred from federal financial support, undocumented students are at the bottom of the eligibility pool for Competitive Cal Grants, the state’s primary grant that provides aid for tuition and living expenses for nontraditional students (e.g., those who do not attend college immediately after graduating from high school).
Without proper legal documentation, many Dreamers struggle to find meaningful work opportunities and build their professional skills. They also experience job insecurity, low wages, and labor-intensive work. The documentation status of other family members creates additional financial hardship and stress, even for students with citizenship. The constant social, financial, and legal challenges Dreamers face impede on their well-being and ability to succeed academically.
What Support Is Available for Undocumented Students?
In 2012, the Deferred Action for Childhood Arrivals (DACA) program provided Dreamers with temporary protection from deportation and legal permission to work. This federal program enabled thousands of students to work legally in the United States. As of 2017, more than a quarter of active DACA recipients live in California. While the Trump administration continues its attempts to dismantle DACA, many states, including California, have taken an inclusive approach by passing policies that strengthen and expand support for undocumented students.
Specifically, California has adopted the following policies:
- In-state tuition. Undocumented students and other students without legal residency have traditionally paid a significantly higher tuition rate at the state’s public colleges and universities. Since 2001, however, California has granted Dreamers access to in-state tuition, helping to offset the cost of college.
- State financial aid. The 2011 California Dream Act granted eligibility to undocumented students to apply, qualify for, and receive state financial aid such as Entitlement Cal Grants and the Middle Class Scholarship. However, some restrictions limit Dreamers from receiving certain types of aid, and the acceptance or “take-up” rate for those who are awarded aid is low and varies by sector. While many Dreamers apply for financial aid, few actually receive awards. In 2017-18, more than 50,000 Dreamers applied for aid, while less than 15% were offered an award.

- Competitive Cal Grants are the state’s primary grant that provides financial aid for tuition and living expenses for nontraditional students. Undocumented students are eligible for these grants; however, state law requires that Competitive grants may only be disbursed to them after all other eligible applicants (i.e., non-Dreamers) are paid. In 2017-18, only 14% of qualified applicants received a Competitive Cal Grant, meaning the remaining 315,106 students would have to receive a grant before Dreamers could be awarded one.
- Undocumented students receive the same priority as resident students for other state aid: Entitlement Grants and Middle Class Scholarship Grants. The “take-up” rate for Dreamers accepting these grants is much lower than resident students and varies significantly by sector. In 2017-18 only 69% of CCC Dreamers accepted an Entitlement Grant or Middle Class Scholarship award compared to 97% of Dreamers at the UC.
- Institutional aid. Undocumented students qualify to receive institutional grants and scholarships such as the State University Grant at the CSU and the UC Grant at the UC and are also eligible for need-based tuition waivers such as the California Promise Grant at the CCC.
- Work-Study programs. Work-study programs provide grants for part-time work for students with financial need, helping to defray their educational costs while gaining valuable work experience. Though barred from participating in federal work-study programs, some UC campuses offer institutional work-study for undocumented students. An effort to establish the California DREAM Work-Study Program at the UC and CSU failed to pass the Legislature in 2015, as did a 2017 effort to enhance the Cal Grant B program to provide additional aid for Dreamer students engaged in community or volunteer work.
- Dream Loan program. This program provides undocumented students at the UC and CSU with the option to borrow student loans to help cover the cost of attending college. Beginning in 2020, campuses participating in the Dream Loan program must offer income-based repayment plans for DREAM Loans.
- State budget allocations. In recent years, the state budget has provided support for undocumented students through various programs. The 2017-18 state budget provided $3 million total for DREAM Loans at UC and CSU and $7 million for emergency student aid for Dreamers at CCC. The 2018-19 state budget provided $21 million in funding for legal services for undocumented students and employees at the CCC, CSU, and UC, and adjusted the CCC funding formula to include provisions for undocumented students.
- Legal services and protection. Leaders at the CCC, CSU, UC and the California Student Aid Commission have pledged to protect undocumented students and ensure that resources are not used to aid the federal government in deporting students. Many UC and CSU campuses provide support through Dream Centers, liaisons, student organizations, and other on-campus resources. The University of California Immigrant Legal Services Center provides free legal services to undocumented and immigrant students in the UC system.
What Else Can Policymakers Do to Support Undocumented Students?
The absence of any meaningful federal support for Dreamers and the inability for Congress to pass the federal DREAM Act leaves states to shoulder the responsibility to assist undocumented students in pursuing their higher education goals. There are several ways California can strengthen support for Dreamers, such as:
- Establish a statewide work-study or service incentive program. Permitting students to participate in meaningful work programs would provide much-needed financial support, as well as help students build their professional connections and experience. This could be accomplished by passing the California DREAM Work-Study Program or similar programs at the institutional level, as implemented at some UC campuses.
- Designate and fund on-campus Dream resources. The Legislature has made several efforts to create Dream Resource Centers and designate liaisons to assist undocumented students, all of which have failed. Such designations would ensure that students on every public campus have access to the support and resources they need to be successful. While several UC and CSU campuses have already designated such support, many CCC’s have not, even though they have a higher proportion of undocumented students.
- Increase take-up rates for Cal Grants. The “take-up” rate for Dreamers who were awarded an Entitlement Grant or Middle Class Scholarship award is very low. Evaluating why some segments have higher take-up rates than others and identifying ways to increase paid rates would ensure Dreamers are receiving the financial support they need. Having dedicated Dream Resource Liaisons who are knowledgeable about the financial aid available to undocumented students could help address this gap.
- Expand Competitive Cal Grant eligibility. Since Dreamers are not eligible for federal financial aid, they rely on state support. Permitting undocumented students to apply for and receive Competitive Cal Grants with the same priority as resident students would provide much-needed financial support. Increasing the number of Competitive Cal Grants awarded each year would also increase the odds of a Dreamer receiving an award.
California’s economy is increasingly dependent on a highly educated workforce. Ensuring higher education is accessible and affordable for all students is imperative to meeting workforce demands and strengthening our economy over the long run. California has already established several policies that increase access to financial support for undocumented students, safeguard against immigration enforcement activities on campuses, and provide other resources for Dreamers attending the state’s higher education institutions. California already educates a large number of undocumented students in our K-12 system; ensuring their access to and success in postsecondary education continues that investment. As the new year approaches, California’s new governor has an opportunity to work with state legislative leaders to continue the state’s legacy of protecting undocumented students and can further advance the progress that has been made by enacting policies that support Dreamers’ journey towards a college degree and greater economic opportunity.
You may also be interested in the following resources:
-
Report
Trends in Transitional Kindergarten Enrollment in California
key takeaway TK enrollment in California has doubled since 2021-22, with growth across all student groups and high-poverty schools. To ensure all children benefit, the state must address disparities in access for students of color and those from low-income families. Early childhood education is foundational for young children’s development and their long-term outcomes, and preschool … ContinuedEducation -
Report
How California Is Expanding Transitional Kindergarten
key takeaway California is expanding Transitional Kindergarten to all four-year-old children by 2025-26, supported by state investments to improve access, staffing, and equity in public preschool programs. Early learning is foundational for young children’s development, and preschool programs provide essential opportunities for 3- and 4-year-olds. Recognizing this, in 2021, California policymakers embarked on a significant … ContinuedEducation
Stay in the know.
Join our email list!
The Community College League of California’s annual convention brought together California community college professionals and state and national leaders who shared their knowledge and experience. Policy Analyst Amy Rose presented her research on how much a debt-free college system would cost in California.
You may also be interested in the following resources:
-
Report
Trends in Transitional Kindergarten Enrollment in California
key takeaway TK enrollment in California has doubled since 2021-22, with growth across all student groups and high-poverty schools. To ensure all children benefit, the state must address disparities in access for students of color and those from low-income families. Early childhood education is foundational for young children’s development and their long-term outcomes, and preschool … ContinuedEducation -
Report
How California Is Expanding Transitional Kindergarten
key takeaway California is expanding Transitional Kindergarten to all four-year-old children by 2025-26, supported by state investments to improve access, staffing, and equity in public preschool programs. Early learning is foundational for young children’s development, and preschool programs provide essential opportunities for 3- and 4-year-olds. Recognizing this, in 2021, California policymakers embarked on a significant … ContinuedEducation
Stay in the know.
Join our email list!
For the California Association of Student Financial Aid Administrators’ (CASFAA) annual conference, “United Toward Access,” Policy Analyst Amy Rose presented her research on how much a debt-free college system would cost in California.
You may also be interested in the following resources:
-
Report
Trends in Transitional Kindergarten Enrollment in California
key takeaway TK enrollment in California has doubled since 2021-22, with growth across all student groups and high-poverty schools. To ensure all children benefit, the state must address disparities in access for students of color and those from low-income families. Early childhood education is foundational for young children’s development and their long-term outcomes, and preschool … ContinuedEducation -
Report
How California Is Expanding Transitional Kindergarten
key takeaway California is expanding Transitional Kindergarten to all four-year-old children by 2025-26, supported by state investments to improve access, staffing, and equity in public preschool programs. Early learning is foundational for young children’s development, and preschool programs provide essential opportunities for 3- and 4-year-olds. Recognizing this, in 2021, California policymakers embarked on a significant … ContinuedEducation
Stay in the know.
Join our email list!