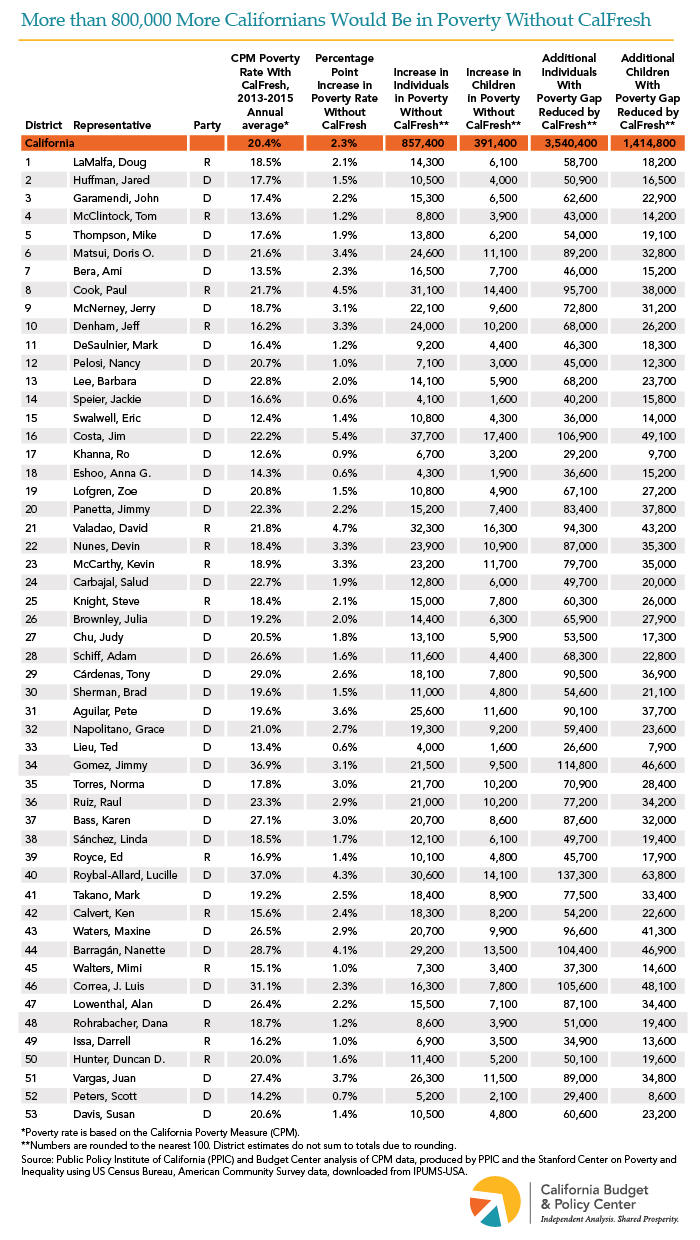
Food assistance provided by the Supplemental Nutrition Assistance Program (SNAP) — known as CalFresh in California — significantly reduces the rate and severity of poverty throughout the state. Without CalFresh, the poverty rate would have been higher in every California congressional district from 2013 to 2015, according to updated California Poverty Measure data recently produced by the Public Policy Institute of California and the Stanford Center on Poverty and Inequality. During this period, CalFresh reduced the poverty rate by 2.3 percentage points statewide, with the largest reductions — up to 5.4 percentage points — in districts in the Central Valley (see maps below.) More than 30,000 people per year would have been in poverty without CalFresh in Districts 16 (D-Costa), 21 (R-Valadao), 8 (R-Cook), and 40 (D-Roybal-Allard). Food assistance through CalFresh also lessened the severity of poverty for 3.5 million more people per year across California by reducing their poverty gap, or the shortfall between a family’s level of resources and the poverty threshold.
Congress will soon need to reauthorize the Farm Bill, which sets eligibility and funding levels for SNAP, but both President Trump and some congressional leaders have proposed cutting federal support and limiting who is eligible. Cuts like these would greatly reduce the effectiveness of one of California’s most important tools to mitigate poverty.
There was a problem processing your signup. Please try again. Or contact us
Please check your email to confirm your signup.
Supplemental Security Income/State Supplementary Payment (SSI/SSP) grants are a critical source of basic income for well over 1 million low-income people with disabilities and adults age 65 or older in California. Grants are funded with both federal (SSI) and state (SSP) dollars. Currently, the maximum monthly grant for an individual is about $911, which consists of an SSI grant of $750 and an SSP grant of $160.72. In order to help close budget shortfalls during the Great Recession, state policymakers made deep cuts to the SSP portion of the grant, reducing it from $233 per month in early 2009 to $156.40 per month by mid-2011. With an improving fiscal outlook, state policymakers increased the SSP portion by a modest $4.32 per month starting in January 2017. However, no additional state increases have been provided since then, and the Governor’s proposed 2018-19 state budget assumes that the SSP portion will remain frozen for another year. Because state cuts largely remain in place, SSI/SSP recipients have less money in their budgets to buy basic necessities such as medicine and food. (People enrolled in the SSI/SSP program are not eligible for CalFresh food assistance.) They also have less money to pay the rent. In fact, in every county, the “Fair Market Rent” (FMR) for a studio apartment exceeds 50% of the maximum SSI/SSP grant for an individual. People are at greater risk of becoming homeless when housing costs account for more than half of household income.
There was a problem processing your signup. Please try again. Or contact us
Please check your email to confirm your signup.
The Supplemental Nutrition Assistance Program (SNAP) is the country’s largest anti-hunger program. SNAP benefits are 100% federally funded and help families and individuals put food on the table by paying for a minimally adequate diet. Research shows that SNAP yields important long-term benefits in terms of participants’ economic self-sufficiency, health, and educational attainment, especially for children.[1]
In California, SNAP — known as CalFresh — serves a particularly vulnerable population. On average, almost 4.3 million Californians received CalFresh assistance each month during the 2016 federal fiscal year. Over half of these participants were children, and another 7.2% were either people with disabilities or adults age 60 or older.[2] Of younger adults without disabilities who receive CalFresh benefits, more than half lived with children.[3]
By increasing purchasing power for millions of Californians, CalFresh plays a crucial role in fighting poverty. With an average CalFresh household living on a gross income of $707 a month, the $281 average monthly benefit boosted their resources by 40%.[4] Without CalFresh food assistance, 22.7% of Californians would have lived in poverty and 7.0% would have lived in deep poverty in 2013-2015.[5] However, because of CalFresh, the poverty and deep poverty rates are actually 20.4% and 5.8%, respectively.[6]
Despite being one of the most effective anti-poverty programs, SNAP faces growing threats from federal policymakers. On February 12, the Trump Administration released the President’s budget for the 2019 federal fiscal year, which proposes slashing SNAP funding by over $213 billion (nearly 30%) over 10 years, including by narrowing eligibility and cutting benefits.[7] These changes would harm those who rely on food assistance, including the growing population of older Californians who already struggle to put food on the table.[8] Instead of targeting SNAP benefits, policymakers should focus on strengthening its ability to reduce hunger, ease hardship, and improve child well-being.
[8] Budget Center analysis of the California Health Interview Survey, 2011-2015. More than one-quarter of Californians age 65 or older (27.1%) report that they cannot afford enough food.
Making Ends Meet shines a light on the economic challenges faced by many Californians by showing the cost of supporting a family or a single individual in different parts of the state. This analysis presents basic family budgets for each of California’s 58 counties for four types of households: a single adult, a single-parent family, a two-parent family with one parent working, and a two-working-parent family. (All family types except single adult are assumed to have one preschool-aged child and one school-aged child.) These family budgets estimate the amount of income that households would need to cover basic expenses through earnings only, without publicly funded benefits or supports. Read the Making Ends Meet report, including methodology details.
There was a problem processing your signup. Please try again. Or contact us
Please check your email to confirm your signup.
State and National Leaders Must Do More to Promote Economic Security and Opportunity
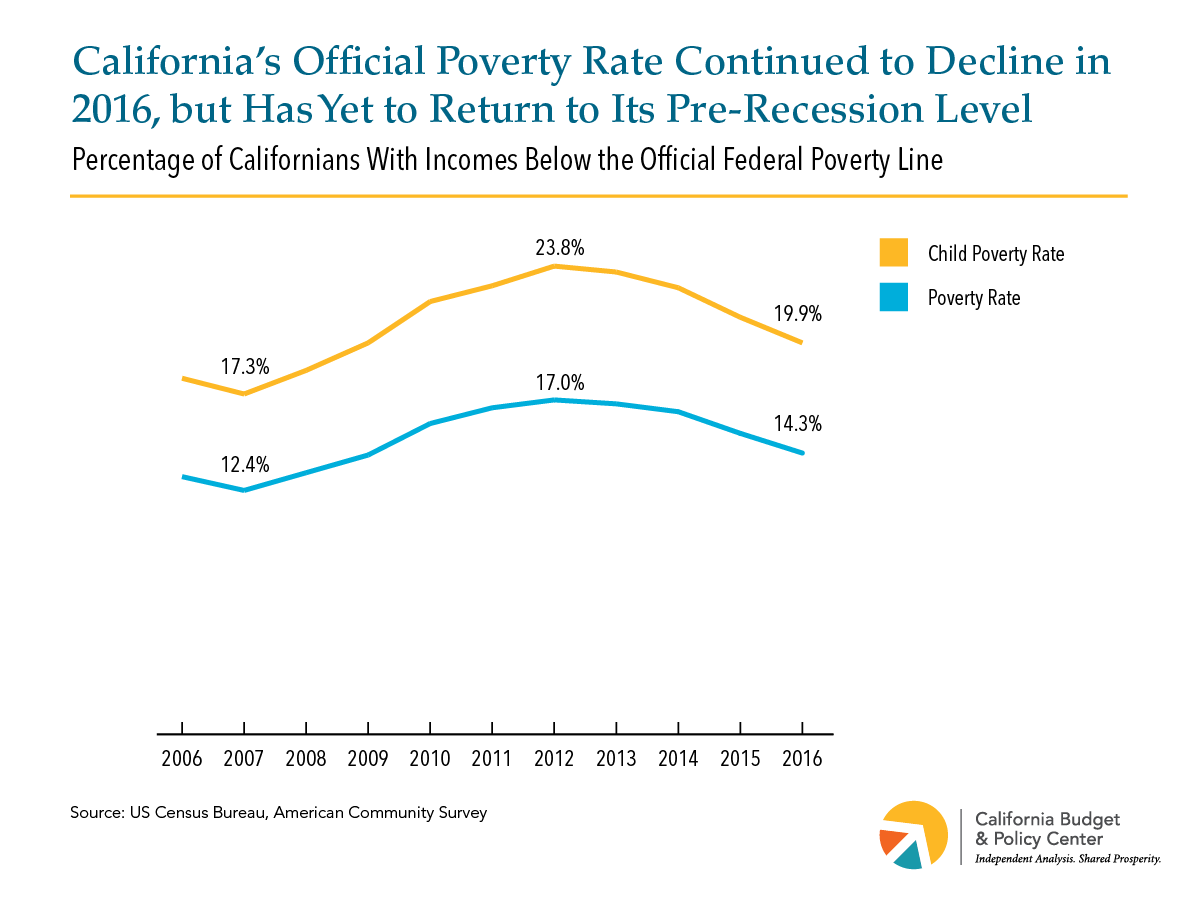
New Census figures released today show that millions of people in California continue to struggle to get by on extremely low incomes in spite of our state’s recent economic gains. More than 5.5 million Californians, including almost 1.8 million children, lived in poverty in 2016 based on the official poverty measure. In addition, poverty remained more widespread last year than it was in 2007 when the national recession began. Specifically, 14.3 percent of Californians had incomes below the official poverty line in 2016, down from a recent high of 17.0 percent in 2012, but still well above the state poverty rate in 2007 (12.4 percent). Also, roughly 1 in 5 California children lived in poverty last year (19.9 percent), down from a recent high of 23.8 percent in 2012, but still well above the child poverty rate in 2007 (17.3 percent).
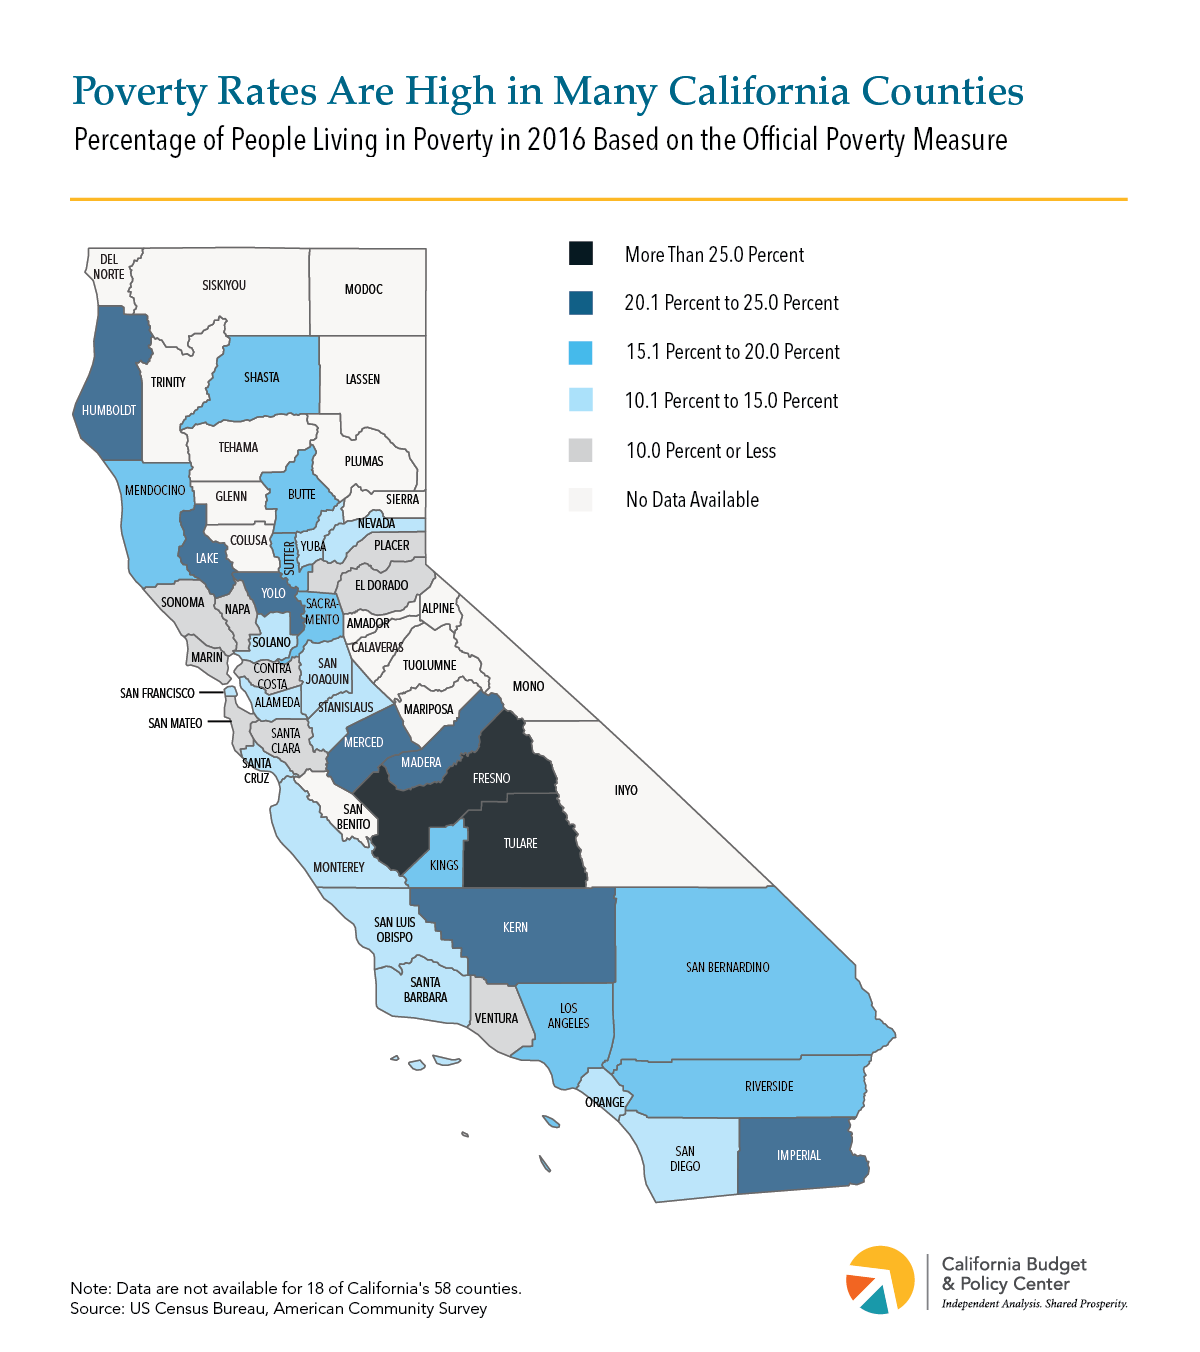
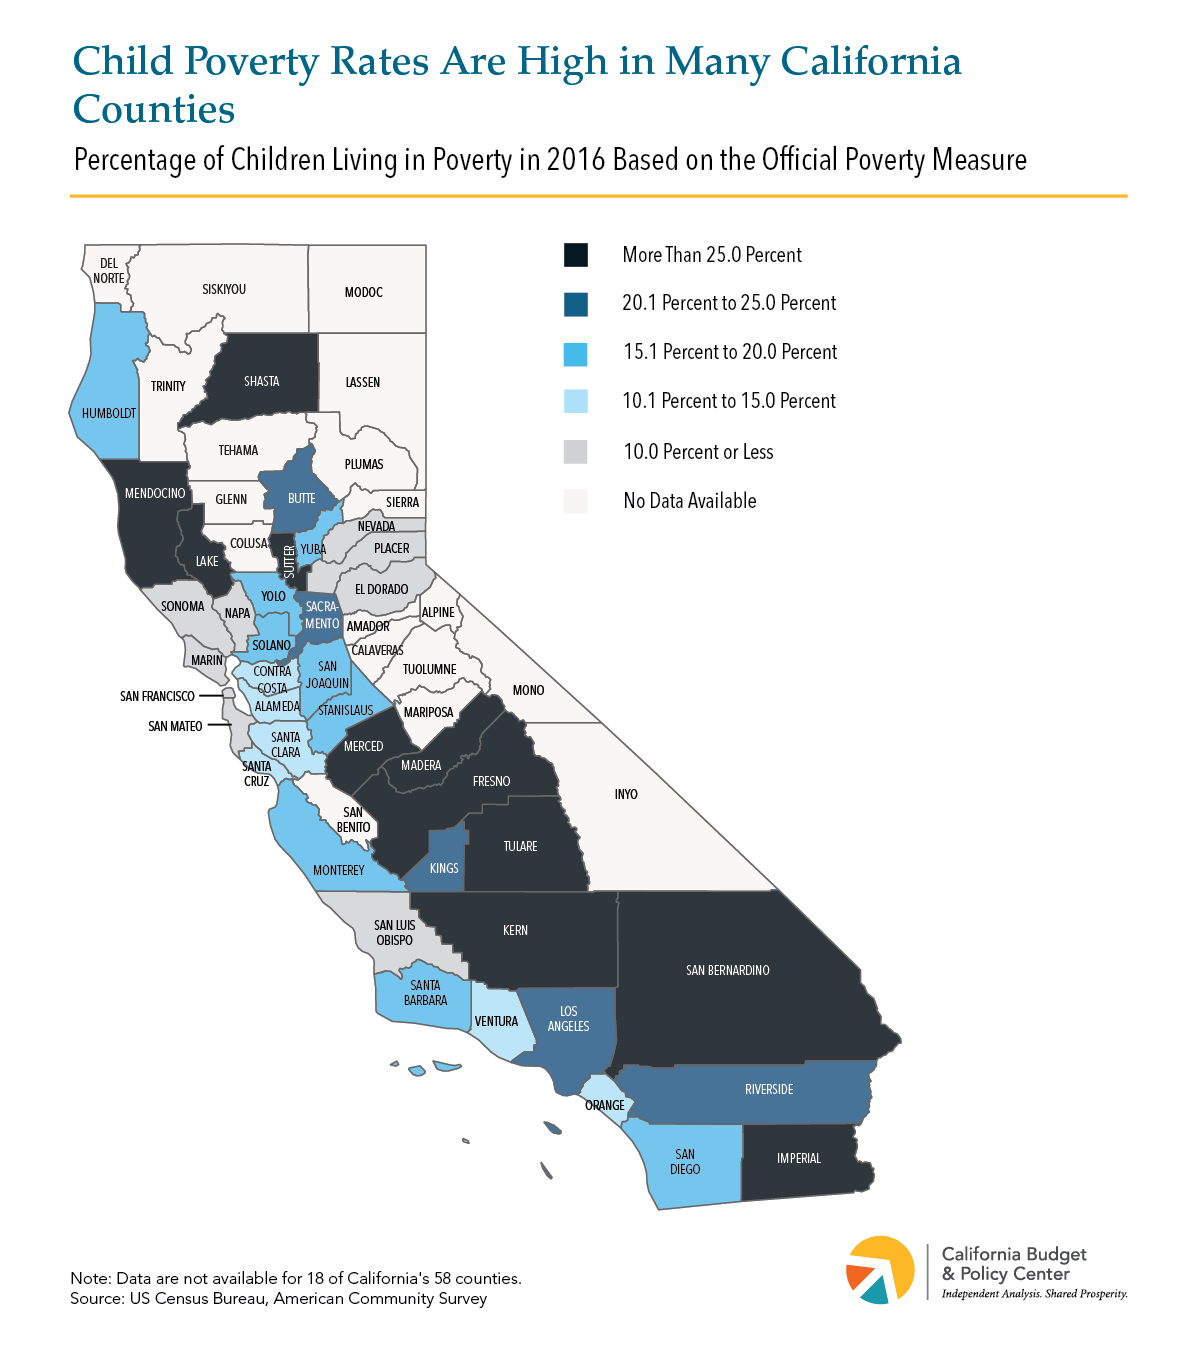
The latest Census figures also show that there are stark differences in people’s economic well-being across California’s counties. The 2016 official poverty rate ranged from a low of 6.5 percent to a high of 25.6 percent across the counties, while the official child poverty rate ranged from 5.2 percent to 37.9 percent. More than 1 in 5 people lived in poverty in nine counties, most of which are in the Central Valley (see Map 1). Additionally, more than 1 in 5 children lived in poverty in 16 counties, including six counties — again, most in the Central Valley — where over 30 percent of children were in poverty (see Map 2).
Although the Census figures published today show that poverty remains high, they understate the extent of hardship in California because they reflect an outdated measure of poverty. Census figures released earlier this week based on an improved measure — the Supplemental Poverty Measure (SPM) — which accounts for the high cost of housing in many parts of the state, show that roughly 8 million Californians per year, 1 in 5 state residents (20.4 percent), could not adequately support themselves and their families between 2014 and 2016. Under this more accurate measure of hardship, California continues to have the highest poverty rate of the 50 states.
The new Census poverty figures underscore the need for state and national leaders to do more to ensure that all people can share in our state’s economic progress. Specifically, policymakers should:
Reject steep cuts to economic security programs that help families make ends meet and get ahead. A majorityof adults will experience economic hardship for at least one year during their prime working years, and nearly half will turn to a major public support, such as SNAP food assistance (CalFresh in California), to get back on their feet. These supports not only lift millions of Californians out of poverty each year, but also help children succeed over the long-term, according to research. Yet federal policymakers have proposed slashing critical supports that promote economic security and opportunity. If enacted, these cuts would drive California’s already high poverty rate even higher and threaten the future of our state’s children. People in communities all throughout the state would likely be harmed.
Help families afford decent housing. With housing costs far outpacing many families’ earnings in recent years, it has become increasingly challenging for people with low incomes to keep a roof over their heads. Over half of California renters are housing “cost-burdened,” meaning that they pay more than 30 percent of their income toward housing, and nearly 30 percent are severely housing cost-burdened, spending over half of their income on housing. Since housing costs are most families’ biggest expense, addressing the housing affordability crisis is key to broadening economic security in California. The Legislature is considering a package of bills that would take important first steps toward addressing this crisis through policies that are designed to increase housing supply, including production of affordable units. Given the large scale of the housing crisis, additional strategies outside of the housing arena will also continue to be critical to help families with low incomes pay for basic necessities like housing.
Make sure workers earn enough to support themselves and their families. Most families in poverty work, which means that low pay and not enough work hours are key barriers to economic security and opportunity. California has recently made important strides to bolster workers’ economic well-being. For example, the state last year committed to gradually raise the state’s minimum wage to $15 per hour by 2023, and the lowest-paid workers in our state have already seen their hourly earnings increase significantly. California also created and then subsequently expanded the California Earned Income Tax Credit (CalEITC) — a refundable state tax credit that helps low-earning workers pay for basic necessities. Policymakers could build on this progress by increasing the size of the CalEITC and making sure that workers get the full benefit of the rising minimum wage by instituting practices that help part-time workers access additional work hours.
There was a problem processing your signup. Please try again. Or contact us
Please check your email to confirm your signup.
State and National Leaders Must Do More to Promote Economic Security and Opportunity
Around 8 million Californians — roughly 1 in 5 state residents (20.4 percent) — cannot adequately support themselves and their families, according to new Census figures released this morning based on the Supplemental Poverty Measure (SPM). This measure paints a more accurate picture of economic hardship than the official federal poverty measure in part because it better accounts for the state’s high cost of living (see note below).
The new data show that California continues to have the highest poverty rate among the 50 states largely due to high housing costs. This fact underscores the need for California to do more to increase access to affordable housing in order to promote greater economic security in the state. The new Census data also tell a cautionary tale about the potential impact of policies being pursued by federal policymakers. President Trump and congressional leadership have proposed slashing critical supports that help families afford basic necessities like food and housing, and that lift millions of people above the poverty line each year. If signed into law, these proposals would undoubtedly drive California’s already unacceptably high poverty rate even higher. Given this fact, California’s congressional representatives should reject steep cuts to vital public supports and instead prioritize policies that increase people’s economic security and opportunity.
California’s High Housing Costs Drive Up the State’s Poverty Rate
With 20.4 percent of state residents struggling to get by, California ranks first among the 50 states based on the SPM.[1] California’s No. 1 ranking largely reflects the state’s high housing costs. Unlike the official poverty measure, the SPM accounts for differences in housing costs across the US, and when these costs are factored in, a much larger share of the state’s population is living in poverty: 20.4 percent under the SPM, compared to 14.5 percent under the official measure. In fact, California’s poverty rate rises to the highest among the 50 states under the SPM, up from 16th highest under the official poverty measure.[2]
Housing costs are extremely high in many parts of California. Fair market rent for a modest two-bedroom apartment is more than $1,500 per month in the areas where nearly two-thirds of Californians live. At the same time, monthly rent affordable to a full-time worker at the state minimum wage is only $546 per month, which is less than the fair market two-bedroom rent anywhere in California. Thus there is no part of the state where a single mother with a minimum-wage job can expect to afford an apartment with a bedroom for herself and for her children.
Housing affordability is a problem throughout California, even in areas where housing costs are lower, because incomes are also lower in these areas. Statewide, more than half of renter households pay more than 30 percent of their incomes toward housing, making them housing cost-burdened, and nearly a third of renter households are severely cost-burdened, paying more than half of their incomes toward housing.
Given the crisis of housing affordability throughout the state, it is important to pursue policies that can help slow down rising housing costs and facilitate production of more affordable housing. State policymakers are currently considering a package of bills that would take an important step toward addressing this problem by increasing the production of housing and streamlining the local review process for certain housing projects in places that have not met their “fair share” housing goals. These measures would represent important first steps in providing some relief to families struggling to afford housing, a challenge that California will need to continue working to address in coming years.
Federal Policy Proposals Threaten to Plunge More Californians Into Poverty
The fact that around 8 million Californians struggle to get by — several years after the national recession ended — highlights the need for policies that allow more people to share in our recent economic gains. Yet the policies being pursued by President Trump and congressional leadership would decimate critical public supports that help struggling families and individuals make ends meet, inflicting serious hardship on millions of people.
Indeed, some of the proposed cuts target supports that are proven tools for reducing poverty. For instance, the Supplemental Nutrition Assistance Program (SNAP) — CalFresh in California — lifted around 800,000 Californians, including about 400,000 children, above the poverty line each year, on average, between 2009 and 2012. In addition, the federal Earned Income Tax Credit (EITC) and child tax credit (CTC) lifted nearly 1.4 million Californians, including roughly 700,000 children, out of poverty. Moreover, these supports not only help families get by day to day, but also may provide longer-term benefits to children. Research shows, for example, that food assistance, working-family tax credits, and other supports that help families afford basic needs help children to do better in school and increase their earning power when they grow up.[3] Given these facts, federal policymakers should reject any proposal that would weaken these vital public supports.
* * *
Note About the Census Bureau Data Released Today
The state-level figures released today reflect average annual poverty rates during a three-year period, from 2014 to 2016. The SPM addresses a number of shortcomings of the official poverty measure. One is the fact that under the official measure, the income threshold for determining who lives in poverty is the same in all parts of the US. For example, a parent with two children was considered to be living in poverty in 2016 if their annual income was below about $19,300, regardless of whether they lived in a low-cost place like rural Mississippi or a high-cost place like San Francisco. The SPM better accounts for differences in the cost of living by adjusting the poverty threshold to reflect differences in the cost of housing throughout the US. For example, the SPM poverty line for a parent with two children living in a renter household in the San Francisco metropolitan area was about $29,500 in 2016 — considerably higher than the poverty line based on the official measure.
Another shortcoming of the official poverty measure is that it fails to factor in the broad array of resources that families use to pay for basic expenses. The official measure only counts cash income sources, such as earnings from work, Social Security payments, and cash assistance from welfare-to-work programs. It does not take into account noncash resources, such as food or housing assistance, and it fails to consider how tax benefits, such as the federal Earned Income Tax Credit (EITC), increase people’s economic well-being. The SPM improves on the official measure by including these resources. It also better accounts for the resources people actually have available to spend by subtracting from their incomes what is needed to pay for necessary expenses, including work-related expenses, such as child care; medical expenses, such as health insurance premiums and out-of-pocket costs; and state and federal income and payroll taxes.
After incorporating these improvements over the official poverty measure, the SPM produces a more realistic picture of poverty in California: the state’s SPM poverty rate was 1.4 times the official poverty rate between 2014 and 2016 (20.4 percent versus 14.5 percent, respectively).
Although the SPM provides a more accurate picture of economic hardship in California, it does not indicate how much people need to earn to achieve a basic standard of living. Measuresof what it actually takes to make ends meet in California show that families need incomes several times higher than the official poverty line to afford basic necessities.
Endnotes
[1] Florida ranks second among the 50 states with 18.7 percent of state residents living in poverty based on the SPM between 2014 and 2016, followed by Louisiana where the poverty rate was 18.4 percent.
There was a problem processing your signup. Please try again. Or contact us
Please check your email to confirm your signup.
A number of current proposals at the federal level, put forth by the Trump Administration and congressional leaders, call for deep spending cuts to many important public services and systems that improve the lives of individuals and families across California. These cuts are proposed at a time when both President Trump and leaders in the House of Representatives have signaled support for major taxcuts that would largely benefit the wealthy and large corporations.
Although federal spending deliberations occur far from California, their outcomes have deep potential impacts right here at home, in every part of our state. In order to shed light on the local importance of federal budget choices, as well as underscore what’s at stake in the votes cast by members of California’s congressional delegation, we are pleased to provide these House district Fact Sheets. They provide district-by-district figures on public services and supports across four areas — food and shelter, health care, income support, and education — along with local information on social and economic conditions.
There was a problem processing your signup. Please try again. Or contact us
Please check your email to confirm your signup.
This website uses cookies to analyze site traffic and to allow users to complete forms on the site. The California Budget & Policy Center does not share, trade, sell, or otherwise disclose personal information. By using our website you agree to our Privacy Policy.