Much has been written about how the Tax Cuts and Jobs Act (TCJA), pushed by Republican leaders in Congress and signed into law by President Trump in December 2017, mostly benefits wealthy households while driving up the federal deficit by $1.9 trillion over the next 10 years. This growing deficit — already 17% higher in the federal fiscal year that ended on September 30 than in the previous year — threatens federal funding for critical investments and services that provide economic security and opportunity for low- and middle-income households.
Given that the benefits of the TCJA are grossly skewed toward the wealthiest taxpayers, it is no surprise that the new law also has disparate impacts across racial and ethnic groups, with white households — which already hold a disproportionate share of the nation’s wealth — reaping a disproportionate share of the tax cuts.
Income and Wealth Inequality Are Already Deeply Troubling
Before the TCJA was enacted, the nation’s income and wealth were shockingly unequal in their distribution, both by income group and race/ethnicity. In 2016, just the richest 1% of families received nearly one-quarter (23.8%) of the nation’s income, while the entire bottom 90% of families received less than half (49.7%), according to the Federal Reserve’s Survey of Consumer Finances. The distribution in California is almost identical, where the top 1% received 23.1% of the state’s income and the bottom 90% received 49.6%, according to the Franchise Tax Board.
The inequality in wealth distribution is even more striking. The nation’s wealthiest 1% owned nearly two-fifths (38.6%) of all the wealth in 2016, while the bottom 90% owned just 22.8%.
Decades of discrimination and barriers to economic opportunity for people of color has also led to stark disparities in income and wealth between white families and families of color. In 2016, white families had a median income of $61,200, while median incomes for Latinx and black families were $38,500 and $35,400, respectively. In other words, white families earned more than 1.5 times what Latinx and black families did. Here in California, median incomes are higher for all groups, but the differences between white families and families of color are quite similar to those at the national level. The median income for white families in the state was $100,407 in 2016, versus $57,447 for black families and $53,265 for Latinx families, according to data from the U.S. Census Bureau.
Wealth inequality between racial/ethnic groups is, again, far more startling than income inequality. White families had a median net worth of $171,000 in 2016, more than 8 times that of Latinx families ($20,700) and nearly 10 times that of black families ($17,600).
New Federal Tax Law Exacerbates Existing Racial Inequalities
Tax policies can mitigate economic inequality — or make it worse. Federal lawmakers last year chose the latter path by enacting the Tax Cuts and Jobs Act.
Overall, ITEP’s analysis found that nearly three-quarters (72%) of the tax cuts will go to the richest 20% of taxpayers in 2018, while only 28% of the tax cuts will go to the remaining 80%. The average tax cut for the top 1% of US taxpayers — a group with an average income of $1.8 million — will be nearly $48,000 this year. Meanwhile, households earning less than $23,000 will get an average annual tax cut of $90, equal to about 25 cents a day.
Here, too, the racial disparities are stark. White households, who are overrepresented in higher income groups, will get almost 80% of all the TCJA’s tax cuts this year, even though they make up 67% of all taxpayers. Conversely, black and Latinx households, who are overrepresented in lower income groups, will get a smaller share of the tax cuts than their share of the population of taxpayers (see chart).
In addition to getting a disproportionately small share of the tax cuts, black and Latinx households will also get a much smaller average tax cut than white households. Across all income groups, white households will receive $2,020 on average this year, more than twice as much as the average tax cut for black and Latinx households.
These racial disparities exist even among the highest-income households. Within the top 1% of all households, the average tax cut for white households is $52,400 — again, more than twice the average tax cut for black and Latinx households (see chart).
A major reason for the differences in the average tax cuts among racial groups in the top 1% is that even in this fortunate group, white households have more income from wealth, which the new tax law privileges over earnings from work. The TCJA included a massive cut to the corporate tax rate, as well as a new tax break for non-corporate business owners and a large scaling back of the estate tax. Thus, taxpayers who have large corporate stock holdings, investments in businesses, and valuable homes stand to benefit even more than high-income taxpayers who primarily have earnings from work. This further contributes to the uneven racial impacts of the tax law, as white households are significantly more likely than black and Latinx households to own stock, either directly or indirectly through retirement accounts, to own businesses, and to own their homes.
Beyond the immediate inequities of the TCJA, the resulting increase in the deficit is already being used by congressional leadership and President Trump as justification for cutting spending on federal programs that help improve the lives of lower-income families and individuals in California and across the country, which will disproportionately impact families of color. Such cuts will only serve to increase the existing inequality of opportunity between white families and people of color in the state and the nation.
State Lawmakers Can Work to Counteract Harmful Effects of the TCJA with Tax Policies That Narrow the Racial Wealth Gap
While California’s elected representatives in Washington can continue to call for reversals to provisions in the TCJA that increase economic inequality and that widen the racial wealth gap, California’s state leaders can take proactive steps toward reducing racial inequalities that are made worse by the TCJA. The California tax code is one of many areas where improvements can be made in pursuit of this goal.
For instance, one tool to reduce economic and racial inequality is to implement a state-level estate or inheritance tax. The TCJA drastically cut the federal estate tax by doubling the value up to which estates are exempt from the tax. Even before the TCJA, the federal estate tax only affected a very small number of large estates – 1,179 in California in 2017, according to the Internal Revenue Service. With the TCJA’s increased exemption amount, the number of estates subject to the tax is expected to fall by nearly two-thirds, leaving only 0.07% of estates taxable nationwide. California could enact an estate tax with an exemption level at or below the previous federal level of $5.49 million per person ($10.98 million for couples), which could reduce inequality in two ways. First, an estate tax serves as a curb on dynastic wealth, which well-off (and disproportionately white) families pass from generation to generation, ever widening the racial wealth gap. Second, the tax would provide a new source of revenue that could support more robust services that increase opportunities for low- and middle-income families of color. California voters would need to approve an estate or inheritance tax, since Proposition 6 of 1982 repealed the inheritance tax and prohibited the levying of any estate, inheritance, or wealth tax.
Another way the state tax code could be made more equitable is by reforming or eliminating tax deductions that primarily benefit wealthy homeowners, namely the deductions for mortgage interest and property taxes. White families are not only more likely to own homes, but to have more valuable homes: the average net housing wealth (home value less debts owed on the home) for white homeowners was $215,800 in 2016, compared to $129,800 for Latinx homeowners and $94,400 for black homeowners. Therefore, they benefit more from these deductions than do black and Latinx homeowners. In addition, because these tax breaks are structured as deductions, taxpayers with higher incomes and in higher tax brackets get a larger tax benefit per dollar deducted than taxpayers in lower brackets, intensifying the upside-down nature of these tax breaks. Eliminating or restructuring these tax benefits so they are more targeted to lower-income families would both increase state revenues for critical public services and lessen the tax code’s preference towards wealthier and disproportionately white homeowners.
While the options discussed above could reduce inequality by raising revenues from wealthy taxpayers, other tax provisions lessen inequality by boosting incomes for lower-income taxpayers. One effective example is the Earned Income Tax Credit (EITC). The federal EITC has been successful in reducing poverty, encouraging work, and can even improve the future earnings prospects of children in families receiving the credit. California enacted its own credit (the CalEITC) in 2015 and has since expanded it to reach more families. Lawmakers can build on the success of the CalEITC and further expand it to provide more support to California families that are struggling to make ends meet.
California lawmakers can also help lower-income families and people of color afford the costs of living by expanding the Child and Dependent Care Credit and the Renter’s Credit. Currently, both of these credits are non-refundable, meaning families can only claim the credit against any positive tax liability, so they cannot get a refund if the amount of the credit exceeds their tax liability. Unlike the CalEITC, which is refundable, these two credits provide more benefits to middle-income families than to low-income families. Making the credits refundable would provide another boost to families that are most in need of assistance.
In other words, state leaders and Californians have choices we can make, responding to and irrespective of the TCJA, to reduce the extent to which our state’s tax system exacerbates the racial wealth gap.
As a new Governor takes office, the new legislative session begins in January, and state lawmakers again consider proposals to respond to the new federal tax law, they should not overlook opportunities to reduce the longstanding inequities in the state’s tax code that contribute to the growing racial wealth gap.
There was a problem processing your signup. Please try again. Or contact us
Please check your email to confirm your signup.
In recent years, California has enacted various criminal justice reforms that have reduced the number of people incarcerated by the state and placed a greater emphasis on crime prevention and pathways to rehabilitation. Yet, even with this progress, state prisons remain overcrowded, spending on state corrections remains high, and racial and ethnic disparities persist.
This chartbook discusses the recent reforms, the key challenges still facing California’s corrections system, and the prospects for — and potential impacts of — further reforms.
There was a problem processing your signup. Please try again. Or contact us
Please check your email to confirm your signup.
What Would Proposition 1 Do?
Prop. 1 would allow California to sell $4 billion in bonds to support affordable housing development and to help veterans and low- and moderate-income homebuyers purchase homes. Prop. 1 was placed on the ballot through legislation enacted last year, the Veterans and Affordable Housing Bond Act of 2018 (Senate Bill 3, Beall), which was part of the broader legislative housing package passed by state policymakers to help address California’s housing affordability crisis. Of the $4 billion in bonds sold under Prop. 1, $3 billion would be repaid over several decades, with interest, from the state General Fund, and $1 billion would be fully repaid by veterans receiving bond-funded home loans.
What Problem Does Proposition 1 Aim to Address?
California faces a housing affordability crisis. Among all Californians in 2016, more than 4 in 10 households (42.1%) across the state paid more than 30% of their incomes toward housing costs, a level considered unaffordable according to the US Department of Housing and Urban Development. More than 1 in 5 (21.0%) were severely housing cost-burdened, spending over half their incomes on housing, according to a Budget Center analysis of US Census Bureau data.
Californians with low incomes have particularly high rates of housing cost burden. Among households with incomes below 200% of the official federal poverty threshold, more than 1 in 2 (57.3%) paid more than half of their income toward housing costs in 2016. Unaffordable housing burdens affect residents in all parts of the state, even in areas where housing costs are lower, because incomes in those areas tend to be lower as well. Moreover, California’s high housing costs are a key driver of the state’s high poverty rate. Under the Supplemental Poverty Measure, an improved poverty measure that accounts for differences in local costs of living, nearly 1 in 5 Californians (19.0%) were living in poverty from 2015 to 2017 — giving California one of the highest poverty rates in the country, statistically tied for first (with Florida and Louisiana) among the 50 states.
When individuals do not have access to housing they can afford, the consequences can be serious. This is because safe, stable housing is a key foundation for short-term and long-term health and well-being. Unaffordable housing costs can force households into substandard housing, which is linked to poor health outcomes. Lack of affordable housing can also force families to move more often, and this housing instability is linked to negative health outcomes for both adults and children, as well as worse educational outcomes for children. In the most extreme cases, high housing costs can push households into homelessness, with particularly negative effects on children’s physical and mental health. Addressing the problem of housing affordability can help prevent this cascade of negative health, behavioral, and educational outcomes. Improvements in individual health and well-being can also translate into broader public benefits, as healthier individuals are less likely to need public services and supports to address health or mental health needs.
A key driver of California’s housing affordability crisis is an inadequate supply of housing. The Department of Housing and Community Development estimates that 180,000 new housing units need to be built each year to keep up with housing demand, but over the past 10 years only 80,000 units have been built per year on average. Given the large scale of this problem, an array of different policy strategies are needed to push California’s housing supply to catch up with the need for housing for current and future residents.
One strategy is direct state investment in building affordable housing and helping individual Californians afford housing. An increase in the supply of housing that is affordable to the lowest-income residents is especially needed in California, because these households are least able to afford California’s escalating rents, which have been growing faster than median annual earnings. The National Low Income Housing Coalition estimates that California has only 67 affordable housing units available for every 100 low-income households. Research in the San Francisco Bay Area has also shown that in the face of gentrification pressures, an increase in subsidized affordable housing units has nearly twice the impact in reducing displacement of low-income households at the regional level, compared to a similar increase in market-rate housing units.
What Is the Expected Impact of Proposition 1?
The bond funds from Prop. 1 would be allocated to a number of established state housing programs. Of the $4 billion total, $3 billion would support the development of affordable housing and homebuyer assistance for low- and moderate-income Californians, specifically:
$300 million to the Infill Infrastructure Grant Program, for new construction and rehabilitation of infrastructure that supports high-density affordable and mixed-income housing in infill locations
$300 million to the CalHome Program of the Self-Help Housing Fund,* for forgivable loans for projects that create multiple affordable homeownership units, self-help mortgage assistance, and mobile homes
$300 million to the Joe Serna Farmworker Housing Grant Fund,* for construction, rehabilitation, and acquisition of housing for agricultural employees and their families
The remaining bond funds consist of $1 billion for the Cal-Vet Home Loan Program to provide homebuyer loans to veterans, without regard to income (which would be paid back to the state by the loan recipients). Altogether, the Prop. 1 bond funds would support a wide variety of housing activities, including multifamily affordable housing development, infrastructure to facilitate infill and transit-oriented housing, affordable homeownership opportunities, farmworker housing, self-help (e.g. Habitat for Humanity) and mobile home housing, and mortgages for veterans.
In the case of housing and/or infrastructure development, funds from Prop. 1 would typically make up only a portion of the total funds for any given project. Bond funds would be used by developers to leverage additional federal, state, and local public funds, as well as private financing, to cover the full costs of these types of projects, which would multiply the impact of the Prop. 1 funds.
Altogether, the Legislative Analyst’s Office (LAO) estimates that Prop. 1 would “provide annual subsidies for up to 30,000 multifamily and 7,500 farmworker households” as well as “down payment assistance to about 15,000 homebuyers and home loans to about 3,000 veterans.” The California Housing Partnership Corporation and Northern California Carpenters Regional Council, which support Prop. 1, have estimated a somewhat larger number of housing units — “nearly 50,000 new and rehabilitated housing units” — would be created with the support of the $3 billion in Prop. 1 housing funds (separate from the $1 billion for mortgage assistance for veterans). This estimate was calculated using the IMPLAN economic impact model and was based on historical per-unit costs and leveraged funding, adjusted by region, for each of the state housing programs to which Prop. 1 funds would be allocated.**
The housing produced through Prop. 1 would not be sufficient to close California’s affordable housing shortfall. However, no single policy could be expected to fully address the state’s tremendous housing affordability challenges. The bond funds would support the production of housing units affordable to low-income residents, which are unlikely to be produced by the private for-profit housing market and which would help the residents who struggle most to afford the state’s high housing costs.
What Are the Tradeoffs in Using Bond Dollars to Support Affordable Housing Through Proposition 1?
Of the total $4 billion in bonds that Prop. 1 would authorize, the $1 billion for mortgages for veterans through the Cal-Vet Home Loan Program would be expected to be fully repaid over time by the veterans receiving home loans, at no direct cost to the state, according to the LAO. However, the remaining $3 billion in bonds for other housing activities would have to be repaid over time, with interest, from the state’s General Fund. The LAO estimates that the cost to repay the bonds would be approximately $170 million each year for 35 years. Over this period, the state would pay $3 billion to repay the principal on the bonds and an estimated $2.9 billion for the interest, according to LAO estimates, for a total of $5.9 billion, or nearly twice the amount of the original bond issuance.
The General Fund dollars used to repay the principal and interest on the Prop. 1 bonds would not be available to support other public systems and supports, including those that directly support low- and moderate-income Californians — a tradeoff that should be considered when evaluating the potential impact of Prop. 1. On the other hand, as noted above, safe, affordable, stable housing is a foundation for long-term physical and mental health and is linked to improved individual educational and economic outcomes. As a result, an investment in affordable housing could contribute to healthier, more productive residents who may have less long-term need for publicly-funded health, mental health, and safety net services.
What Do Proponents Argue?
Proponents of Prop. 1 include veterans’ organizations, affordable housing advocates, business and labor leaders, cities, and environmental groups. Among these are Dignity Health, Habitat for Humanity California, United Ways of California, California Association of Veterans Services Agencies, California Housing Consortium, Housing California, Silicon Valley Leadership Group, State Building and Construction Trades Council of California, California League of Conservation Voters, and the California League of Cities. Proponents argue that Prop. 1 “directly addresses the shortage of housing by building more affordable homes — without raising taxes.” They state that Prop. 1 will benefit “hardworking people like nursing aides, grocery clerks, and teaching assistants, so they can live in the communities where they work” and “will address rising homelessness in our neighborhoods.”
What Do Opponents Argue?
Opponents of Prop. 1 argue that the bond funds “would go to a variety of programs that may or may not repay money for revolving use” and would help only “a very limited number of persons.”
Conclusion
To address the root cause of California’s housing affordability crisis, the state needs to increase its supply of housing. Increasing the supply of affordable homes in particular is especially needed, because low-income Californians are most likely to have high housing cost burdens and are least likely to be able to afford rising rents. Prop. 1 would not in itself eliminate California’s affordable housing gap, but it would take a step toward addressing the shortfall by allowing the state to sell $4 billion in bonds and use the proceeds to develop affordable housing and help veterans and low- and moderate-income Californians purchase homes.
These bonds would be paid off over 35 years, at about $170 million per year. The $1 billion in bonds to help veterans buy homes would be fully repaid by home loan recipients, at no direct cost to the state, but the $3 billion in bonds for other housing activities would incur principal and interest costs, which would be paid out of the state General Fund. These dollars would not then be available to pay for other public systems and costs supported by General Fund dollars, like pensions for public employees, health care for low-income individuals, or the criminal justice system. A key question for voters is whether developing tens of thousands of affordable housing units and assisting veterans and lower-income residents to purchase homes is worth the tradeoff of dedicating these General Fund dollars to bond principal and interest payments over time. In evaluating this tradeoff, considerations include the fact that bond funds would leverage significant federal, local, and private dollars to support housing production and that affordable housing has cascading positive effects on health and well-being, which may reduce demands for other public supports over the long term.
* Up to $360,000 of the total combined funds allocated to these programs could be used by the Department of Housing and Community Development to provide related technical assistance to cities and counties.
** This estimate did not account for the $150 million allocated to homebuyer assistance through CalHFA rather than to housing production, which would slightly decrease the estimated number of housing units produced.
There was a problem processing your signup. Please try again. Or contact us
Please check your email to confirm your signup.
Proposition 10, which will appear on the November 6, 2018 statewide ballot, would repeal a state law that limits the scope of local rent control policies that cities and other local jurisdictions are allowed to adopt. Prop. 10 was placed on the ballot by petition signatures and qualified for the ballot with key financial support from Michael Weinstein of the AIDS Healthcare Foundation. This post provides an overview of Prop. 10, discusses its expected impact, and examines other issues the measure raises in order to help voters reach an informed decision.
What Would Proposition 10 Do?
Prop. 10 would repeal a state law, the Costa-Hawkins Rental Housing Act (or “Costa-Hawkins”), that currently places restrictions on the rent control policies that cities and other local jurisdictions may choose to apply to rental housing in order to limit allowed rent increases. Costa-Hawkins currently prohibits cities from limiting rent increases in certain types of rental homes, including single-family homes, apartments that were built after February 1995 (or after an earlier date in some cities), and vacant apartments that are turning over to new tenants. By repealing Costa-Hawkins, Prop. 10 would allow cities to choose to limit rent increases in these types of rental homes in addition to the older, occupied rental apartments to which local jurisdictions may currently apply rent control if they choose.[1]
What Problem Does Proposition 10 Aim to Address?
Housing costs in many parts of California are very high, and housing is unaffordable for many residents in all parts of the state.[2][3] Many Californians now pay more than 30% of their income for housing, which the US Department of Housing and Urban Development defines as an unaffordable housing cost burden. Among all Californians in 2016, more than 4 in 10 households across the state were housing cost-burdened, and more than 1 in 5 were severely cost-burdened, spending over half their incomes on housing, according to a Budget Center analysis of US Census Bureau data. Unaffordable housing is a problem that disproportionately affects low-income households, and the majority of individuals with high housing cost burdens in California are people of color.[4] Moreover, California renters are particularly affected by unaffordable housing cost burdens. More than half of California renter households paid over 30% of their income toward housing in 2016, and nearly 1 in 3 paid more than half of their incomes toward housing (see Figure 1).
Figure 1
These high housing cost burdens have serious consequences for California families. By making it harder for families to make ends meet, unaffordable housing costs may force families to double-up to save on rent or settle for substandard housing in unhealthy, low-opportunity neighborhoods. Families who are paying more than they can afford for housing may have to cut costs by choosing low-quality child care or letting health problems go unaddressed, and they may be unable to set aside savings for emergencies or for retirement. In the worst cases, they may be pushed into homelessness. These kinds of hardships have both immediate and long-term consequences, for adults and especially for children.[5]
California’s unaffordable housing costs are a problem not simply because housing costs are high, but because they have been growing quickly relative to incomes. While median annual earnings for full-time workers in California increased 4% from 2006 to 2016, median household rents increased by 13%, more than three times as much as earnings did, during the same period (see Figure 2).
Figure 2
With earnings outpaced by living costs, families and single individuals struggle to cover the basic costs of housing, food, child care, and other needs. As a response to California’s housing pressures, rent control focuses on protecting renters from rapidly rising housing costs. Prop. 10 would allow cities to choose to expand local rent controls by repealing the restrictions on rent control imposed by Costa-Hawkins.
What Is the History of the Costa-Hawkins Rental Housing Act?
In the 1970s and 1980s, an earlier period of rapidly rising rents, several California cities adopted local policies that limited the rent increases that landlords were allowed to impose, policies known as rent control or rent stabilization. Landlords and housing developers sought to restrict the allowed scope of these types of local policies through a failed state ballot initiative and repeated failed legislative proposals in the 1970s, 1980s, and early 1990s. Finally, in 1995, the Costa-Hawkins Rental Housing Act, sponsored by the California real estate industry, passed the Legislature and was signed by Governor Pete Wilson.[6]
Through Costa-Hawkins, the state imposed three limits on the scope of local rent control laws.[7] First, single-family homes were exempted from rent control. Secondly, rent control could not apply to any newly built housing starting February 1, 1995. For cities that already had some form of rent control, Costa-Hawkins back-dated this second restriction on rent controls on new housing to the date of the local ordinance. (For example, since Los Angeles instituted rent control in 1978, housing built after 1978 in Los Angeles was required to be exempt from rent control.) Finally, the Act prohibited local jurisdictions from imposing “vacancy control,” or requiring that below-market rents be maintained on rent-controlled apartments even after tenant turnover. In other words, Costa-Hawkins required that landlords of rent-controlled buildings be allowed to charge market-rate rent to new tenants moving into a unit that had been vacated (known as “vacancy de-control”). By repealing Costa-Hawkins, Prop. 10 would remove these three restrictions on the rent control policies that local jurisdictions are allowed to adopt.
What Is the Expected Impact of Proposition 10?
First, it is important to note what Prop. 10 would not do. Prop. 10 would not establish the basic authority of cities in California to choose to adopt rent control policies that apply to a substantial share of rental housing in the state. Local jurisdictions are already permitted to limit rent increases in all housing that is not explicitly exempted from rent control by Costa-Hawkins, and the older apartments that are not covered by Costa-Hawkins make up roughly half of all existing rental homes in California. In fact, most recently — in 2016 — voters in two San Francisco Bay Area cities approved new policies to establish local rent controls for the first time, to apply to rental apartments built before February 1995.[8] Moreover, if Prop. 10 passes, rent controls would not automatically be expanded to additional cities or (with a few exceptions) to additional rental homes in California.[9] In nearly all cases, cities or other local jurisdictions would have to take separate action, through their elected officials or voter initiatives, to adopt new local rent stabilization policies that would apply to the types of housing that are currently exempt from rent limits under Costa-Hawkins. Prop. 10 also would not force landlords to rent out units at a loss, since state law would continue to require that local rent control policies allow landlords to receive a “fair rate of return.”[10]
What Prop. 10 would do is allow cities to choose to limit rent increases within a broader range of rental homes, including single-family homes and apartments built since 1995 (or since earlier years in cities with longer-standing rent control policies) and/or when new tenants move into a vacant rental home. Cities that already have rent control policies in place (see Table 1) could choose to expand these policies to cover more of their rental stock or to restrict rent increases when a unit becomes vacant. Cities that do not currently have rent control policies could choose to adopt new policies that would apply to all of their rental housing or to any subset of rental homes without regard to the limitations currently set by Costa-Hawkins. For example, a city could choose to adopt new rent controls that would apply to all rental homes, or to all apartments built before 2005 but only for continuing tenants, or to both single-family homes and apartments built before 1995 but only for landlords that rent out at least 25 homes, or to any other subset of rental homes. Existing local rent control ordinances vary greatly in how they are designed, and any new local ordinances would likely also show considerable variation.
Table 1
While a large share of rental homes in California are not required to be exempt from rent control by Costa-Hawkins, a significant number of renters live in properties that could become newly covered by rent controls if Prop. 10 passes and their local jurisdiction chooses to adopt new rent control policies that apply to these homes. Statewide, more than one-third (35.5%) of renter households — or 2.06 million households — lived in single-family homes as of 2016, and this share has increased by about 10% since 2006, when 32.4% of renter households lived in single-family homes.[11] Renter households are most likely to live in single-family homes in the less urban, inland regions of the state — for example, more than half of renter households in the Sierra Nevada (55.4%), Central Valley (53.0%) and Far North (51.4%) lived in single-family homes in 2015-2016. Renters are least likely to live in single-family homes in the coastal urban regions of California — for example, in 2015-2016 less than a third of renter households occupied single-family homes in Los Angeles and the South Coast (29.3%) and the San Francisco Bay Area (30.6%).[12] These coastal urban regions are the areas where rents have been rising most rapidly, and while single-family homes represent a relatively smaller share of occupied rentals in these high-cost regions, they still house a significant number of renters in these areas.
Other renters live in apartments that were built within the last few decades. This means these units are not allowed to be covered by rent control under Costa-Hawkins, but could become covered if Prop. 10 passes and cities choose to adopt new rent control policies that include more recently built rentals. In the four largest cities that have current rent control policies in place — Los Angeles, San Francisco, San Jose, and Oakland — Costa-Hawkins limits rent controls to properties built before about 1980 (see Table 1). Across these four cities combined, 14.7% of renter-occupied apartments (198,000 homes) were built between 1980 and 1999, and another 8.5% (115,000 units) were built between 2000 and 2016 according to a Budget Center analysis of US Census data from 2016. If these cities chose to extend rent control to apartments built before 2000, for example, instead of before the year currently allowed by Costa-Hawkins, nearly 200,000 additional apartments could be covered by their rent stabilization policies.
How Could Low- and Moderate-Income Californians Be Helped by Proposition 10?
California’s housing affordability crisis most deeply affects low- and moderate-income households and renters.[13] Allowing local jurisdictions to expand rent control could provide more of California’s current renters with a guarantee of modest, predictable rent increases as long as they remain in the same home, protecting them from large or repeated jumps in rent that may outpace any increase in their incomes. This protection from rapidly rising rents is particularly valuable for lower-income households because wages and earnings for low- and midwage workers have experienced only sluggish growth in recent years, even as the economy overall has been improving.[14] Savings on rent due to rent control vary greatly depending on how local rent control ordinances are structured and how long a tenant has been in the same home, but they can be very large for long-term tenants in jurisdictions with strong control of rents. A study that examined renters in San Francisco from 1995 to 2012, for example, found that renters saved an average of $2,300 to $6,600 per person each year if they lived in a rent-controlled apartment.[15]
Rent control also encourages tenants to remain in the same home longer, both because tenants are less likely to be forced out by unaffordable rent increases and because they are less likely to be able to find equally low rent if they move to a new home. Increased housing stability is generally associated with positive health, social, and educational outcomes, particularly for children.[16] In some cases, rent control can discourage renters from moving to access new jobs or other opportunities or to secure a housing unit that better meets their needs — a less positive outcome — but this reduced mobility may be better understood as renters requiring a higher payoff from moving to compensate for the higher housing costs that would result from moving. At a neighborhood level, fewer moves among tenants translates into greater neighborhood stability, which can also mean a slower rate of gentrification in neighborhoods subject to gentrification pressures.[17][18]
Are There Potential Disadvantages for Low- and Moderate-Income Californians of Allowing an Expansion of Rent Control?
Local rent control policies can create incentives for landlords that have the undesired effect of working against the interests of low- and moderate-income renters. However, these potential negative effects can often be minimized with careful design of local rent controls and by coupling rent control with other local policies:
Capping allowed rent increases can incentivize landlords to neglect maintenance of their rental properties, but local rent control policies can address this issue by allowing landlords to pass through to renters some maintenance and improvement costs. Active local code enforcement can also help ensure that rent-controlled properties continue to meet health and safety standards.
Rent controls that apply to newly built housing, as Prop. 10 would allow cities to pursue, tend to reduce the expected profits from building market-rate rental housing, particularly in areas with rapidly rising rents, and could therefore discourage developers from building as much new rental housing as they otherwise would have. However, local rent control policies can address this problem by choosing to exclude newly constructed rental units from rent control for a period of years long enough to maintain an adequate incentive for developers. For example, newly built market-rate rental units could be exempted from rent control for 15 or 20 years after construction, allowing developers a set period of time in which to recoup their investment costs and collect potentially higher profits before the unit falls under rent control.
Extending rent control to new types of rental housing like single-family homes or more recently built apartments, as cities could choose to do if Prop. 10 passes, would tend to reduce the expected profits from renting out these homes, especially in areas with rapidly increasing rents. In turn, this would create an incentive for landlords with these types of properties to remove them from the rental market, converting them to ownership housing and selling them in order to cash out on the profits generated by a strong housing market. In fact, research shows that owners of rental properties subject to rent control are more likely to convert their properties to ownership housing.[19] Removing units from the rental market harms tenants in two ways: tenants residing in those units may be forced to move, and the reduction in the overall supply of rental housing will tend to intensify competition for vacant units and drive up rents in homes that are not subject to rent control. However, local jurisdictions can strive to minimize this outcome by coupling rent control with other tenant-protection policies. They can allow only “just cause” evictions and require significant compensation for tenants evicted when landlords seek to remove units from the rental market. They can also guarantee affordable legal services for tenants facing eviction to be sure these tenant protections are enforced. They can also restrict the conditions under which apartments can be converted to ownership condominiums, and implement separate policies designed to incentivize more housing development.
Of these potential negative effects of allowing an expansion of rent control, the removal of homes from the rental market may be the most likely to harm low- and moderate-income Californians. This is because a reduction in the overall number of rental units exacerbates the shortage of rental housing, which is a key driver of the rapid increase in market-rate rents, and also because local rent control and tenant-protection policies cannot fully prevent properties from being removed from the rental market. These negative effects would, however, be felt only by a subset of low-income renters: those who are seeking a new rental home or living in units not covered by rent control. They would therefore particularly affect individuals and families entering the local rental market for the first time (e.g., young adults moving out of their parents’ homes, or individuals moving to access job or educational opportunities, including those moving into California from out of state) and renters who are involuntarily forced to move to a new home (e.g., tenants whose homes are converted to ownership housing, or families in financial crisis who are evicted for nonpayment of rent). On the other hand, as noted above, expanding rent control would produce substantial benefits for continuing renters in homes newly subject to rent control who do not need or want to move. These substantial benefits for continuing renters must be weighed against the potential negative impacts for new renters and movers.
An expansion of local rent control policies would also likely reduce state and local government revenues, according to the Legislative Analyst’s Office (LAO), largely because the value of affected rental properties would be expected to drop, leading to lower property tax revenues over time.[20] Low- and moderate-income Californians benefit from the public services and supports funded by local and state revenues, so would be affected by a decline in these revenues. How much revenues decline would depend directly on how many local communities chose to extend rent control to newly allowed types of rental housing and how their rent control policies were designed. The drop in public revenues could range from insignificant to hundreds of millions of dollars annually, according to the LAO. This loss of revenues to support public services should be considered together with the substantial benefits to continuing renters from paying lower and more stable rents over time.
Conclusion: Understanding How Proposition 10 Relates to Other Policies to Address Housing Affordability
An expansion of local rent control policies, as Prop. 10 would allow, would not increase the supply of rental housing, and the shortage of rental housing is a root cause of California’s rapidly rising rents. If anything, as noted above, an expansion of rent control would be likely to encourage some landlords to remove current rental properties from the rental market, contributing to a decrease in the rental housing supply. For that reason, rent control expansion alone would not solve California’s housing affordability crisis. Other policies that are designed to increase the state’s supply of rental housing would also be needed, such as direct state and local investment in building affordable rental housing, financial or regulatory incentives to promote more private development of rental housing (such as inclusionary zoning or density bonuses), and local government accountability to support housing development at levels that meet the demand for rental housing. An expansion of rent control also would not address the needs of all renters, since rent control primarily benefits current renters who do not need or want to move to new homes, and may even disadvantage new renters and those who must or want to move.
However, many California renters are struggling to afford their housing costs now, and rent control is one of the few financially feasible and scalable policy tools available to address the immediate needs of those facing rents in the private market that are rising faster than incomes. Given the scale of the housing affordability crisis in California, policies that address affordability within housing provided by the private market are necessary, since the vast majority of renters will have to live in market-based housing. An expansion of rent control has advantages as a policy option to address private-market rents because it requires limited direct state and local costs and can be implemented and address housing affordability immediately. Local jurisdictions can also design local rent control policies in ways that minimize the potential negative effects of rent control and/or couple them with other policies that protect tenants and incentivize housing development.
Indeed, the design of local policies is central to the expected effects of Prop. 10 on housing affordability in California. If Prop. 10 passes, its effects would directly depend on how cities and other local jurisdictions chose to use their expanded authority to limit rent increases in rental housing at the local level. As a result, passage of Prop. 10 would primarily set the stage for local policymakers and voters to decide whether and how broadly to implement rent control policies within their local jurisdictions.
[8] The cities of Mountain View and Richmond passed rent stabilization measures in November 2016.
[9] The exception would be in cities with rent control policies still on the books from before the passage of Costa-Hawkins that apply to rental housing that is currently exempt from rent control under Costa-Hawkins. For example, the City of Berkeley’s pre-Costa-Hawkins rent control policy included vacancy control, and that portion of the ordinance was never repealed, so it would go back into effect immediately if Prop. 10 passes.
[10] Birkenfeld v. City of Berkeley, California Supreme Court, 17 Cal.3d 129 (1976).
[11] Unless otherwise noted, statistics in this section are from a Budget Center analysis of US Census Bureau, American Community Survey public-use microdata for California from 2015-2016, downloaded from IPUMS-USA (University of Minnesota, www.ipums.org).
[12] In terms of the remaining regions of California, renter households occupying single-family homes represented 48.7% of renters in the Inland Empire, 44.2% in the Sacramento Region, and 43.9% in the Central Coast in 2015-2016.
There was a problem processing your signup. Please try again. Or contact us
Please check your email to confirm your signup.
Proposition 2, which will appear on the November 6, 2018 statewide ballot, would allow California to move forward with a program, called No Place Like Home (NPLH), to finance the development of permanent supportive housing for Californians with mental illness who are homeless or at risk for chronic homelessness. The Legislature and Governor Brown placed Prop. 2 on the ballot because a lawsuit challenging NPLH and the state’s original financing plan has prevented California from implementing this new program. This post provides an overview of Prop. 2, discusses its expected impact, and examines other issues the measure raises in order to help voters reach an informed decision.
What Would Proposition 2 Do?
Prop. 2 asks California voters to approve a housing program — along with related financing — that state policymakers created in 2016, but which has been on hold due to litigation. No Place Like Home (NPLH) aims to develop permanent supportive housing for people with mental illness who are homeless or at risk for chronic homelessness. The state would finance this new housing using proceeds from the sale of up to $2 billion in bonds. These bonds would be repaid over several decades, with interest, using revenues from an existing state tax on California millionaires, which was imposed by Prop. 63 of 2004, the Mental Health Services Act. Currently, most of the proceeds from this tax — a 1% surcharge on taxpayers with annual taxable incomes of more than $1 million — pay for a broad range of mental health services that are provided or coordinated by California’s 58 counties. Voter approval of Prop. 2 would allow the state to use a portion of these Prop. 63 revenues — up to $140 million per year — to pay off the NPLH bond debt, likely over a 30-year period.
What Problem Does the No Place Like Home Program Aim to Address?
Safe and affordable housing is a key building block of health and well-being. Moreover, because housing is rooted in specific neighborhoods — each with its own unique mix of advantages and challenges — where people live helps to determine the opportunities that are available to them. These opportunities, in turn, influence each person’s educational, health, and economic outcomes. As one federal agency aptly puts it, without “a safe, affordable place to live, it is almost impossible to achieve good health or…one’s full potential.”
Unfortunately, California’s worsening housing crisis means that many people lack access to stable housing and find themselves living on the streets. As of January 2017, more than 134,000 residents of the Golden State — including both adults and children — were experiencing homelessness, according to the most recently published point-in-time count. This means that 34 out of every 10,000 Californians lacked a stable home, double the national rate of 17 per 10,000.
What’s more, a large share of people experiencing homelessness also struggle with mental illness. In January 2017, almost 34,700 homeless Californians — just over one-quarter of the total estimated homeless population — were identified as having a severe mental illness. Given the challenges of accurately gauging the true scope of homelessness, some research (here and here, for example) suggests that the actual share of homeless people with severe mental illness may be closer to one-third. Even more troubling: A sizeable share of those who are both homeless and mentally ill (half or more) grapple with drug or alcohol addiction stemming from their efforts to “self-medicate” in order to relieve their symptoms, according to experts.
No Place Like Home aims to assist Californians with mental illness who are homeless or at risk for chronic homelessness by building or rehabilitating permanent supportive housing specifically for this population. Supportive housing “is a highly effective strategy that combines affordable housing with intensive coordinated services to help people struggling with chronic physical and mental health issues maintain stable housing and receive appropriate health care,” according to one review of the literature. In other words, this approach provides affordable, long-term housing linked to wraparound services that can help people address mental health issues and other challenges.
Under NPLH, the state would borrow up to $2 billion and distribute nearly all of these funds to counties to both 1) finance the capital costs and 2) capitalize the operating reserves of permanent supportive housing.* In addition, counties would use other revenue sources — such as their annual Prop. 63 funds — to provide or coordinate services, including mental health and substance abuse treatment, for the tenants of supportive housing developments “for at least 20 years,” as required by the legislation that created NPLH in 2016 (Assembly Bills 1618 and 1628).
What Is the Expected Impact of the No Place Like Home Program?
No Place Like Home could significantly reduce the number of Californians with mental illness who are living on the streets. Assuming voter approval of Prop. 2, the state plans to award $262 million in NPLH funds each year for seven years, beginning at the end of 2018, the Legislative Analyst’s Office (LAO) has reported. This amount of funding could pay for the creation of “roughly 20,000 supportive housing units” over the course of a decade, with “a few thousand units” available by late 2020 or early 2021, the LAO estimates.
However, well over 30,000 Californians with severe mental illness are homeless, as noted above. This means that the projected 20,000 supportive housing units would fall short of the number needed to assist every Californian with severe mental illness who is experiencing homelessness. Therefore, even if voters approve Prop. 2, state and local leaders would still need to adopt additional policies targeting this population to fully address California’s overlapping crises of homelessness and mental illness.
Boosting the supply of permanent supportive housing could also decrease the use of other public systems by homeless residents with mental illness, in turn reducing state and local costs for these systems. For example, savings could come from lowering the number of homeless residents who end up in local jails or emergency rooms, according to a recent review of the research. Moreover, the evidence suggests that “the greatest reductions are likely achieved with supportive housing that focuses on people who are the costliest utilizers of services.”
Case in point: Los Angeles County’s “Housing for Health” (HFH) program. Launched in 2012, HFH uses permanent supportive housing to address the housing and health care needs of homeless residents, targeting “frequent users of health care services,” according to a RAND evaluation. RAND’s key finding: HFH “reduced health care use and county costs.” Even after taking into account the cost of supportive housing, LA County saved $1.20 (from reduced health care and other social service costs) for every $1 invested in the program.
What Are the Tradeoffs in Using Bond Dollars to Build Supportive Housing Through the No Place Like Home Program?
Under No Place Like Home, the state would issue up to $2 billion in bonds, with the proceeds going to build permanent supportive housing for homeless Californians with mental illness. These bonds would be repaid, with interest, from annual revenues that are generated by Prop. 63’s “millionaire’s tax,” which provides funding for mental health services that are delivered or coordinated by counties. As outlined in AB 1628 of 2016, the state would use up to $140 million per year in Prop. 63 revenues to pay the debt service (principal + interest) on the bonds. The most recent state estimate assumes a 30-year debt-service schedule with a 4.2% interest rate, resulting in projected payments of approximately $120 million per year.
By comparison, Prop. 63’s tax on millionaires typically generates over $1 billion per year for mental health services, and the state expects to collect more than $2 billion from the tax in 2018-19, the fiscal year that began on June 30. (Proceeds from this tax fluctuate significantly from year to year.) As a result, a relatively small share of Prop. 63 revenues would be used to pay debt service on the NPLH bonds in any given year. For example, if Prop. 63 generated $1 billion in revenues, the state’s projected payment would equal 12% of these funds ($120 million / $1 billion). If, in another year, Prop. 63 raised $2 billion in revenues, the state’s projected payment would amount to 6% of these funds ($120 million / $2 billion).
Issuing bonds would allow the state to quickly amass a large amount of funding (up to $2 billion) to jump-start the development of permanent supportive housing around the state. Boosting the supply of supportive housing over a relatively short period would allow counties to better focus their resources on an otherwise hard-to-serve population — those with mental illness who are homeless or at risk for chronic homelessness — while potentially achieving improved outcomes for this population through the provision of long-term housing combined with mental health and other supportive services.
However, in selling bonds, California would incur a debt that would have to be repaid with interest. As a result, over time the cost of servicing the debt would far exceed the amount of the borrowed funds. Using the example cited above, debt service on the NPLH bonds could amount to $120 million per year, assuming a 30-year debt-service schedule with a 4.2% interest rate. Over three decades, these payments would total $3.6 billion — much higher than the original $2 billion bond issuance. If the state used the maximum allowable amount of Prop. 63 revenues for NPLH ($140 million per year), then the debt service would total $4.2 billion over 30 years — more than double the amount of the original bond issuance. Moreover, because annual NPLH bond payments would be funded with Prop. 63 revenues — which primarily go to county mental health programs — counties would receive well over $100 million less in Prop. 63 funding each year to meet the mental health needs of their residents.
Yet, Californians who are struggling with mental illness and living on the streets are among the most vulnerable people in the state — a reality that is explicitly recognized in Prop. 63 (see Section 2(d) of the initiative’s “Findings and Declarations”). What’s more, counties have long been responsible for assisting Californians with severe mental illness and collectively receive billions of dollars each year to do so. While counties’ annual mental health funding would be reduced if voters approve Prop. 2, counties could also experience savings in other public systems, such as jails, due to the expansion of supportive housing, as explained above. Counties could use such savings to expand or enhance other local services, including services for residents of supportive housing. Moreover, counties could bolster their support for mental health services by prudently allocating the large amounts of unspent Prop. 63 funds that have been allowed to accumulate at the local level due to what the State Auditor recently called the state’s “ineffective oversight of local mental health agencies.”
What Do Proponents Argue?
Proponents of Prop. 2 include the California Police Chiefs Association, the California State Association of Counties, the League of California Cities, and Mental Health America of California. Proponents argue that Prop. 2 “delivers the proven solution to help the most vulnerable people experiencing homelessness in California” by “build[ing] housing and keep[ing] mental health services in reach for people — the key to alleviating homelessness complicated by mental illness.”
What Do Opponents Argue?
The National Alliance on Mental Illness (NAMI) Contra Costa opposes Prop. 2. NAMI Contra Costa argues that Prop. 2 “takes Billions [of dollars] away from our loved ones and rewards developers, bond-holders, and bureaucrats.” This organization further states that “counties already know where to best acquire housing for access to critical services. Prop. 2 cuts off local input and predetermines the balance between treatment and housing needs.”
Conclusion
Our state’s worsening housing crisis has left more than 130,000 Californians homeless, including tens of thousands of people with severe mental illness. Prop. 2 would take a significant step toward reducing the number of people with mental illness who are living on the streets. It would do so by allowing the state to sell up to $2 billion in bonds and use the proceeds to spur the creation of permanent supportive housing (stable housing linked to services) for this population. These bonds would be repaid over several decades with revenues from an existing state tax on California millionaires that was imposed by Prop. 63 of 2004. Prop. 63 directs most of the funds raised by this “millionaire’s tax” to county mental health programs. If voters approve Prop. 2, up to $140 million per year in Prop. 63 revenues would be used to pay off the new bond debt, leaving less for mental health services.
A key question for voters is whether the benefits of using bond funds to develop up to 20,000 supportive housing units around the state outweigh the potential impact of a relatively small decrease in counties’ annual mental health funding. On the one hand, increasing the supply of supportive housing for homeless residents with mental illness would allow counties to better focus their resources on an otherwise hard-to-serve population while potentially improving outcomes for these individuals. On the other hand, counties would receive less annual Prop. 63 funding to address the mental health needs of their residents.
Two key factors would mitigate the impact of this Prop. 63 funding reduction on local mental health services. First, developing supportive housing for homeless residents with mental illness could decrease the use of other public systems, such as jails, thus reducing state and local costs for these systems. At least some of the resulting savings would accrue to counties, which could shift these freed-up revenues to other services, including mental health treatment. Second, many counties have amassed exceedingly large sums of unspent Prop. 63 funds that could be drawn down over a number of years in order to bolster annual support for mental health services.
* Up to 5% of the total bond funds could be used for state administrative expenses. In addition, up to 4% of the bond funds that would be allocated to counties through NPLH’s “competitive program” could be used to create default reserves.
There was a problem processing your signup. Please try again. Or contact us
Please check your email to confirm your signup.
The share of Californians who are uninsured has fallen by almost 60% in recent years. This astounding decline largely reflects California’s decision to fully implement federal health care reform, including strengthening Medi-Cal (our state’s Medicaid program) so that it reaches more residents who would otherwise lack access to affordable health coverage.
Unfortunately, California’s progress in reducing the uninsured rate nearly ground to a halt in 2017 in the face of fierce headwinds blowing out of Washington, DC. Republican leaders in Congress tried to repeal the Affordable Care Act (ACA) and make deep cuts to federal funding for Medicaid, and President Trump used his executive authority to undermine the ACA in multiple ways.
Will California be in a stronger position next year to push forward new policies aimed at further improving health care access and affordability? The answer will largely depend on whether the ACA and Medicaid remain intact. This, in turn, will hinge on the outcome of the November 6 midterm elections, which will decide whether Republicans retain control of both houses of Congress — and get another shot at rolling back federal health care reform.
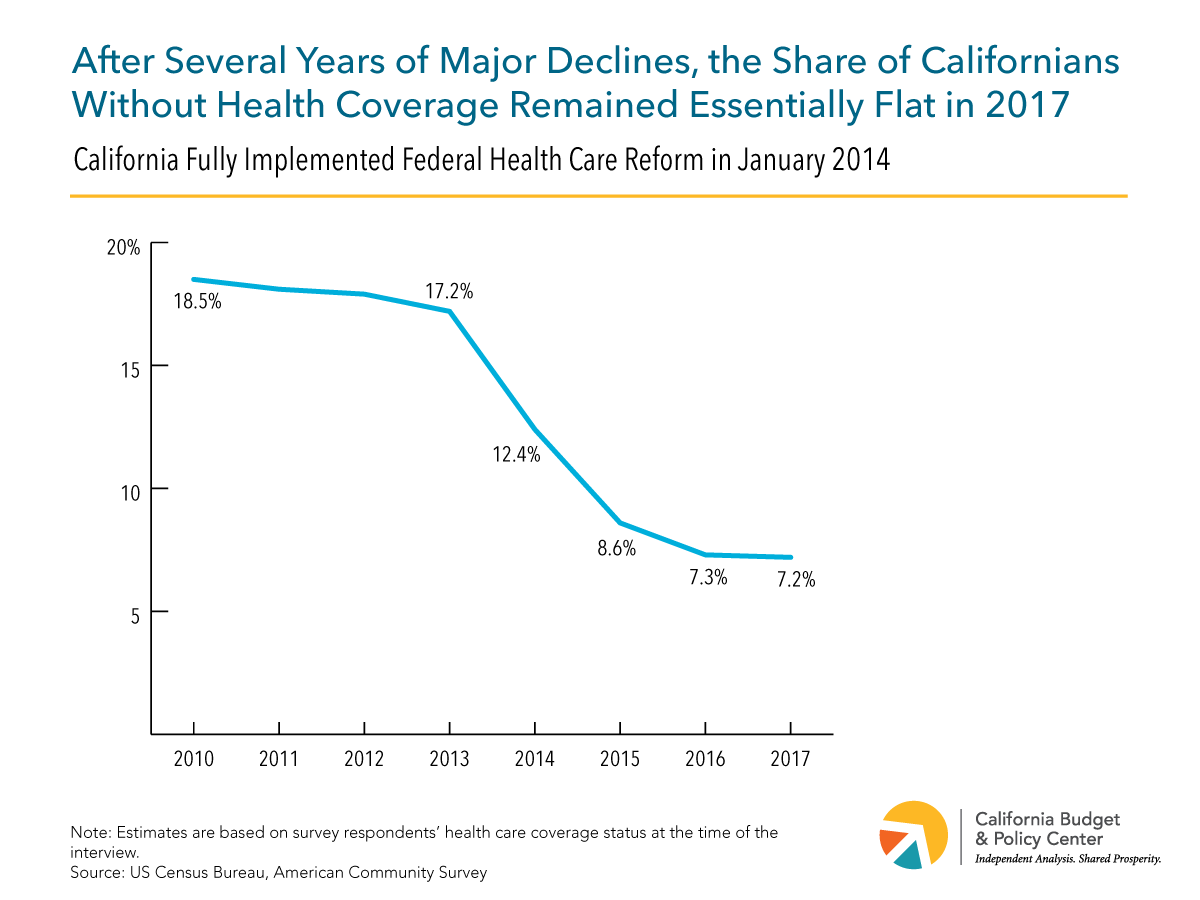
After Several Years of Major Declines, California’s Uninsured Rate Barely Budged in 2017
The share of Californians lacking health coverage in 2017 was 7.2%, down slightly from 7.3% in 2016, according to data released this month by the US Census Bureau.* On the bright side, California was one of only three states that saw a statistically significant drop in their uninsured rates last year. (Louisiana saw a 1.9% year-over-year decline; New York, a 0.4% reduction.) Uninsured rates were statistically unchanged in most other states. Still, the relatively small drop in California’s uninsured rate in 2017 paled in comparison to the major declines of the prior few years. Between 2013 and 2016, the share of Californians without health coverage plunged by nearly 10 percentage points — from 17.2% to 7.3% — the largest drop in the nation during this period.
In some ways, it’s not surprising that the decline in California’s uninsured rate has slowed. The large gains of recent years, particularly in 2014 and 2015, occurred as California rolled out new coverage options for low- and moderate-income Californians through Medi-Cal as well as through Covered California, the state-run online health insurance marketplace. With these new options, the number of uninsured Californians plunged by nearly half between 2013 and 2015, falling from 6.5 million to 3.3 million. This number declined further to 2.8 million in 2016, where it then stayed put (more or less) in 2017. Many Californians who remain uninsured face greater obstacles to enrolling in coverage than those who enrolled in the early years of health care reform. For example, a large share of uninsured Californians are undocumented immigrant adults who, under current policies, cannot sign up for comprehensive Medi-Cal coverage — even if their incomes are low enough to qualify — or buy private insurance through Covered California. Other Californians are eligible for federal financial assistance to help lower the cost of private health insurance, but find that this help is too small to make a difference.
So yes, there were good reasons to expect California’s uninsured rate to begin declining more slowly as the ACA matured. However, the fact that our state’s progress in expanding access to health coverage nearly came to a standstill last year, rather than just slowing down a bit, suggests that something else was going on. Clearly, that “something else” was the turmoil in federal health policy that ensued after Donald Trump — who campaigned on a promise to repeal the Affordable Care Act — took office as President in January 2017.
California Faced Fierce Federal Headwinds in 2017 as Congress and the President Worked to Dismantle the Affordable Care Act and Medicaid
In 2017, Republican leaders in Congress made multiple attempts to repeal the ACA and slash federal funding for Medicaid. These efforts ultimately collapsed. However, the tremendous uncertainty surrounding federal health care policy forced state officials to focus their attention on protecting the ACA and Medicaid — as well as preserving California’s gains under health care reform — rather than on advancing policies to further expand access to health coverage and reduce the cost of health insurance.
Unable to enact a full-scale repeal and deep funding cuts, Republicans found other ways to chip away at the foundation of health care reform. For example, the federal tax legislation passed last December ended the ACA’s financial penalty for being uninsured. This change, which takes effect in 2019, is expected to prompt many healthy consumers “to roll the dice and take the risk of going without health insurance,” according to a recent report from Covered California. In fact, premiums for health plans available through Covered California are already set to rise by an average of 3.5% in 2019 “due to concerns that the removal of the penalty will lead to a less healthy and costlier consumer pool,” state officials have noted.
Moreover, President Trump has used his executive authority to undermine the ACA in multiple ways. These include cutting federal funding for marketing and outreach and shortening the open enrollment in federally run health insurance marketplaces; ending federal payments that reduce out-of-pocket health care costs for consumers with low incomes; promoting unnecessary and counterproductive work requirements in Medicaid; and expanding the availability of limited-benefit health plans (“junk insurance”), which offer skimpier coverage than ACA-compliant plans, lack key consumer protections, and can leave people with expensive uncovered medical bills. California policymakers have generally succeeded in shielding consumers from the impacts of the President’s executive actions. Moreover, Governor Brown recently signed key bills that push back against the President’s agenda, including Senate Bill 910 (Hernandez), which bans the sale of short-term health plans in California.
California Can Further Improve Health Care Access and Affordability in the Coming Years — if the Affordable Care Act and Medicaid Remain Intact
California’s ability to invest in and further improve the state’s health care system over the next couple of years will largely depend on whether the ACA and Medicaid remain intact. The fate of federal health care reform, in turn, will hinge on the outcome of the November elections. If Republicans retain control of Congress, House and Senate leaders, with continued support from President Trump, will renew their efforts to repeal the ACA and gut federal funding for Medicaid. What’s more, a lawsuit aimed at undoing the entire ACA is winding its way through the federal courts and could ultimately be decided by a US Supreme Court majority that is hostile to the health care law.
If Republicans ultimately succeed in their years-long quest to dismantle the ACA and gut federal funding for Medicaid, California’s health care system and state budget would be thrown into disarray. State leaders’ focus would inevitably shift from planning for the future to addressing the fallout from these damaging federal policy choices.
In contrast, if the ACA and Medicaid survive in their current forms, state leaders could advance new policies aimed at continuing to move the state toward universal coverage and making health insurance more affordable, as the Care4All California coalition has been urging the state to do. For example, California could expand coverage options for undocumented immigrant adults by allowing them to enroll in Medi-Cal if they are income-eligible. There’s precedent for such a policy: California uses state funds to provide “full-scope” Medi-Cal coverage to low-income undocumented immigrant children and youth, a policy that took effect in 2016.
In addition, California could boost the affordability of health insurance purchased in the individual market, which continues to be financially out of reach for many residents. One idea: Provide state-funded premium assistance to people who buy health insurance through Covered California. This new state subsidy would be on top of existing federal subsidies, which are available to households with incomes up to 400% of the poverty line — around $48,000 for a single person in 2018. Another option: Reduce the cost of copays and deductibles that people are required to pay when they visit the doctor or fill a prescription. This new state assistance could be targeted to households with moderate incomes — in the range of 200% to 400% of the poverty line — who purchase health plans through Covered California. Households with lower incomes qualify for relatively strong federal assistance to reduce the cost of their copays and deductibles.
Health Care Policy Will Be Back on the State and Federal Agendas in 2019, Whatever the Outcome of the November Elections
As with so many public policy issues, California’s approach to health policy couldn’t be further removed from that of Republicans at the national level. Moving toward universal — and universally affordable — health coverage remains a high priority for many Californians, including a number of state lawmakers and Gavin Newsom, the leading candidate for governor. In contrast, President Trump and his allies in Congress continue to look for ways to repeal the ACA and slash federal funding for Medicaid. Whatever the outcome of the November elections, health care policy will undoubtedly be back on the state and federal agendas — for good or ill — in 2019.
* The changes in the uninsured rate reported in this post are statistically significant at the 90% confidence level. The data come from the American Community Survey (ACS) and reflect one-year estimates. These estimates are based on respondents’ coverage status at the time of the ACS interview and reflect “an annual average of current health insurance coverage status,” according to the US Census Bureau.
Proposition 5, which will appear on the November 6, 2018 statewide ballot, would make significant changes to California’s local property tax system. Local property taxes provide resources that go to support a broad range of local services and systems across our state. Prop. 5 would expand special rules that allow certain property owners to lower their property taxes. The reduced property tax revenue under Prop. 5 over time would result in losses of approximately $1 billion annually for cities, counties, and special districts and similar reductions in state funding available for public services and supports in most years, other than for K-14 education (K-12 schools and community colleges). In addition, Prop. 5 would reduce local funding for some K-14 districts. The ultimate effect of Prop. 5 would be to expand tax breaks for older, wealthier California homeowners at the expense of other homeowners, including those who are younger and less affluent. Prop. 5 is sponsored by the California Association of Realtors and supported by the Howard Jarvis Taxpayers Association. This Issue Brief provides an overview of the measure; discusses what it would mean for homeowners, housing supply and affordability, and funding for public services; and examines other policy issues the measure raises in order to help voters reach an informed decision.
What Would Proposition 5 Do?
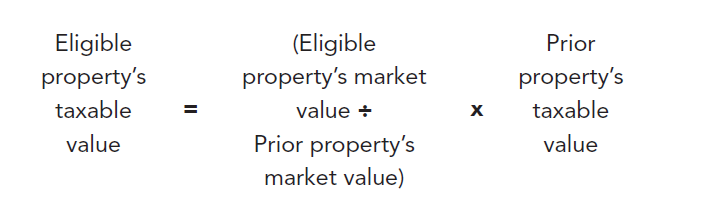
Prop. 5 would amend both the state Constitution and state law to expand special rules for assessing certain property values that are the basis for calculating property taxes. Property taxes support services provided by local governments, such as cities, counties, special districts, and school districts. When local governments levy taxes on property owners, these taxes equal the taxable value of the property multiplied by a property tax rate. Prop. 13, approved by California voters in 1978, capped property tax rates at 1%, with limited exceptions, and replaced the practice of reassessing the taxable value of property each year at fair market value (what the property could sell for) with a system based on cost at acquisition (what the owner paid for the property).[1] Under Prop. 13, increases in the taxable value of property are limited to an annual inflation factor of no more than 2%, and property is only assessed at market value for tax purposes when it changes ownership.
In the 40 years since Prop. 13 passed, California voters have approved several ballot measures that apply special property tax rules (some of which are described in the following section) to certain types of property owners. Beginning on January 1, 2019, Prop. 5 would expand several of these special rules and apply them to:
Homes purchased or constructed by existing California homeowners who are age 55 or older or who are severely disabled.
Any property purchased or constructed to replace property substantially damaged or destroyed by a disaster.[2]
Any property purchased or constructed to replace “qualified contaminated property,” such as property that is no longer habitable or usable due to the presence of toxic or hazardous materials.[3]
Proposition 5 Would Expand Special Rules for Certain Homeowners
Currently, special rules allow California homeowners who are age 55 or older or who are severely disabled to transfer the taxable value of a home they sell to a new home within the same county, provided that the market value of the new home is the same or less than the market value of the home they sold.[4] California counties also may allow older or disabled homeowners to transfer the taxable value of homes sold in a different county to a home purchased in their county. Currently, 11 counties accept these inter-county transfers.[5] Older homeowners who transfer the taxable value of existing property to new homes purchased within or across counties may only do so once in their lifetime.[6] In most cases, these special rules mean that homeowners age 55 or older who purchase a new home pay less in property taxes than a younger person would pay for the same home, because its market value is often greater than the taxable value of the home sold by the older homeowner.
Prop. 5 would expand the special rules for California homeowners who are age 55 or older or who are severely disabled. Specifically, Prop. 5 would allow these homeowners to:
Purchase or construct a new home that is more expensive than the home they sell, but pay property taxes that are tied to the taxable value of the old home.
Purchase or construct a new home that is less expensive than the home they sell and reduce the taxable value of the new home below the taxable value of the old home.
Transfer the taxable property value under Prop. 5’s special rules anywhere in the state, regardless of whether the county where the new home is located currently allows such transfers.
Transfer the taxable property value under Prop. 5’s special rules to new homes an unlimited number of times, rather than just once per lifetime as under current law.
Proposition 5 Would Expand Special Rules for Any Owner of Contaminated Property or Property Destroyed by a Disaster
Under current law, special rules allow any owner of contaminated property or any owner of property that is substantially damaged or destroyed by a disaster to transfer its taxable value to a replacement property — regardless of whether this property is acquired or newly constructed — within the same county based on certain conditions. Owners of contaminated property may transfer its taxable value to a replacement property if the market value of the replacement property is the same or less than the market value of the contaminated property, assuming the property had not been contaminated.[7] Owners of property destroyed by a disaster may transfer its taxable value to a replacement property assuming the replacement property is comparable in size, utility, and function to the property it replaces and does not exceed 120% of the market value of the replaced property in its pre-damaged condition.[8]
Prop. 5 would expand the special rules for owners of contaminated property or property that is substantially damaged or destroyed by a disaster. Specifically, Prop. 5 would allow owners of contaminated property to purchase or build replacement property that is more expensive than the contaminated property, but pay property taxes that are tied to the taxable value of the contaminated property. Prop. 5 also would expand the special rules for owners of property destroyed by a disaster and allow them to transfer the taxable value of the destroyed property to any replacement property regardless of its size or value. Prop. 5 also would allow the assessment of the value of contaminated or destroyed property under its special rules to be transferred anywhere in the state regardless of whether the county where the new property is located allows such transfers from other counties.
Proposition 5 Would Provide Additional Tax Breaks for Eligible Properties
Prop. 5 would establish two formulas to calculate the taxable value of an eligible property. (As previously described, an eligible property is a new home purchased by an older or disabled homeowner or a property that replaces a contaminated property or property destroyed in a disaster.) Both formulas would tie the taxable value of an eligible property to the owner’s prior property.
The property tax formulas established by Prop. 5 would be based on three factors: the prior property’s market value (the price it sold for), the eligible property’s market value (what it was purchased for), and the prior property’s taxable value. One formula would apply when the market value of the eligible property is greater than the prior property, and the other formula would apply when the market value of the eligible property is less than the prior property.
Prop. 5 Would Establish a Formula That Reduces the Taxable Value of an Eligible Property if It Is More Expensive Than the Prior Property
If an eligible property is more expensive than the prior property, the taxable value of the eligible property would equal the difference between the eligible property’s market value and the prior property’s market value, added to the taxable value of the prior property.
Prop. 5 Would Establish a Formula That Reduces the Taxable Value of an Eligible Property Below the Taxable Value of the Prior Property if the Eligible Property Is Less Expensive Than the Prior Property
If an eligible property is less expensive than the prior property, the taxable value of the eligible property would equal the market value of the eligible property divided by the market value of the prior property, multiplied by the taxable value of the prior property.
What Would Proposition 5 Mean for Homeowners?
Proposition 5 Would Expand Tax Advantages for Older Homeowners
Under current law, special rules provide a tax break to California homeowners who are age 55 or older by allowing them to transfer the taxable value of a home they sell to a new home they purchase, but only if the market value of the new home is the same or less than the market value of the home they sold.[9] These rules usually provide a tax advantage for older homeowners, who pay less in property taxes than a younger person would pay for the same home. This is because the market value of the home that is purchased by the older homeowner is often much greater than the taxable value of the home that is sold.
Prop. 5 would expand this annual tax break in two ways. Prop. 5 would:
Increase the annual tax break for older homeowners who purchase homes that are worth the same or less than the market value of the home they sold. Under current law, an older Californian who sells a home that has a taxable value of $200,000 and purchases a new home for $450,000 pays $2,000 in property taxes ($200,000 x 1%) annually as long as the prior home sold for more than $450,000.[10] In comparison, people under the age of 55 would pay $4,500 in property taxes ($450,000 x 1%) annually for the same home. Prop. 5 would establish a new formula that would actually increase this $2,500 annual tax advantage for older homeowners. For example, under the new formula, an older Californian who sells a $500,000 home that has a taxable value of $200,000 and purchases a new home for $450,000 would pay $1,800 in property taxes annually, increasing the tax break under current law by $200 annually (see Figure 1).
Allow older homeowners to purchase a new home that is more expensive than the home they sell and tie the property taxes for the new home to the taxable value of the old home. For example, an older Californian who sells a $1.4 million home with a taxable value of $200,000 and purchases a new home for $1.5 million would only pay $3,000 in property taxes annually, a $12,000 tax advantage compared to someone under the age of 55 who would pay $15,000 in property taxes annually ($1,500,000 x 1%) for the same home (see Figure 2). In other words, in this example, the older homeowner could purchase a home with a value more than seven times larger than the taxable value of the current home, with only a relatively modest increase in property taxes.
The expansion of these tax breaks under Prop. 5 would provide even more substantial benefits to older homeowners who already, under current law, receive preferential treatment that allows them to pay far less in annual property taxes than younger homeowners.
Figure 1
Figure 2
Proposition 5’s Annual Tax Breaks Would Increase as the Market Value of a Prior Home Increases
Whether older homeowners purchase property that is more or less expensive than the market value of their prior home, the tax break provided by Prop. 5 would increase as the market value of the prior property increases. Using the prior example, under Prop. 5 an older Californian who sells a home that has a taxable value of $200,000 and purchases a new home for $450,000 would pay $1,800 in property taxes annually if they sold their prior home for $500,000. However, if the same homeowner sold their prior home for $1.4 million, they would pay less than $650 in property taxes annually (see Figure 1). Similarly, under Prop. 5, an older Californian who sells a $500,000 home with a taxable value of $200,000 and purchases a new home for $1.5 million would pay $12,000 in property taxes annually, whereas if the same homeowner sold their prior home for $1.4 million, they would pay $3,000 in property taxes annually (see Figure 2). As a result, Prop. 5 would most benefit Californians who have seen substantial increases in their home values, such as people from areas of the state where home values have increased rapidly relative to other areas and those who have owned their properties for longer periods of time.
Proposition 5 Would Provide Larger Tax Breaks for Older, Wealthier Californians Who Can Afford More Expensive Homes
The tax breaks Prop. 5 proposes for California homeowners who are age 55 or older would be larger for newly purchased homes that are more expensive than prior homes than they would be for newly purchased homes that are less expensive than prior homes. For example, under Prop. 5 an older Californian who sells a home with a market value of $500,000 and a taxable value of $200,000, and then purchases a new home for $450,000 would receive an annual tax break of $200 compared to current law (see Figure 1). By contrast, the annual tax break would be far larger — $3,000 — if the same Californian purchased a new home for $1.5 million (see Figure 2). As a result, Prop. 5 would provide larger tax breaks to wealthier Californians who are able to afford more expensive homes.
Proposition 5 Disadvantages Younger, Less Wealthy Homeowners
As noted in the sections above, Prop. 5 would expand tax advantages for older homeowners, allowing them to pay less in annual property taxes for a newly purchased home than younger homeowners would pay for the same home. These new tax advantages would be larger for older homeowners whose prior home has experienced the most substantial gains in value prior to being sold. The annual tax advantages would be larger for older, wealthier homeowners able to purchase more expensive homes. Prop. 5 also would remove limits on how many times eligible homeowners can transfer the taxable value of their home. In other words, eligible homeowners could carry forward the tax break to all future home purchases.
Younger, less wealthy homeowners, would also be adversely affected by a potential increase in home prices that could result from Prop. 5.[11] This is because the tax advantage provided to older, wealthier homeowners means that they would have more annual resources at their disposal to use in negotiating the purchase price of new homes. Using the earlier example, an older Californian who sells a $1.4 million home with a taxable value of $200,000 and purchases a new home for $1.5 million would pay only $3,000 in property taxes annually. Someone under the age of 55 would pay $15,000 in property taxes each year — a $12,000 annual tax advantage for the older homeowner. That annual tax advantage would likely be used in negotiating the purchase price of new homes, particularly in highly competitive housing markets, and could result in an increase in housing prices.
Prop. 5 would also reduce local property tax capacity, as noted in the section below on local government implications. As a result, local governments would necessarily rely more heavily upon younger and less wealthy homeowners to pay for local services, including the costs of infrastructure financed through local government general obligation bonds that are also tied to local property values.[12]
Characteristics of Eligible Homeowners Under Proposition 5
Homeowners who would be eligible for the special property tax rules under Prop. 5 include people age 55 or older as well as those with severe disabilities.[13] Of these two major eligible groups, older homeowner households make up by far the largest share. Statewide, about 4.1 million older or disabled homeowner households would be eligible under Prop. 5, of which 4.0 million are age-eligible (97.4%) and roughly 100,000 are eligible due to disability only (2.6%), according to a Budget Center analysis.[14]
In fact, a majority of California’s 7.0 million homeowner households (59.6%) would meet Prop. 5’s eligibility criteria. In a given year, however, only a small fraction of these eligible homeowners would be expected to sell their homes, buy new homes within California, and claim the new property tax reductions that would be allowed under Prop. 5.[15]
Homeowner households that would be eligible for special property tax rules proposed by Prop. 5 are relatively advantaged. Their median household income of $77,000 is 14.9% greater than the overall statewide median household income ($67,000). Moreover, eligible homeowner households headed by someone who is younger than the traditional retirement age — those with household heads under age 65 — have a median household income of nearly $100,000 ($98,900), meaning that about half have annual incomes greater than $100,000. These relatively high incomes translate into relatively low poverty rates, as well. While about 1 in 5 heads of household in California overall (19.0%) are in poverty based on the California Poverty Measure (CPM) — an improved poverty measure that accounts for housing costs — only about 1 in 9 homeowner household heads eligible under Prop. 5 (11.8%) are in poverty under the same measure.[16] In terms of sources of income, about 1 in 7 eligible homeowner households (15.0%) receive more than $15,000 in annual investment income. Moreover, only 11.6% of Prop. 5-eligible households depend on fixed retirement or disability payments from Social Security and/or Supplemental Security Income (SSI) for more than three-quarters of their total household income.
The characteristics of Prop. 5-eligible homeowner households contrast sharply with those of older renter households in California, who are much less economically secure. Renter households headed by individuals age 55 or older have a median income of only $32,900, roughly half the overall statewide median household income. Older renter households also have a much higher poverty rate, with 1 in 3 (33.3%) older renter household heads living in poverty based on the CPM (see Figure 3). They are much more likely to rely on fixed Social Security or SSI payments than Prop. 5-eligible homeowners, with more than 1 in 4 older renter households (27.3%) relying on Social Security and/or SSI for more than three-quarters of their household income, including 43.7% of renters with a head of household age 65 or older.
Figure 3
In terms of race and ethnicity, the homeowners eligible under Prop. 5 are primarily white. Nearly two-thirds (64.0%) of eligible household heads are white (and not Latino). In contrast, less than half of all California households (48.3%) are headed by someone who is non-Latino white, while the majority (51.7%) are headed by a person of color. Older renter households are largely similar to California households overall in terms of race and ethnicity.
The advantaged position of Prop. 5-eligible households is perhaps clearest, however, when examining their wealth in the form of the value of their homes. Most are long-term homeowners who have had the opportunity to accrue significant home equity as California’s housing prices have grown over time. About half of eligible homeowner households have lived in their homes for at least 20 years, during which time the median price of a single-family home in California has increased by 280%, or 1.8 times the rate of inflation, according to a Budget Center analysis of home price data from the California Association of Realtors. More than a quarter of eligible households (26.1%) have lived in their homes for at least 30 years.
In terms of the value of their homes, about half of eligible homeowner households (47.7%) own homes worth a half-million dollars or more. About 1 in 7 (13.9%) own homes worth $1,000,000 or more. Furthermore, nearly 4 in 10 eligible homeowners (38.8%) own their homes free and clear, with no mortgage, so that they stand to receive the full appreciated value of their homes if they sell. The typical home values of eligible homeowners vary by region, but home values are relatively high in the top two regions with the largest number of eligible homeowners: Los Angeles and the South Coast, and the San Francisco Bay Area (see Table 1).
Table 1
Because so many of the homeowners eligible under Prop. 5 have lived in their homes for many years, their property taxes tend to be significantly lower than the property taxes paid by younger homeowners who would not be eligible for special property tax rules under Prop. 5. This is because Prop. 13 (1978) caps the allowed increase in annual property taxes at a rate that is typically lower than the annual increase in a home’s market value, as described above. As a result, in 2016 the older and disabled homeowner households who would be eligible under Prop. 5 paid median property taxes of $2,950, equal to only about three-quarters of the median taxes paid by younger homeowners ($4,050).
In summary, taken as a whole the older and disabled homeowner households who would be eligible for special property tax rules under Prop. 5 have higher incomes and lower poverty rates than California households overall, and much higher incomes and lower poverty rates than older renter households. Prop. 5-eligible households are also more likely to be headed by white individuals and much less likely to be headed by people of color than California households overall. Most are long-term homeowners, and nearly half own homes worth a half-million dollars or more. At the same time, their current typical property tax payments are significantly lower than the typical property taxes paid by younger homeowners, who would not be eligible for the special tax advantages provided by Prop. 5.
Though Prop. 5-eligible homeowners as a group are relatively well-off economically, there are some older and disabled homeowners, and homeowners affected by unexpected disasters, with low fixed incomes who would be unable to pay higher property taxes out of their existing incomes if they moved. As a result, they may feel “stuck in place” in homes that are larger than they need or not as close to family or other supports as they would prefer. However, many of these homeowners could likely take advantage of existing special property tax rules for older and disabled homeowners and find suitable new homes of equal or lesser market value within the county where they currently live, or within one of the counties that allows for inter-county transfer of existing property taxes for older and disabled homeowners under current law (as described above). As a result, they could meet their housing needs without the new tax advantages that would be created by Prop. 5. Moreover, many of these homeowners have built up significant home equity over time, and could reasonably afford to pay higher property taxes by withdrawing some of their equity when selling their homes and using some of those funds each year to cover the cost of higher property taxes for their new homes.
For the small number of older, disabled, and disaster-affected homeowners who are truly “stuck in place” — those with low fixed incomes and limited home equity who cannot find a suitable new home where they can carry over their current property tax amounts within the geographic limits allowed by current law — more narrowly targeted policies could be developed that would help these homeowners specifically. Better targeted policy approaches, such as tax credits for homeowners who meet specific income and asset limits as well as criteria related to age, disability, and/or disaster, would allow for more efficient use of limited public resources, and would be preferable to Prop. 5, which offers tax breaks to many homeowners who do not need public financial assistance, at the expense of local and state government budgets and the key services they support. Alternatively, if the policy goal is to address the housing needs of older Californians with low or fixed incomes, focusing on older renter households would make much more sense than focusing on older homeowners, since older California renters, as a group, face much greater economic insecurity.
How Would Proposition 5 Affect Housing Mobility, Supply, and Affordability?
Many parts of California face a range of housing affordability challenges, including a lack of supply to meet the demand for housing, higher housing prices resulting from increased competition for available housing, and a lack of housing mobility because people are less able to afford changing homes and/or are unable to find available housing. How would extending tax breaks to older homeowners affect these forces?
As noted earlier, Prop. 5 could lead to an increase in home prices. [17] The annual tax advantage for older homeowners would likely be used in negotiating the purchase price of new homes. Because Prop. 5 changes existing law to allow older homeowners to base their property tax bill for a more expensive newly purchased home on their prior home, the effect on home prices might be particularly notable for already higher-priced markets. In addition, as noted earlier, the tax advantages from Prop. 5 will largely accrue to wealthier, older homeowners who can already afford to move.
In terms of housing supply and mobility, the Legislative Analyst’s Office (LAO) projects that the number of potential movers as a result of Prop. 5 could increase by “a few tens of thousands” and that there could be some effect on home building.[18] But, the potential impact would be small relative to the total number of homeowners in California and the demand for housing. California has 7 million homeowner households and the state Department of Housing and Community Development estimates that California needs 1.8 million new homes to meet demand by 2025.[19] If some increase in home building results from increased demand from Prop. 5-eligible homeowners, this additional supply would simply be meeting a corresponding increase in demand that is also due to Prop. 5 — in other words, Prop. 5 would do little to address the state’s current shortage of housing. In short, Prop. 5’s effects on housing supply and mobility would be marginal, and largely accrue to a set of homeowners in California who can already afford to move.
What Would Proposition 5 Mean for Public Services?
Proposition 5 Would Reduce Funding for Local Governments
Prop. 5 would reduce funding for local governments including cities, counties, and school districts. This is because the measure would reduce the taxes paid from people who would have moved anyway. The LAO notes that, at current, about 85,000 homeowners who are 55 and older move to different homes each year without receiving the tax break provided by Prop. 5, resulting in these homeowners paying higher property taxes.[20] Prop. 5 would reduce their property taxes and, therefore, reduce property tax revenue available to local governments. Prop. 5’s tax break would result in more people moving, with the number of movers increasing by “a few tens of thousands,” and could also have some effect on home prices and home building that would lead to more property tax revenue.[21] Since Prop. 5 would increase home sales it would also affect local property transfer taxes collected by cities and counties, likely in the tens of millions of dollars per year. The LAO analysis finds that the potential revenue losses from people who would have moved anyway are larger than the gains from higher home prices and home building. As a result, property tax revenues available to local governments would be reduced. In the first few years, the losses would be over $100 million per year for local governments and over $100 million per year for school districts, growing to approximately $1 billion annually for both over time.[22]
Reductions in local property tax revenue caused by Prop. 5 would decrease the amount of funding available for an array of local government services including schools, police, fire services, housing, infrastructure, and human services. The reduction in local property tax revenues would also lower local governments’ bonding capacity — the ability to issue bonds to finance local infrastructure projects.
What Would Proposition 5 Mean for Total K-14 Education Funding?
Prop. 5 would reduce the amount of annual property tax revenue available to K-12 school and community college districts by about $1 billion over time, according to the LAO.[23] In most years, however, the total amount of dollars provided to K-14 education statewide would not be affected by this reduction in local property tax revenue, due to provisions in California’s Constitution — added by Prop. 98 in 1988 — that guarantee K-14 education a minimum level of funding each year.
Under the Prop. 98 guarantee, two revenue sources together fulfill the state’s funding requirement for K-14 education: local property tax revenue and state General Fund dollars.[24] In most years, property tax revenue represents the first dollars applied toward meeting the Prop. 98 minimum guarantee, and the state’s General Fund fills the gap between the property tax revenue and the minimum funding level.[25] In such years, reductions to local property taxes under Prop. 5 would not affect the total amount of K-14 education funding statewide. This is because any reduction in property taxes would be offset by a corresponding increase in the amount of state General Fund dollars used to fulfill the Prop. 98 guarantee. In these years, the fiscal effects of extending property tax advantages to older homeowners under Prop. 5 would come at the expense of other vital state services that are supported with state General Fund dollars.
In certain other years, however, total K-14 education funding declines dollar for dollar with any reduction in property tax revenue. In these years, an alternative provision of Prop. 98 (known as “Test 1”) requires the state to provide K-12 schools and community colleges with a specific percentage of total General Fund revenue regardless of the amount of local property taxes that K-14 districts receive.[26] As a result, to the extent that Prop. 5 reduces local property tax revenue in Test 1 years, the total Prop. 98 funding level for K-14 education would fall because the state would not be required to spend General Fund dollars to make up the difference. Moreover, any reduction to local property tax revenue in a Test 1 year could affect calculations of the Prop. 98 guarantee in future years because the base for calculating the guarantee in most years is the prior-year Prop. 98 funding level.
Proposition 5 Would Reduce Funding for Some K-12 School and Community College Districts
While Prop. 5 would reduce local property taxes for K-14 education statewide, total annual revenue for most individual districts would not change. This is due to the difference between formulas in the state Constitution that determine the annual Prop. 98 funding guarantee for K-14 education and other formulas in state law that determine the amount of dollars allocated to individual K-12 school and community college districts. Annual revenue for a large majority of the state’s individual K-14 districts comes from a combination of sources that include local property taxes and the state budget. For these districts, reductions in local property taxes are backfilled by the state.[27] As a result, most California K-14 districts would not experience a change in their total revenue if Prop. 5 reduces the amount they receive from local property taxes.
In contrast, reductions in local property taxes under Prop. 5 would decrease funding for a small but significant share of K-12 and community college districts. Roughly 10% of California’s K-14 districts receive local property tax revenue beyond the amount of funding to which they are entitled based on formulas in state law.[28] The state does not backfill reductions in local property tax revenue for these so-called “excess tax” districts.[29] As a result, any decline in local property taxes caused by Prop. 5 would mean a dollar-for-dollar reduction in funding for K-12 school and community college “excess tax” districts.
What Would Proposition 5 Mean for the State Budget?
Prop. 5 would increase state spending to support K-14 education and, in turn, reduce the amount of General Fund dollars available for other state budget priorities. Over time, the LAO estimates that the measure would cause annual state spending for K-14 districts to increase by about $1 billion, though without raising the total amount of funds available to schools and community colleges.[30] This is because, as described above, Prop. 5 would reduce the amount of property tax revenue received by K-14 districts, which in most years would require the state General Fund to backfill the local property tax shortfall dollar-for-dollar up to the total funding level required by the Prop. 98 funding guarantee.[31] In these years, reductions in local property tax revenue caused by Prop. 5 would reduce funding available for programs other than K-14 education, such as health care, housing, human services, and higher education.
What Do Proponents Argue?
Proponents of Prop. 5, which is sponsored by the California Association of Realtors, include the Howard Jarvis Taxpayers Association, Californians for Disability Rights, Inc., and the California Senior Advocates League. Proponents argue that the measure “gives all seniors (55+) and severely disabled the right to move without penalty” and “empowers retirees living on fixed incomes.”[32] They state that “Prop. 5 helps Californians who want the opportunity to move,” “does not take funding away from public schools,” and “does not take funding away from public safety.”[33]
What Do Opponents Argue?
Opponents of Prop. 5 include the California State Association of Counties, Middle Class Taxpayers Association, National Housing Law Project, California Alliance for Retired Americans, and the League of Women Voters of California. Opponents argue that Prop. 5 will “further raise the cost of housing,” and “lead to hundreds of millions of dollars and potentially $1 billion in local revenue losses” and that it “gives a huge tax break to wealthy Californians.”[34] Opponents state that “Prop. 5 does nothing to help most low-income seniors but does help corporate real estate interests who are funding it.”[35]
Conclusion
Prop. 5 would make changes to California’s local property tax system by significantly expanding tax breaks for certain property owners. These tax breaks would provide advantages to older, wealthier homeowners at the expense of younger, less affluent homeowners and would do little to address the state’s current housing shortage. Voters should weigh Prop. 5’s tax breaks against annual revenue losses that would reduce funding available for local services and state programs. Prop. 5 would reduce annual funding for local governments by $1 billion over time, dollars that would no longer be available to support an array of local services including schools, police, fire services, housing, infrastructure, and human services. Another important consideration is the measure’s impact on the state budget. Prop. 5 in most years would reduce funding available to the state by $1 billion over time for key programs such as health care, housing, human services, and higher education.
[2] A property is considered substantially damaged or destroyed if the physical damage it sustains is more than 50% of its value immediately before the disaster. California Constitution, Article XIIIA, Section 2(f)(1).
[5] The 11 counties that allow inter-county transfers are Alameda, El Dorado, Los Angeles, Orange, Riverside, San Bernardino, San Diego, San Mateo, Santa Clara, Tuolumne, and Ventura. However, El Dorado County repealed its acceptance of inter-county transfers effective November 7, 2018.
[6] SB 1692 (Petris, Chapter 897 of 1996) created one exception to this one-time limit by allowing homeowners age 55 or older who transfer the taxable value of existing property to a new home to do so twice in a lifetime if they subsequently become disabled.
[7] California counties also may allow owners of contaminated property to transfer their taxable value from another county to a property that is acquired or newly constructed in their county.
[8] Property owners can still transfer the assessed value of a damaged or destroyed property to a replacement property that is greater than 120% of the market value of the destroyed property, but any amount over the 120% threshold is assessed at the full market value and added to the taxable value of the destroyed property.
[9] As noted above, these rules apply to homes purchased in the same county and in 11 California counties that allow older homeowners to transfer the taxable value of homes sold in a different county to a home purchased in their county.
[10] The taxable value of property typically increases each year based on an inflation adjustment that Prop. 13 limits to no more than 2% annually. This Issue Brief does not include annual inflation adjustments in calculations of annual property taxes in order to simplify the discussion.
[11] Legislative Analyst’s Office, “Proposition 5. Changes Requirements for Certain Property Owners to Transfer Their Property Tax Base to Replacement Property. Initiative Constitutional Amendment and Statute. Analysis by the Legislative Analyst,” in Secretary of State’s Office, California General Election Tuesday November 6, 2018: Official Voter Information Guide, p. 37.
[13] As noted earlier, owners of property that has been substantially damaged or destroyed by disaster or contamination would also be eligible for the special property tax rules under Prop. 5. However, these owners would likely make up a very small share of the total number of eligible property owners. For example, the 2017 Tubbs Fire in Napa and Sonoma counties — the most destructive in California history as of August 2018 — destroyed 5,636 structures, a tiny number compared to the 4.0 million households estimated to be eligible under Prop. 5 due to the age of the homeowner.
[14] Unless otherwise indicated, all statistics in this section are from a Budget Center analysis of US Census Bureau, American Community Survey data for 2016.
[15] The Legislative Analyst’s Office (LAO) notes that about 85,000 homeowners age 55 or older currently move to different homes each year without receiving a tax break, and estimates that the number moving might increase by “a few tens of thousands” if Prop. 5 were to pass. See Legislative Analyst’s Office, “Proposition 5. Changes Requirements for Certain Property Owners to Transfer Their Property Tax Base to Replacement Property. Initiative Constitutional Amendment and Statute. Analysis by the Legislative Analyst,” in Secretary of State’s Office, California General Election Tuesday November 6, 2018: Official Voter Information Guide, pp. 36-37.
[16] The California Poverty Measure (CPM) is a state-specific measure of poverty modeled on the US Census Bureau’s Supplemental Poverty Measure. The CPM provides a more accurate measure of economic hardship than the official federal poverty measure and is particularly appropriate to measure poverty for this analysis, because it accounts for local differences in the cost of housing and differences in housing costs across renters, homeowners with mortgages, and homeowners without mortgages, among other improvements. See https://inequality.stanford.edu/publications/research-reports/california-poverty-measure.
[17] Legislative Analyst’s Office, “Proposition 5. Changes Requirements for Certain Property Owners to Transfer Their Property Tax Base to Replacement Property. Initiative Constitutional Amendment and Statute. Analysis by the Legislative Analyst,” in Secretary of State’s Office, California General Election Tuesday November 6, 2018: Official Voter Information Guide, p. 37.
[18] Legislative Analyst’s Office, “Proposition 5. Changes Requirements for Certain Property Owners to Transfer Their Property Tax Base to Replacement Property. Initiative Constitutional Amendment and Statute. Analysis by the Legislative Analyst,” in Secretary of State’s Office, California General Election Tuesday November 6, 2018: Official Voter Information Guide, p. 37.
[20] Legislative Analyst’s Office, “Proposition 5. Changes Requirements for Certain Property Owners to Transfer Their Property Tax Base to Replacement Property. Initiative Constitutional Amendment and Statute. Analysis by the Legislative Analyst,” in Secretary of State’s Office, California General Election Tuesday November 6, 2018: Official Voter Information Guide, p. 36.
[21] Legislative Analyst’s Office, “Proposition 5. Changes Requirements for Certain Property Owners to Transfer Their Property Tax Base to Replacement Property. Initiative Constitutional Amendment and Statute. Analysis by the Legislative Analyst,” in Secretary of State’s Office, California General Election Tuesday November 6, 2018: Official Voter Information Guide, p. 37.
[22] The LAO’s long-term estimates reflect inflation-adjusted figures. Legislative Analyst’s Office, “Proposition 5. Changes Requirements for Certain Property Owners to Transfer Their Property Tax Base to Replacement Property. Initiative Constitutional Amendment and Statute. Analysis by the Legislative Analyst,” in Secretary of State’s Office, California General Election Tuesday November 6, 2018: Official Voter Information Guide, p. 36.
[23] The LAO’s estimate reflects annual property tax losses adjusted for inflation. See Legislative Analyst’s Office, “Proposition 5. Changes Requirements for Certain Property Owners to Transfer Their Property Tax Base to Replacement Property. Initiative Constitutional Amendment and Statute. Analysis by the Legislative Analyst,” in Secretary of State’s Office, California General Election Tuesday November 6, 2018: Official Voter Information Guide, p. 37.
[24] Prop. 98 states that K-14 education is guaranteed an annual funding level that is the greater of a fixed percentage of state General Fund revenues (Test 1) or the amount that K-12 schools and community colleges received in the prior year, adjusted for enrollment and changes in the state’s economy (Test 2 and Test 3). For an explanation of the Prop. 98 guarantee, see California Budget & Policy Center, School Finance in California and the Proposition 98 Guarantee(April 2006).
[25] In Test 2 and Test 3 years, the state is required to provide General Fund dollars equal to the funding level guaranteed under Prop. 98 less local property tax revenue provided to K-12 schools and community colleges.
[26] Test 1 has been operative five times since the Prop. 98 guarantee was established in 1988-89 and ties the minimum funding level for K-14 education to a percentage of General Fund revenue, which has ranged from 35% to 41%. For a description of the history of Prop. 98, see Legislative Analyst’s Office, A Historical Review of Proposition 98 (January 2017).
[27] Under current formulas in state law, reductions in local property taxes for individual K-14 districts are backfilled by the state even in Prop. 98 Test 1 years when reductions in overall statewide local property tax revenue cause the Prop. 98 guarantee to fall.
[28] In 2017-18, so-called “excess tax” districts, excluding county offices of education, comprised 10.6% of K-12 school districts and 9.7% of community college districts.
[29] Similarly, any boost to the amount of property taxes that “excess tax” districts receive results in a dollar-for-dollar increase in their total funding.
[30] The LAO’s estimate reflects annual state spending for K-14 education adjusted for inflation. See Legislative Analyst’s Office, “Proposition 5. Changes Requirements for Certain Property Owners to Transfer Their Property Tax Base to Replacement Property. Initiative Constitutional Amendment and Statute. Analysis by the Legislative Analyst,” in Secretary of State’s Office, California General Election Tuesday November 6, 2018: Official Voter Information Guide, p. 37.
[31] As noted above, in Prop. 98 Test 2 and Test 3 years the state is required to provide General Fund dollars equal to the funding level guaranteed under Prop. 98 less local property tax revenue provided to K-12 schools and community colleges.
Proposition 6, which will appear on the November 6, 2018 statewide ballot, would eliminate taxes and fees that California enacted in 2017 to fund transportation infrastructure and also would amend the state Constitution to require voter approval of any future fuel and vehicle-related tax and fee increases. Eliminating the new revenues enacted in 2017 would result in the loss of $5.1 billion annually for transportation infrastructure. Requiring voters to approve increases in fuel and vehicle-related taxes and fees would make it more difficult to fund transportation improvements. Moreover, any future increases in transportation funding could come at the expense of other vital public systems and supports, such as education, public safety, and health and human services. Prop. 6 qualified for the ballot with key support from members of California’s Republican congressional delegation; Republican gubernatorial candidate John Cox; and Carl DeMaio, chairman of Reform California. This Issue Brief provides an overview of the measure, discusses what it would mean for transportation and other public services, and examines other policy issues the measure raises in order to help voters reach an informed decision.
What Would Proposition 6 Do?
Prop. 6 would 1) eliminate transportation funding approved by the Legislature and Governor Brown as part of the Road Repair and Accountability Act of 2017 (also known as Senate Bill 1, or SB 1) and 2) amend the California Constitution to require the Legislature to submit any measure enacting taxes or fees on gas or diesel fuel, or related to the operation of a vehicle on public highways, to voters for approval.[1] Specifically, Prop. 6 would:
Eliminate recently enacted funding for roads, highways, and public transportation. Prop. 6 would reduce funding for highway and road maintenance/repair and transit programs by more than $5 billion annually by eliminating the fuel and vehicle-related taxes and fees established by SB 1.[2]
Require the Legislature to obtain voter approval of fuel and vehicle-related taxes. Prop. 6 would amend the California Constitution to require the Legislature to obtain voter approval of new or increased taxes on the sale, storage, use, or consumption of gasoline or diesel fuel, as well as for taxes paid for the privilege of operating a vehicle on public highways. The Legislative Analyst’s Office (LAO) notes that requiring voter approval would make it more difficult to enact fuel and vehicle-related taxes, potentially resulting in less revenue for transportation purposes in the future. The amount by which revenues would be reduced is unknown, as it would depend upon future actions of the Legislature and voters.[3]
What Did Last Year’s Transportation Package (SB 1) Do?
Governor Brown and the Legislature enacted SB 1, the Road Repair and Accountability Act of 2017, in April 2017, allocating more than $5 billion per year for transportation infrastructure improvements.[4] This transportation package provides funding for highway and road maintenance and rehabilitation, public transit, and projects to improve conditions for pedestrians and bicyclists as well as to facilitate the movement of goods. The revenue comes from both higher fuel taxes and new vehicle-related fees, with a key component being the increase to the state’s base excise tax on gasoline (the “gas tax”).[5] Prior to being raised in 2017, this tax had been frozen since 1994, with the result that revenues from the gas tax were unable to keep up with demands for transportation improvements.
In total, SB 1 seeks to address billions of dollars in deferred maintenance by restoring the purchasing power of the gas tax and boosting other fuel taxes and vehicle-related fees. The transportation package is projected to generate:
$2.5 billion per year from increased state taxes on gasoline, primarily from a 12-cent per gallon increase in the state’s base gas tax, which took effect on November 1, 2017.
$1 billion per year from a 20-cent increase in the state’s excise tax on diesel fuel and a 4 percentage point increase in the diesel fuel sales tax, both of which took effect on November 1, 2017.
$1.7 billion per year from a new annual transportation improvement fee, which took effect on January 1, 2018. This fee ranges from $25 to $175 per vehicle based on the value of the vehicle. For instance, a vehicle valued at less than $5,000 would incur a fee of $25, while a vehicle valued at $60,000 or more would incur a $175 fee.
$19 million per year from a new annual fee of $100 on all zero-emission vehicles starting on July 1, 2020.
These taxes and fees will be annually adjusted for inflation to prevent them from losing value over time. The transportation improvement fee will be adjusted starting on January 1, 2020; the gas and diesel fuel excise taxes will be adjusted starting on July 1, 2020; and the zero-emission vehicle fee will be adjusted starting on January 1, 2021.
SB 1’s initial allocations are already reflected in the state budget. For example, in its first (partial) year of implementation, the state budget for 2017-18 (the fiscal year that ended on June 30, 2018) allocated over $2.8 billion for SB 1 transportation improvements, with half going to state projects and half to local projects. The 2018-19 state budget allocates $4.6 billion for SB 1 transportation improvements, with half going to state projects and half to local projects.[6] By 2020, when all of SB 1’s taxes and fees are fully in effect and the inflation adjustments begin, the state expects the annual allocation to be $5.1 billion, split evenly between state and local projects.
The revenues raised by SB 1 support a variety of state highway, local road, transit, and other transportation improvements. Annual funding is allocated as follows:[7]
$1.9 billion per year for state highway and bridge repairs.
$1.8 billion per year for local road repairs.
$750 million per year for public transit and intercity rail.
$310 million per year to improve trade corridors.
$250 million per year to reduce congestion on major commute corridors.
$100 million per year for bicycle and pedestrian projects to better link travelers to transit facilities.
$170 million per year for a range of smaller programs, including freeway service patrols, local planning grants, university transportation research, and parks and agricultural programs.
What Would Passage of Proposition 6 Mean for Transportation and Other Public Services?
If California voters approve Prop. 6, the implications for public services would include:
Reduced funding for road, highway, and transit improvements. In the current state fiscal year (2018-19), Prop. 6 would eliminate $2.4 billion in transportation funding. By 2020-21, Prop. 6 would mean a reduction of $5.1 billion annually in funding for road and transit improvements.[8]
Decreased ability to raise state revenues for transportation infrastructure in the future. Prop. 6 would require the Legislature to obtain voter approval for all future increases in fuel and vehicle-related taxes and fees. While the actual revenue impact of this provision would depend on future legislative actions and the will of California voters, requiring voter approval would undoubtedly make it harder to raise revenues for transportation infrastructure.[9]
Increased pressure on state and local budgets to finance future public transportation improvements. The combination of reducing state funds for transportation infrastructure and making it more difficult to raise revenues for transportation projects in the future would put the state, as well as local governments, under increasing pressure to fund future transportation investments from their general funds, from which they must also pay for an array of other vital public systems and supports. Demands for transportation investments would, as a result, compete with needed investments in education, public safety, housing, and health and human services.
Reduced ability to keep up with critical public transportation needs in the future and reduced safety levels. The increased difficulty of raising dedicated state revenues for transportation, coupled with competition for state and local general fund support, would make it harder for state and local governments to keep up with the demand for transportation improvements in the future. California’s state and local governments already confront a large backlog of deferred maintenance (see more on this topic in the next section). The costs of maintenance and repairs rise the longer they are deferred due to increasing decay and the likelihood that facilities may need to be fully replaced. Putting off maintenance and repairs also increases the safety risk of the state’s transportation facilities — roads, highways, bridges, and transit facilities.
Fewer jobs and slower economic growth. Reduced transportation funding would mean fewer jobs and less economic activity in communities across California. The state estimates that there are more than 4,000 local transportation projects already receiving SB 1 funding, including projects in every county in the state. Those projects generate jobs and economic activity. For instance, the White House Council of Economic Advisors has estimated that every $1 billion in highway and transit investment supports 13,000 jobs.
Does California Need Additional Funding for Transportation?
California has a vast state and local transportation infrastructure that encompasses a state highway system with 50,000 lane-miles, 300,000 miles of locally owned roads, 25,000 bridges (13,000 state, 12,000 local), and 200 local transit agencies that operate bus, light rail, and subway systems.[10] The California Department of Finance notes that “[e]fficient operation of this vast network is vital to the state’s continued economic growth and also serves much of the country, with nearly 20 percent of the goods imported to the United States moving through California ports, highways, and railways. Bottlenecks in the state’s trade corridors constrain economic growth and reduce quality of life when Californians spend hundreds of hours in traffic.”[11]
Approximately $35 billion is spent each year on transportation in California, including $16 billion from local sources, $12 billion from state sources, and $7 billion from federal sources.[12] Local sources come from local sales taxes (which are closely restricted by state law), transit fares, and local government general funds that must also fund other vital programs and services such as public safety, housing, and health and human services. Federal funding primarily comes from federal fuel taxes, including the federal excise tax on gasoline. The federal gas tax is not automatically adjusted for inflation each year to account for the rising costs of goods and services. This means that Congress and the President must agree to raise the federal gas tax rate. However, federal policymakers have not increased this rate since 1993, leaving the federal Highway Trust Fund (the primary source of federal funding for state and local transportation) unable to keep pace with demands for new facilities or for maintaining and repairing existing highways, roads, bridges, and other facilities.[13]
State transportation funding primarily comes from fuel taxes and vehicle-related fees. Until the passage of SB 1, California had not increased its gas tax rate since 1994, leaving the state unable to keep up with demands for transportation improvements.[14] As a result, California has faced a significant deficit in transportation funding to pay for infrastructure improvements and deferred maintenance — a deficit that has been exacerbated by inadequate federal funding. In its 2017 “Infrastructure Report Card” assessing the state of the nation’s infrastructure, the American Society of Civil Engineers estimated that 50% of California’s public roads are in poor condition, that 5.5% (1,388) of the state’s bridges are structurally deficient, and that Californians pay $844 per driver annually for the costs of driving on poorly maintained roads.[15] As recently as the 2016-17 state budget, Governor Brown’s Administration estimated that California confronts $57 billion in total deferred maintenance needs related to transportation.[16]
The SB 1 transportation package aims to address the state’s transportation infrastructure needs by providing more than $5 billion in additional annual funding. As noted above, about half of this funding comes from the increase to the state’s base gas tax rate, which had been frozen since 1994. If the 1994 rate ($0.18 per gallon) had been adjusted each year to account for changes in the cost of living, it would have risen to $0.32 per gallon by 2018 — slightly higher than the current rate of $0.30 per gallon established by SB 1 (see chart below). In other words, SB 1 nearly restores the purchasing power of the gas tax to fund transportation improvements. Moreover, by annually adjusting all of the fuel and vehicle-related taxes and fees for inflation, SB 1 ensures that the state’s sources of funding for transportation infrastructure will be better able to keep up with future needs.
Is the Gas Tax a Fair Tax?
Whenever increases in the gas tax are considered, questions are raised about the fairness of the tax. There are different ways to assess the fairness of taxes, but most people agree that a fair tax system asks taxpayers to contribute to the cost of public services based on their ability to pay. When lower-income households spend a larger share of their budgets on taxes, such as for transportation, than do higher-income households, those taxes are considered to be regressive. Conversely, taxes that impose a relatively greater cost on higher-income households are considered to be progressive.[17] In this respect, gas taxes are often thought to be regressive because all households pay the same rate regardless of their income.
However, it is important to put the gas tax in the broader context of overall funding for the transportation package. State leaders structured the transportation improvement fee on vehicles — another key piece of the package’s revenue mix — so that it is based more on people’s ability to pay, with the fee increasing relative to the value of the vehicle.
Moreover, the critique that the gas tax has a greater impact on low-income households would be more concerning if this tax were chosen over other, more progressive ways of funding these improvements. The reality is that transportation funding in California, and nationally, as outlined above, primarily relies on a set of usage-based excise taxes and fees — taxes and fees that households and businesses pay to use highways, roads, transit facilities, ports, airports, and so on. While usage-based taxes and fees may be mostly regressive, they can be considered fair, to a degree, in that they are paid as the cost of using the service. Even alternative transportation funding options — toll roads and fees based on vehicle miles traveled, for instance — raise revenues based on people’s use of highways and roads, and not with regard to users’ incomes. Another potential alternative, the carbon tax — a tax imposed on the burning of carbon-based fuels such as coal, oil, and gas — would still generate revenues based on the demand for, and use of, those fuels.
Another option would be to fund transportation improvements from the state’s General Fund, or through general obligation (GO) bonds where the service on the debt is paid out of the General Fund, because most state General Fund revenues come from California’s progressive income tax. However, as noted above, relying on the state General Fund would put transportation investments in competition with other vital public systems and supports for limited state funding.
Usage-based taxes and fees also make sense as a source of transportation funding because they can be structured in ways that meet other policy goals. For instance, because driving creates emissions that harm the environment, taxes and fees can be designed to encourage transit use and alternative forms of transportation.
Concerns about how particular taxes affect lower-income individuals can be addressed by providing offsets. For instance, California could expand its state Earned Income Tax Credit (the CalEITC) — a refundable credit for low-income working Californians — as a means of offsetting increased gas costs.[18] The Institute for Taxation and Economic Policy recommends that states modernize their gas taxes by increasing gas tax rates to reverse long-term declines (relative to inflation), structuring gas taxes so that their rates keep up with rising costs, and creating or enhancing tax credits, like the EITC, for low-income families to offset the impact of gas tax increases.[19]
Are SB 1 Revenues Required to Be Spent on Transportation Improvements?
One of the questions raised about the SB 1 transportation package is whether the funds are assured to go toward transportation improvements. In fact, SB 1 dedicates approximately two-thirds of its revenues to highway and road repairs and the remainder to other transportation improvements, such as public transit, according to the LAO.[20] In addition, the SB 1 transportation funding package included a set of accountability provisions designed to ensure that the revenues are spent as intended.[21] Among these was a constitutional amendment on the June 2018 statewide ballot (Prop. 69, approved by 4 in 5 voters) that prevents SB 1 funds from being used for anything other than specified transportation purposes.[22]
What Do Proponents Argue?
Proponents of Prop. 6, including Republican gubernatorial candidate John Cox, the Howard Jarvis Taxpayers Association, and the National Federation of Independent Business, argue that the measure would “immediately lower the price” of gasoline and that much of the funds from state fuel and vehicle-related taxes and fees are “used for programs other than streets, roads and highways.”[23]
What Do Opponents Argue?
Opponents of Prop. 6, including the League of California Cities, the California State Association of Counties, associations representing first responders and public safety personnel, and the California Chamber of Commerce, argue that Prop. 6 “eliminates funding for more than 6,500 road safety and transportation improvement projects,” “threatens public safety,” and “eliminates thousands of jobs and hurts our economy.”[24]
Conclusion
Prop. 6 would eliminate recently enacted funding for transportation infrastructure by repealing certain fuel and vehicle-related taxes and fees. The measure would also amend the state Constitution to require the Legislature to obtain voter approval of any future increases in fuel and vehicle-related taxes and fees. The fiscal impact of Prop. 6 would be to eliminate $5.1 billion in annual revenues used to fund highway and road maintenance and repairs, transit, and other transportation programs. Requiring voters to approve future fuel and vehicle-related taxes and fees would make it more difficult to fund transportation infrastructure improvements in the future.
Prop. 6 presents California voters with a choice as to whether they are willing to support continued investments in California’s transportation infrastructure. Approving Prop. 6 would undo recent increases in fuel and vehicle-related taxes and fees and significantly decrease funding available for transportation infrastructure. Rejecting Prop. 6 would allow California to continue to invest in highways, roads, bridges, transit, and other transportation improvements.
Endnotes
[1] Secretary of State’s Office, California General Election Tuesday November 6, 2018: Text of Proposed Laws, downloaded from https://vig.cdn.sos.ca.gov/2018/general/pdf/topl.pdf on August 21, 2018. See also Legislative Analyst’s Office, “Proposition 6: Eliminates Certain Road Repair and Transportation Funding. Requires Certain Fuel Taxes and Vehicle Fees Be Approved by the Electorate. Initiative Constitutional Amendment. Analysis by the Legislative Analyst,” in Secretary of State’s Office, California General Election Tuesday November 6, 2018: Official Voter Information Guide, p. 40.
[2] Legislative Analyst’s Office, “Proposition 6: Eliminates Certain Road Repair and Transportation Funding. Requires Certain Fuel Taxes and Vehicle Fees Be Approved by the Electorate. Initiative Constitutional Amendment. Analysis by the Legislative Analyst,” in Secretary of State’s Office, California General Election Tuesday November 6, 2018: Official Voter Information Guide, p. 41.
[3] Legislative Analyst’s Office, “Proposition 6: Eliminates Certain Road Repair and Transportation Funding. Requires Certain Fuel Taxes and Vehicle Fees Be Approved by the Electorate. Initiative Constitutional Amendment. Analysis by the Legislative Analyst,” in Secretary of State’s Office, California General Election Tuesday November 6, 2018: Official Voter Information Guide, p. 41.
[5] In addition to the “base” excise tax, the state has a separate excise tax on gasoline known as the “swap” excise tax. For a description of the swap excise tax, see Legislative Analyst’s Office, Overview of the 2017 Transportation Funding Package (June 2017), pp. 2-3.
[8] Legislative Analyst’s Office, “Proposition 6: Eliminates Certain Road Repair and Transportation Funding. Requires Certain Fuel Taxes and Vehicle Fees Be Approved by the Electorate. Initiative Constitutional Amendment. Analysis by the Legislative Analyst,” in Secretary of State’s Office, California General Election Tuesday November 6, 2018: Official Voter Information Guide, p. 41.
[9] Legislative Analyst’s Office, “Proposition 6: Eliminates Certain Road Repair and Transportation Funding. Requires Certain Fuel Taxes and Vehicle Fees Be Approved by the Electorate. Initiative Constitutional Amendment. Analysis by the Legislative Analyst,” in Secretary of State’s Office, California General Election Tuesday November 6, 2018: Official Voter Information Guide, p. 41.
[12] For a discussion of transportation infrastructure funding in California see Legislative Analyst’s Office, “Proposition 6: Eliminates Certain Road Repair and Transportation Funding. Requires Certain Fuel Taxes and Vehicle Fees Be Approved by the Electorate. Initiative Constitutional Amendment. Analysis by the Legislative Analyst,” in Secretary of State’s Office, California General Election Tuesday November 6, 2018: Official Voter Information Guide, p. 40.
[17] For a discussion of California’s tax system, including state and local sales taxes and other sources of revenue, see Jean Ross, Alissa Anderson, and Samar Lichtenstein, Principles and Policy: A Guide to California’s Tax System (California Budget & Policy Center: April 2013).
[20] Legislative Analyst’s Office, “Proposition 6: Eliminates Certain Road Repair and Transportation Funding. Requires Certain Fuel Taxes and Vehicle Fees Be Approved by the Electorate. Initiative Constitutional Amendment. Analysis by the Legislative Analyst,” in Secretary of State’s Office, California General Election Tuesday November 6, 2018: Official Voter Information Guide, pp. 40-41.
[22] Proposition 69 was approved on June 5, 2018 (81% yes, 19% no). See Secretary of State’s Office, Statewide Direct Primary Election – Statement of the Vote, June 5, 2018: State Ballot Measures (Propositions 68-72) by County, downloaded from https://elections.cdn.sos.ca.gov/sov/2018-primary/sov/132-ballot-measures.pdf on August 22, 2018.
There was a problem processing your signup. Please try again. Or contact us
Please check your email to confirm your signup.
This website uses cookies to analyze site traffic and to allow users to complete forms on the site. The California Budget & Policy Center does not share, trade, sell, or otherwise disclose personal information. By using our website you agree to our Privacy Policy.