Skip to content

More than 2.3 million California TK-12 public school students bring a linguistic asset with them to school every day: living in homes where a language other than English is spoken. A majority of these students (1.2 million) demonstrate English proficiency during their school years. But, students’ home language skills are often neglected at school due to California’s shortage of bilingual education teachers. Neglecting students’ language assets means they may not become biliterate, causing them to miss out on numerous advantages biliteracy provides such as cognitive benefits and increased competitiveness once students enter the workplace.

To help students achieve biliteracy, California must address its shortage of adequately trained bilingual education teachers. The magnitude of this shortage can be assessed by looking at the number of teachers who have been authorized to teach bilingually in recent years, which pales in comparison to the number of TK-12 students who live in homes where languages other than English are spoken. Specifically, a large imbalance exists between 1) the number of students who live in homes where one of the top 10 languages is spoken and 2) teachers who earned an authorization to teach in those languages from 2012-13 to 2021-22 (See Table).

The bilingual teacher shortage is a significant obstacle for California students to achieve biliteracy. One step the Legislature can take to address this shortage is reinstating the Bilingual Teacher Professional Development Program (BTPDP), which expired in June 2021. Last year, the California Department of Education reported the BTPDP “was very successful and helped address a critical teacher shortage area that is in high demand.” The Legislature should fund the BTPDP and build on its success, especially to help the millions of California TK-12 students with home language assets achieve biliteracy.

Demand for TK-12 Bilingual Education Teachers Outstrips Supply in California

LanguageStudents from Homes Where a Language Other Than English Is SpokenBilingual Authorizations Issued from 2012-13 Through 2021-22Student-to-Bilingual Authorization Ratio
Spanish 1,802,4207,518239.7
Vietnamese68,150302,271.7
Mandarin 67,712436155.3
Cantonese42,08161689.9
Filipino38,45357,690.6
Arabic32,944112,994.9
Korean29,675133223.1
Punjabi22,690211,345.0
Russian21,30737,102.3
Farsi18,55029,275.0

*Note: A bilingual authorization authorizes teachers to deliver instruction in languages other than English and does not include teaching intern credentials, permits, and waivers.

Source: California Department of Education and California Commission on Teacher Credentialing


Support for this report was provided by the Sobrato Family Foundation and the Stuart Foundation.

Stay in the know.

Join our email list!

All Californians should be able to afford food, yet many struggle to meet this basic need. CalFresh, or SNAP as it’s known federally, provides around 5 million Californians with low incomes monthly benefits to purchase food. Since the beginning of the COVID-19 pandemic, CalFresh benefits were increased with emergency allotments (EA) of federal funds. In January alone, over $521 million additional dollars went out across California to CalFresh recipients. For reference, the total CalFresh issuance was about $1.36 billion in the same month. Emergency allotments accounted for nearly 40% of that amount.

Increased safety net supports, in particular EA, played an important role in reducing child poverty across California in recent years. However, this additional funding came to an end in March, which reduced families’ monthly CalFresh assistance by at least $95, and up to $258 in some cases, amid rising food prices. Already, 1 in 4 families nationwide are reporting increased levels of food insufficiency, according to recent Census data. This figure is on par with states that ended their participation in the EA program before the benefits expired federally. The loss of these additional food benefits is expected to undermine the recent decline in child poverty. With the federal Farm Bill up for reauthorization this year, federal policymakers should  improve benefit adequacy in order to keep up the progress made in recent years. In addition, state leaders should take steps to raise the CalFresh monthly benefits and broaden eligibility to currently excluded Californians to avoid pushing millions of families over the hunger cliff.

Millions of Californians Receiving CalFresh Benefited from Emergency Allotments, January 2023

Congressional DistrictRepresentativePartyEstimated Average Number of Participants, 2022*CalFresh Participants as a Share of the District  PopulationEstimated EA CalFresh Benefits in January 2023**Rank (Highest to Lowest EA Benefit)
CaliforniaN/AN/A4,896,00012.5%$521,115,000N/A
1Doug LaMalfaRepublican119,00015.5%$13,865,0005
2Jared HuffmanDemocratic76,0009.9%$8,949,00034
3Kevin KileyRepublican49,0006.3%$6,716,00048
4Mike ThompsonDemocratic66,0008.7%$8,074,00037
5Tom McClintockRepublican82,00010.6%$11,274,00025
6Ami BeraDemocratic116,00015.4%$11,492,00022
7Doris MatsuiDemocratic117,00015.4%$11,276,00024
8John GaramendiDemocratic89,00011.9%$7,090,00045
9Josh HarderDemocratic107,00013.9%$11,352,00023
10Mark DeSaulnierDemocratic37,0004.9%$6,234,00049
11Nancy PelosiDemocratic80,00011.3%$10,288,00027
12Barbara LeeDemocratic92,00012.5%$7,499,00041
13John DuarteRepublican146,00018.7%$14,458,0004
14Eric SwalwellDemocratic50,0006.7%$7,507,00040
15Kevin MullinDemocratic42,0005.7%$4,404,00052
16Anna EshooDemocratic33,0004.5%$4,755,00051
17Ro KhannaDemocratic35,0004.7%$5,374,00050
18Zoe LofgrenDemocratic89,00012.2%$6,794,00047
19Jimmy PanettaDemocratic50,0006.5%$7,012,00046
20Kevin McCarthyRepublican116,00015.1%$16,011,0003
21Jim CostaDemocratic199,00026.3%$16,958,0001
22David G. ValadaoRepublican188,00023.6%$16,318,0002
23Jay ObernolteRepublican150,00019.7%$11,905,0007
24Salud CarbajalDemocratic69,0009.1%$8,378,00036
25Raul RuizDemocratic149,00019.4%$12,351,0006
26Julia BrownleyDemocratic61,0008.1%$7,273,00042
27Mike GarciaRepublican117,00015.6%$11,639,0009
28Judy ChuDemocratic66,0008.9%$11,613,00011
29Tony CárdenasDemocratic121,00016.4%$11,593,00017
30Adam SchiffDemocratic101,00013.9%$11,608,00012
31Grace NapolitanoDemocratic100,00013.6%$11,593,00017
32Brad ShermanDemocratic69,0009.1%$11,595,00016
33Pete AguilarDemocratic126,00016.5%$11,724,0008
34Jimmy GomezDemocratic137,00018.2%$11,608,00012
35Norma TorresDemocratic95,00012.3%$11,635,00010
36Ted LieuDemocratic44,0006.0%$11,608,00012
37Sydney KamlagerDemocratic165,00021.9%$11,562,00020
38Linda SánchezDemocratic81,00010.9%$11,239,00026
39Mark TakanoDemocratic99,00013.0%$9,561,00029
40Young KimRepublican37,0004.9%$7,562,00039
41Ken CalvertRepublican71,0009.0%$9,629,00028
42Robert GarciaDemocratic121,00016.3%$11,593,00017
43Maxine WatersDemocratic166,00022.5%$11,562,00020
44Nanette BarragánDemocratic116,00015.4%$11,608,00012
45Michelle SteelRepublican84,00011.2%$7,665,00038
46Lou CorreaDemocratic103,00013.6%$7,171,00044
47Katie PorterDemocratic40,0005.3%$7,186,00043
48Darrell IssaRepublican68,0009.1%$9,244,00030
49Mike LevinDemocratic40,0005.3%$8,469,00035
50Scott PetersDemocratic51,0006.8%$9,077,00032
51Sara JacobsDemocratic87,00011.4%$9,065,00033
52Juan VargasDemocratic125,00016.5%$9,101,00031

* Figures are rounded to the nearest 100. Estimates do not sum to total due to rounding and excluded zip code data.

** Figures are rounded to the nearest 1,000. Estimates do not sum to total due to rounding and excluded zip code data.

Note: Values for California reflect the actual number of CalFresh participants from January to December 2022 and the total value of SNAP Emergency Allotment spent in January 2023. District-level estimates are based on zip code-level data for CalFresh recipients in December 2022. About 1% of zip code-level data are excluded due to hidden totals for de-identification purposes and special classifications of zip codes. Therefore, participation for some congressional districts may be underestimated. Data are for individuals receiving federal SNAP benefits and do not reflect individuals receiving state-funded assistance through the California Food Assistance Program.

Source: California Budget & Policy Center analysis of data from the Department of Social Services and US Census Bureau, American Community Survey

Stay in the know.

Join our email list!

The Supplemental Nutrition Assistance Program (SNAP) — known as CalFresh in California — is the largest federal food assistance program for families with low incomes. On average, nearly 5 million Californians received CalFresh benefits each month in 2022. While CalFresh participation varied across the state, around one-quarter of the population in three congressional districts depended on this program to put food on their tables.

CalFresh has been instrumental in recent years in combating poverty and feeding families as the effects of the COVID-19 pandemic continue to be felt throughout the state. This year, the program is due for reauthorization at the federal level, with the Farm Bill set to expire in September. With much of the COVID-19 pandemic relief ending or being rolled back, including SNAP emergency allotments and Pandemic EBT, many CalFresh recipients will see their benefits decrease.1See report by the Center on Budget and Policy Priorities for additional information on temporary pandemic-related SNAP benefits. Food insecurity across California may be exacerbated without this additional support that many families have come to rely on. Federal and state leaders should protect and strengthen CalFresh.

Almost 5 Million Californians Benefited from CalFresh Every Month in 2022

Congressional DistrictRepresentativePartyEstimated Average Number of Participants, 2022*CalFresh Participants as a Share of the District  PopulationRank (Highest to Lowest Percentage)Estimated Annual CalFresh Benefits**
California4,896,00012.5%N/A$14,167,234,000
1Doug LaMalfaRepublican119,00015.5%14$343,478,000
2Jared HuffmanDemocratic76,0009.9%33$219,919,000
3Kevin KileyRepublican49,0006.3%44$140,823,000
4Mike ThompsonDemocratic66,0008.7%39$190,732,000
5Tom McClintockRepublican82,00010.6%32$236,896,000
6Ami BeraDemocratic116,00015.4%17$336,949,000
7Doris MatsuiDemocratic117,00015.4%16$338,716,000
8John GaramendiDemocratic89,00011.9%27$257,694,000
9Josh HarderDemocratic107,00013.9%19$310,064,000
10Mark DeSaulnierDemocratic37,0004.9%50$107,334,000
11Nancy PelosiDemocratic80,00011.3%29$230,125,000
12Barbara LeeDemocratic92,00012.5%24$266,687,000
13John DuarteRepublican146,00018.7%7$423,842,000
14Eric SwalwellDemocratic50,0006.7%42$145,099,000
15Kevin MullinDemocratic42,0005.7%46$122,618,000
16Anna EshooDemocratic33,0004.5%52$96,740,000
17Ro KhannaDemocratic35,0004.7%51$100,676,000
18Zoe LofgrenDemocratic89,00012.2%26$258,159,000
19Jimmy PanettaDemocratic50,0006.5%43$144,907,000
20Kevin McCarthyRepublican116,00015.1%18$334,899,000
21Jim CostaDemocratic199,00026.3%1$575,427,000
22David G. ValadaoRepublican188,00023.6%2$543,496,000
23Jay ObernolteRepublican150,00019.7%5$434,598,000
24Salud CarbajalDemocratic69,0009.1%34$201,017,000
25Raul RuizDemocratic149,00019.4%6$430,416,000
26Julia BrownleyDemocratic61,0008.1%40$176,388,000
27Mike GarciaRepublican117,00015.6%13$338,138,000
28Judy ChuDemocratic66,0008.9%38$190,214,000
29Tony CárdenasDemocratic121,00016.4%11$351,133,000
30Adam SchiffDemocratic101,00013.9%20$293,270,000
31Grace NapolitanoDemocratic100,00013.6%22$290,362,000
32Brad ShermanDemocratic69,0009.1%36$200,042,000
33Pete AguilarDemocratic126,00016.5%9$363,765,000
34Jimmy GomezDemocratic137,00018.2%8$395,248,000
35Norma TorresDemocratic95,00012.3%25$276,276,000
36Ted LieuDemocratic44,0006.0%45$126,011,000
37Sydney KamlagerDemocratic165,00021.9%4$476,158,000
38Linda SánchezDemocratic81,00010.9%31$234,789,000
39Mark TakanoDemocratic99,00013.0%23$287,857,000
40Young KimRepublican37,0004.9%49$106,302,000
41Ken CalvertRepublican71,0009.0%37$204,736,000
42Robert GarciaDemocratic121,00016.3%12$349,609,000
43Maxine WatersDemocratic166,00022.5%3$479,267,000
44Nanette BarragánDemocratic116,00015.4%15$336,596,000
45Michelle SteelRepublican84,00011.2%30$242,049,000
46Lou CorreaDemocratic103,00013.6%21$299,049,000
47Katie PorterDemocratic40,0005.3%48$115,231,000
48Darrell IssaRepublican68,0009.1%35$197,230,000
49Mike LevinDemocratic40,0005.3%47$116,891,000
50Scott PetersDemocratic51,0006.8%41$147,559,000
51Sara JacobsDemocratic87,00011.4%28$252,617,000
52Juan VargasDemocratic125,00016.5%10$361,732,000

* Figures are rounded to the nearest 100. Estimates do not sum to total due to rounding and excluded zip code data.
** Figures are rounded to the nearest 1,000. Estimates do not sum to total due to rounding and excluded zip code data.

Note: Values for California reflect the actual number of CalFresh participants and the total value of CalFresh benefits for January through December. District-level estimates are based on zip code-level data for CalFresh recipients in December 2022. About 1% of zip code-level data are excluded due to hidden totals for de-identification purposes and special classifications of zip codes. Therefore, participation for some congressional districts may be underestimated. Data are for individuals receiving federal SNAP benefits and do not reflect individuals receiving state-funded assistance through the California Food Assistance Program.

Source: California Budget & Policy Center analysis of data from the Department of Social Services and US Census Bureau, American Community Survey

A map showing the estimated CalFresh participation in California in 2022 where the CalFresh program helps feed families in every congressional district.
A map showing the estimated CalFresh participation in the Los Angeles region in 2022 where the CalFresh program helps feed families in every congressional district.

Stay in the know.

Join our email list!

All California children deserve to grow up in a state that provides their basic needs. CalWORKs is a key part of the California safety net designed to provide families with low incomes financial support to meet their basic needs. However, state policies that reinforce counterproductive federal work requirements limit families’ access to this program. These policies include penalizing CalWORKs parents who are not meeting program requirements by imposing unnecessarily harsh sanctions that reduce their monthly grants.

A bar chart showing the monthly CalWORKs grant for a single-parent family with two children in 2023 where CalWORKs sanctions push about 60,000 children per month deeper into poverty.

On average, the families of 60,000 children are affected by sanctions each month.1Based on Budget Center analysis of Department of Social Services data for August 2022, the most recent month with available statewide data. For typical CalWORKs single-parent families, sanctions can cut monthly grants by about $120, and a single-parent family with two children can lose up to a maximum of $235 each month. If the family’s grant is reduced by sanctions for an entire year, they can lose up to $2,820 annually — or about one-fifth of the total income they would otherwise receive from CalWORKs to pay for their basic needs.

Research shows that sanctioned recipients are often those who face the most barriers to employment and do not fully understand the sanctions process due to limited education, learning disabilities, or mental health problems.2Rachel Kirzner, TANF Sanctions: Their Impact on Earnings, Employment, and Health (Center for Hunger-Free Communities, Drexel University, March 23, 2015). As California moves to reimagine the CalWORKs program to better support participants, building on recent state reforms including CalWORKs 2.0 and Cal-OAR, and reconsidering the penalty pass-on structure related to the Work Participation Rate (WPR), it must also consider the negative impact of sanctions on families. California should strive to lift families up through its safety net programs by offering support and can take steps to minimize the amount or length of sanctions to reduce harm to families.

Stay in the know.

Join our email list!

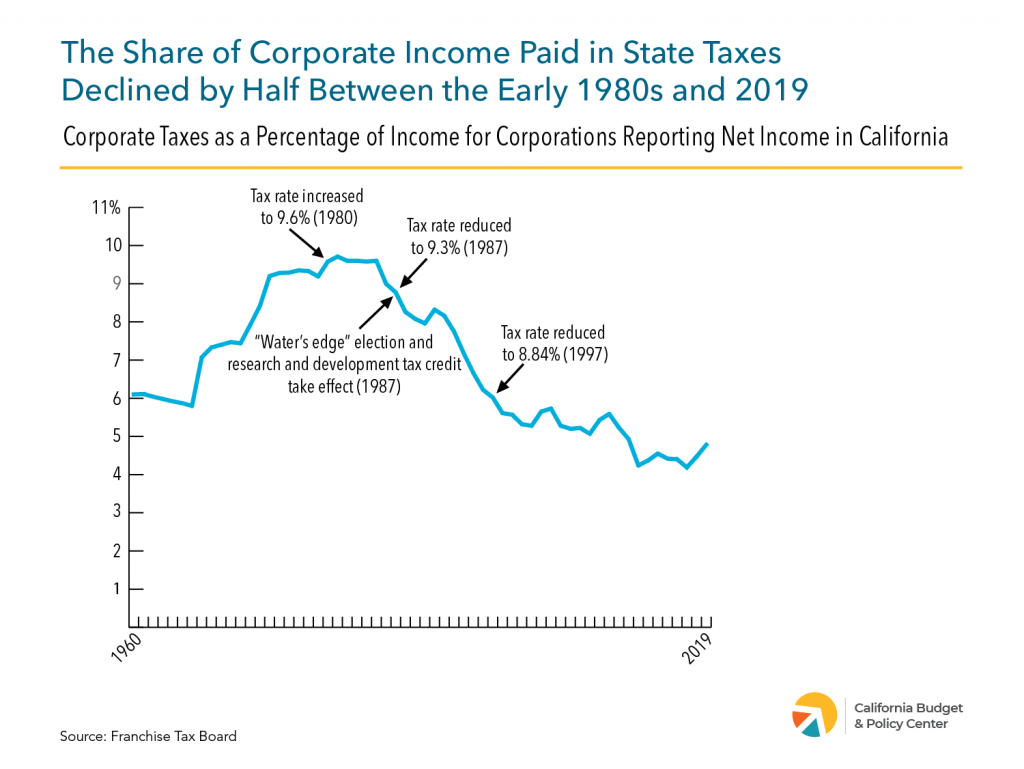
Calling California home means sharing in the responsibility of creating strong communities. Yet, corporations are contributing roughly half as much of their California profits in state taxes than four decades ago. In the early 1980s, corporations that reported profits in California paid more than 9.5% of this income in state corporation taxes. In contrast, corporations paid just 4.8% of their California profits in corporation taxes in 2019, the most recent year data are available. California’s budget would have received $14 billion more revenue in 2019 had corporations paid the same share of their income in taxes that year as they did in 1981 — more than the state spends on the University of California, the California State University, and student aid combined.

Corporations pay less of their income in taxes today than the 1980s in part due to tax rate reductions by state policymakers. The Legislature has cut the corporate tax rate twice: from 9.6% to 9.3% in 1987 and from 9.3% to 8.84%, its current level, in 1997.

In addition to cutting tax rates, state policymakers have enacted several tax breaks that reduce the share of corporate income paid in California corporation taxes. In the 1980s, policymakers established the “water’s edge” election and the research and development (R&D) tax credit — the state’s two largest corporate tax breaks that account for $6.1 billion of the $7.8 billion the state is projected to spend on corporate tax expenditures in 2021-22.

California’s tax break spending for corporations far exceeds tax benefits for Californians with low incomes. In tax year 2020, California spent $1.3 billion on the state’s two largest tax credits targeted to Californians with low incomes — the California Earned Income Tax Credit (CalEITC) and the Young Child Tax Credit (YCTC).1Reflects credits from tax returns processed by the Franchise Tax Board through November 27, 2021. The CalEITC and YCTC benefited 6.6 million Californians in tax year 2020 by boosting the incomes of those with annual earnings of less than $30,000, a large majority of whom are people of color.2The 6.6 million Californians figure reflects the total number of tax filers, spouses, and dependents in 4.2 million “tax units.” Yet, most people get less than $200 from the CalEITC, far too little to help people earning low wages and living in poverty. Policymakers can make tax credits more equitable by providing a larger minimum CalEITC for eligible workers and pay for it by eliminating or reducing tax breaks for corporations that can afford to contribute more to support California communities.

  • 1
    Reflects credits from tax returns processed by the Franchise Tax Board through November 27, 2021. ↩︎
  • 2
    The 6.6 million Californians figure reflects the total number of tax filers, spouses, and dependents in 4.2 million “tax units.” ↩︎

Stay in the know.

Join our email list!

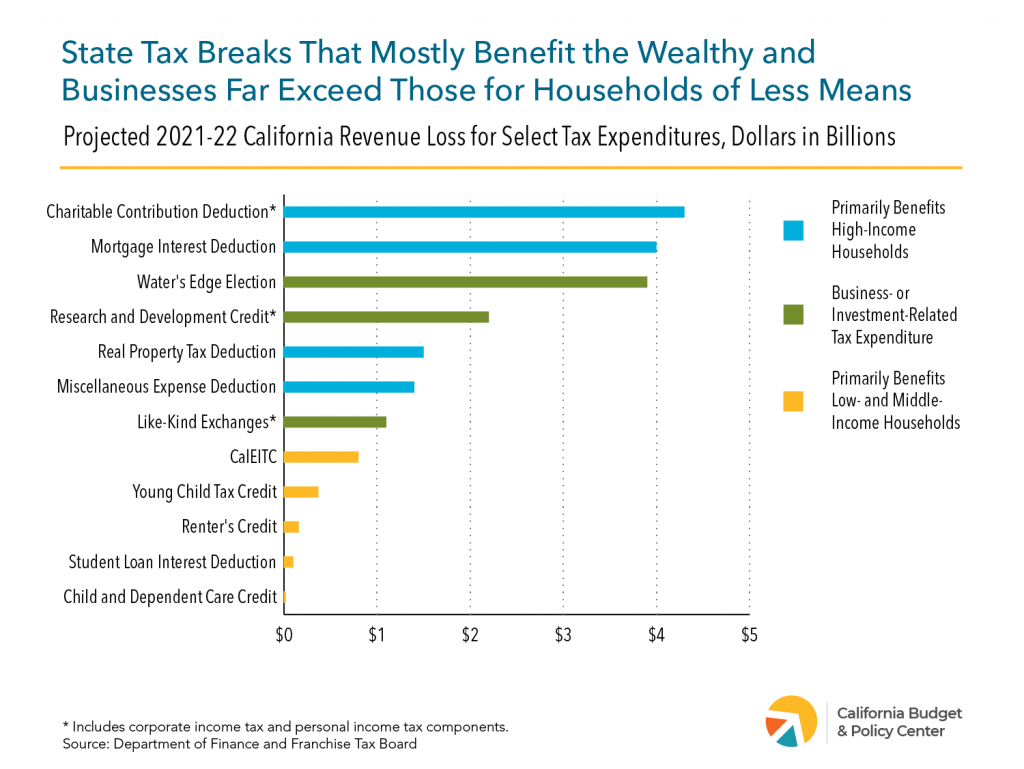
California will lose an estimated $69.2 billion in state General Fund revenues in 2021-22 to personal and corporate income tax breaks — or “tax expenditures.”1Department of Finance, Tax Expenditure Report 2021-22, 5, https://www.dof.ca.gov/Forecasting/Economics/Tax_Expenditure_ Reports/documents/2021-22%20Tax%20Expenditure%20Report.pdf. Many of the state’s largest tax breaks primarily benefit higher-income households and businesses, while just a fraction of the state’s tax breaks are targeted to Californians with low and middle incomes.2For a more detailed examination of California’s tax expenditures, see Kayla Kitson, Tax Breaks: California’s $60 Billion Loss (California Budget & Policy Center, January 2020), https://calbudgetcenter.org/resources/tax-breaks-californias-60-billion-loss/. This revenue loss equals approximately one-third of the state’s 2021-22 General Fund budget and represents dollars the state could otherwise use to support Californians to live, work, and thrive across the state.

The state will forgo more than $18 billion in revenue due to just four itemized deductions that mostly benefit higher-income households and three tax incentives for businesses and investors. In comparison, California will spend less than $1.5 billion on tax breaks that primarily benefit low- and middle-income households, including the California Earned Income Tax Credit (CalEITC), the Young Child Tax Credit, the Renter’s Credit, the Student Loan Interest Deduction, and the Child and Dependent Care Credit.

more in this series

See our 5Facts: California’s Tax & Revenue System Isn’t Fair for All to learn how elements of California’s tax and revenue system further or impede the goals of economic and racial equity for households, communities, and the state.

Some of California’s tax expenditures also widen racial income and wealth disparities. Since Black and Latinx households are underrepresented in higher-income groups due to legacies of racist policies and ongoing discrimination, these households benefit less than white households from tax breaks skewed toward richer households. Additionally, many tax breaks reward wealth-building activities such as homeownership and retirement savings, to which households of color have less access.

When policymakers choose to spend public dollars via tax expenditures that largely benefit wealthy Californians and businesses, they are also choosing not to spend those dollars to help individuals and families who struggle with the costs of housing, child care, education, and other necessities. Eliminating or scaling back these tax expenditures would free up revenue that could be used to invest in resources that broaden economic security and create wealth and opportunity for more Californians.

Stay in the know.

Join our email list!

Consistent access to health care is necessary for everyone to be healthy and thrive. During the pandemic, millions of Californians with low incomes have been able to keep their Medi-Cal coverage without administrative renewals and regardless of changes to their income. This is because of a temporary “continuous coverage” federal provision.1A provision in the federal Families First Coronavirus Response Act prohibits states from disenrolling Medicaid beneficiaries during the federally declared Public Health Emergency (PHE). The PHE will expire on April 16, 2022 unless the US Secretary of Health and Human Services Secretary extends it again. Despite ongoing hardships due to the pandemic, this federal provision may expire soon, which would disrupt health coverage for many.

Continuous health coverage allows children to receive preventive and primary care
services, which is crucial for very young children. Children who face housing insecurity are particularly vulnerable to losing coverage. When families move, double up with other households, or fall into homelessness, they may not receive timely information or submit paperwork required to maintain coverage, and they could lose continuity of care. About 6 in 10 children under age 5 who are income-eligible for Medi-Cal live in households that pay an unaffordable amount toward housing, placing them at risk of unstable housing and making continuous coverage critical.

The loss of continuous health coverage will particularly affect Latinx children in California.
Latinx children make up about 2 in 3 (66%) young children who are income-eligible for
Medi-Cal and live in households that pay an unaffordable amount of their income toward
housing, exposing the damaging effects of racism.

State policymakers should provide continuous coverage for children on Medi-Cal until at
least their fifth birthday. Every child should have the resources and opportunity to grow up
healthy and thrive.

  • 1
    A provision in the federal Families First Coronavirus Response Act prohibits states from disenrolling Medicaid beneficiaries during the federally declared Public Health Emergency (PHE). The PHE will expire on April 16, 2022 unless the US Secretary of Health and Human Services Secretary extends it again. ↩︎

Stay in the know.

Join our email list!

Everyone should have the opportunity to be healthy and thrive, regardless of their race, gender identity, sexual orientation, income, or zip code. The California Department of Public Health as well as local public health departments play a critical role in protecting and promoting Californians’ health and well-being.1State departments other than the Department of Public Health often contribute to efforts to protect and promote public health. For example, the Department of Toxic Substances Control protects Californians from toxic substances. This analysis excludes such expenditures. Their core functions include infectious disease control, chronic disease prevention, health promotion, and more. Yet despite these important responsibilities, funding has not kept pace with the cost of preparing for and responding to ongoing and emerging health threats that endanger Californians.

State public health spending was generally stagnant or declining prior to the COVID-19 pandemic – leaving Californians vulnerable. Spending only recently increased largely due to the pandemic. Due to chronic underfunding of public health systems, counties and cities across the state were not adequately prepared to respond to COVID-19 and many Californians suffered as a result. The virus disproportionately impacted Black and brown communities, exposing the damaging effects of racism in California.

“
The California Department of Public Health as well as local public health departments play a critical role in protecting and promoting Californians’ health and well-being.
”

The governor’s proposed 2022-23 budget includes a new investment of $300 million for public health infrastructure at the state and local level, which would support workforce expansion, data collection, and more.2Department of Finance, Governor’s Budget Summary 2022-23 (January 10, 2022), 132-134, https://www.ebudget.ca.gov/2022-23/pdf/BudgetSummary/FullBudgetSummary.pdf. The budget also includes $235 million for state-level disease surveillance and IT operations. This commitment is a critical first step in reversing the chronic underfunding of public health systems and ensuring that Californians, especially communities of color, don’t bear the costs of an unprepared state.

  • 1
    State departments other than the Department of Public Health often contribute to efforts to protect and promote public health. For example, the Department of Toxic Substances Control protects Californians from toxic substances. This analysis excludes such expenditures. ↩︎
  • 2
    Department of Finance, Governor’s Budget Summary 2022-23 (January 10, 2022), 132-134, https://www.ebudget.ca.gov/2022-23/pdf/BudgetSummary/FullBudgetSummary.pdf. ↩︎

Stay in the know.

Join our email list!