Skip to content

Download the PDF version of this Fact Sheet.

Medi-Cal is our state’s health coverage program for residents with low incomes, including children, seniors, and workers who may not get affordable health insurance through their jobs. Medi-Cal is a critical source of coverage for low-income seniors because it provides many services — including long-term supports and services — that are not covered by the federal Medicare program. Unfortunately, Medi-Cal’s eligibility rules place seniors at a disadvantage compared to younger adults. Specifically:

  • Adults age 64 and younger generally qualify for no-cost Medi-Cal with incomes up to 138% of the federal poverty line.[1] “No-cost” means that enrollees pay no premiums and have no out-of-pocket costs, such as co-pays or deductibles. For single adults under age 65, the “countable income” limit to enroll in no-cost Medi-Cal is $1,437 per month in 2019 (138% of the poverty line).[2] (Countable income is equal to gross income less allowable exclusions and deductions.)
  • For adults age 65 or older, the income limit for no-cost Medi-Cal is only 122% of the poverty line. Once they turn 65, many Californians with low incomes cannot access free Medi-Cal because the countable income limit for seniors, which is set by the state, is much lower than it is for younger adults.[3] For seniors living on their own, the limit is equal to 100% of the poverty line — currently $1,041 per month for an individual — plus $230, which results in a monthly threshold of $1,271 in 2019 (122% of the poverty line).[4] This is $166 less than the limit that applies to adults age 64 or younger.

In short, seniors with incomes above 122% of the poverty line but below 138% of that threshold fall into an eligibility gap that prevents them from enrolling in no-cost Medi-Cal. These seniors may still access Medi-Cal services, but only if they pay a deductible, known as a “share of cost,” that can amount to hundreds of dollars per month. In effect, Medi-Cal’s unreasonably stringent income rules impose a financial penalty on seniors.

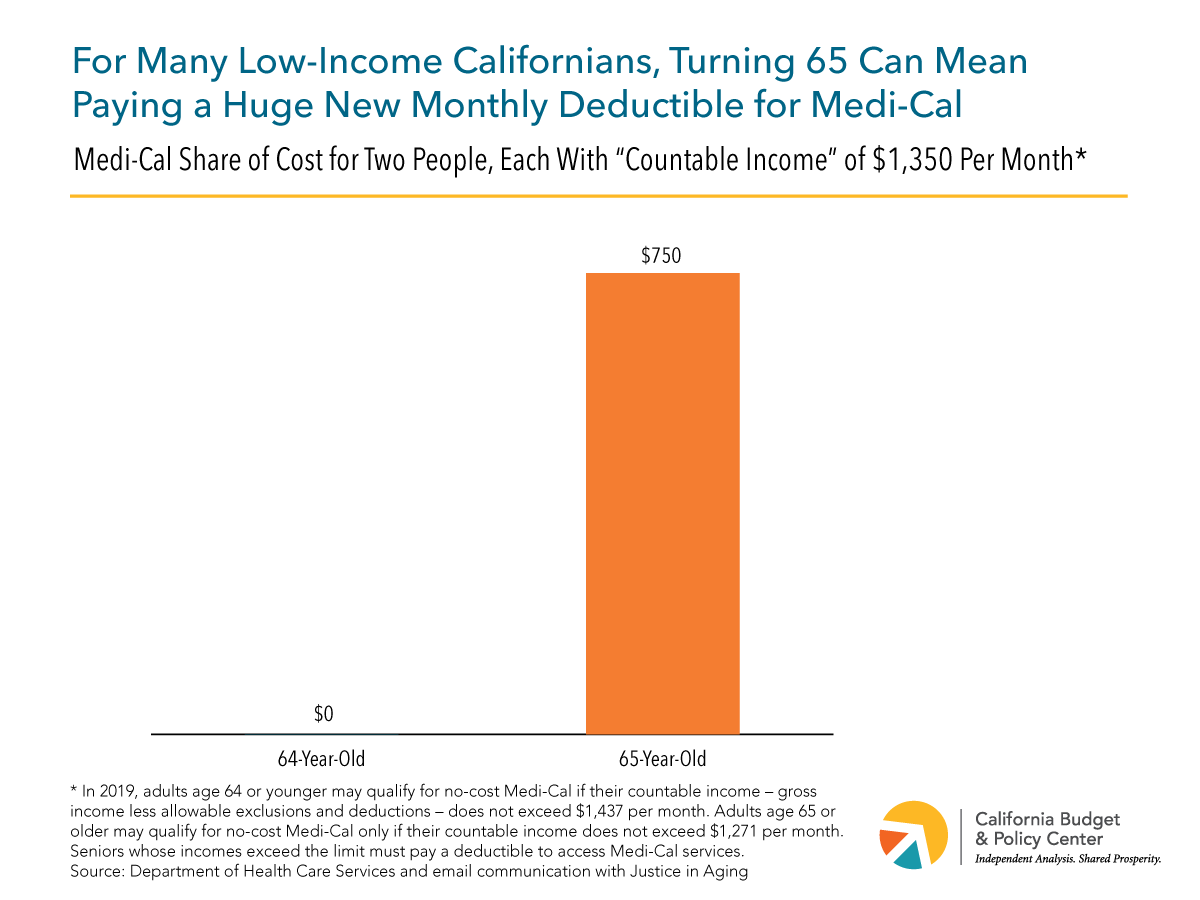
One way to illustrate this “senior penalty” is to look at how Medi-Cal’s rules affect two people — one age 64, the other age 65 — who have the same countable income ($1,350 per month). As shown in the chart below, the 64-year-old would qualify for no-cost Medi-Cal because her income would fall below the threshold that applies to adults through age 64 ($1,437 per month). In contrast, the 65-year-old would not qualify for free Medi-Cal because her income would exceed the much-lower threshold that applies to seniors ($1,271 per month). This senior would have to spend $750 on health care in any given month — her share of cost — before Medi-Cal would begin paying for any remaining medically necessary services during that same month, leaving only $600 to pay for rent, utilities, food, and all other basic living expenses.[5]

In addition to imposing a financial burden on low-income seniors, the rules that determine an individual’s Medi-Cal share of cost are administratively burdensome for counties to implement and difficult for many seniors to understand. As the California Health Care Foundation has explained, “calculating and tracking share of cost amounts can be complicated and confusing for beneficiaries,” in part because individuals “may not understand which expenses qualify to meet their share of cost or know when their share of cost has been met.”[6]

By raising the Medi-Cal income limit for seniors to 138% of the poverty line, state policymakers would 1) create parity between older and younger adults and 2) remove the primary obstacle that prevents many low-income adults age 65 or older from accessing no-cost health care services through Medi-Cal — services that are critical to seniors’ health and well-being.


[1] Undocumented immigrant adults generally are not eligible for comprehensive no-cost Medi-Cal coverage.

[2] The federal government annually adjusts the poverty line for inflation. As a result, the dollar amount of the income limit for no-cost Medi-Cal that applies to nonelderly adults rises each year to reflect changes in the cost of living.

[3] This eligibility gap between seniors and younger adults exists for two reasons. First, seniors were not included in the federal Affordable Care Act’s expansion of Medicaid eligibility to 138% of the poverty line. As a result, decisions affecting seniors’ eligibility for Medi-Cal are largely left to the states. Second, California policymakers have consistently failed to update a key component of the formula that determines seniors’ eligibility for no-cost Medi-Cal (see endnote 4).

[4] The dollar amount of the income limit that applies to seniors generally goes up modestly each year because it is partially based on the federal poverty line, which typically rises from year to year. However, this income limit has never been fully adjusted for inflation because the $230 that is built into the state’s formula has remained frozen since this formula was established in 2000. As a result, the income limit for no-cost Medi-Cal continuously loses ground to the rising cost of living. In 2000, for example, adults age 65 and older could qualify for no-cost Medi-Cal as long as their income did not exceed a threshold that was equal to about 133% of the poverty line. However, because this threshold’s value has steadily eroded, it is equivalent to only 122% of the poverty line today and will continue to lose value relative to the cost of living unless state law is changed.

[5] In this example, the $750 share of cost results from subtracting what is sometimes called a “Maintenance Need Allowance” (MNA) — as determined by the state — from the 65-year-old’s countable monthly income. The MNA for an individual is $600, a figure that has not been adjusted since 1989. The share of cost is based on the following calculation: $1,350 (countable monthly income) less $600 (MNA) = $750 (share of cost).

[6] California Health Care Foundation, Share of Cost Medi-Cal (September 2010), p. 7.

Stay in the know.

Join our email list!

Download the PDF version of this Fact Sheet.

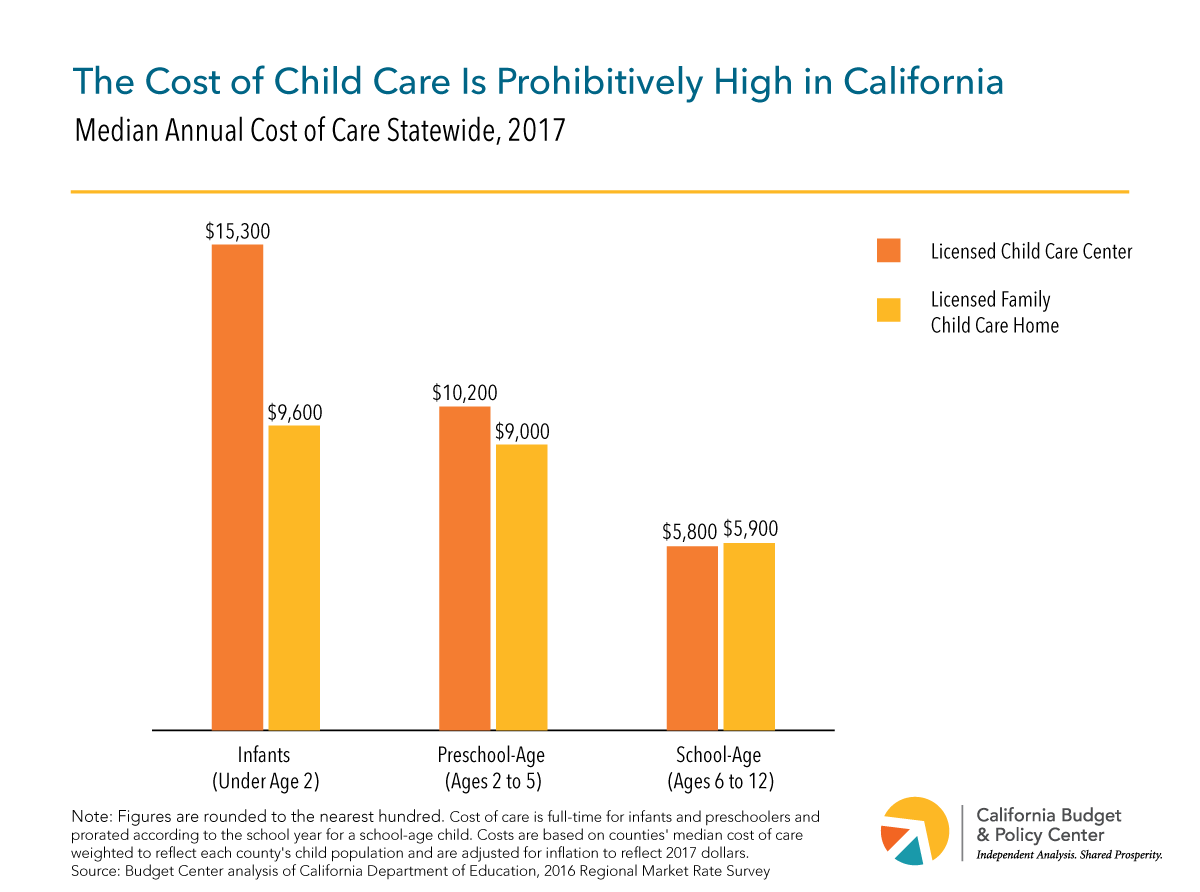
Without access to affordable child care, parents may struggle to find and keep jobs or to go to school. Unfortunately, California ranks as one of the least affordable states in the nation based on the cost of child care.[1] Statewide, the median annual cost of care for an infant in a licensed child care center is over $15,000. In a family with two working parents earning low wages, each parent would have to work 147 hours per week to avoid paying more than the federally recommended 7% of income on the cost of child care for their infant.[2] The annual cost of care in a licensed center for older children is also out of reach for many families — $10,200 for a preschool-age child and $5,800 for a school-age child. While prices may be lower with a licensed home-based provider, this option is still prohibitively expensive for families who are struggling to cover basic expenses.

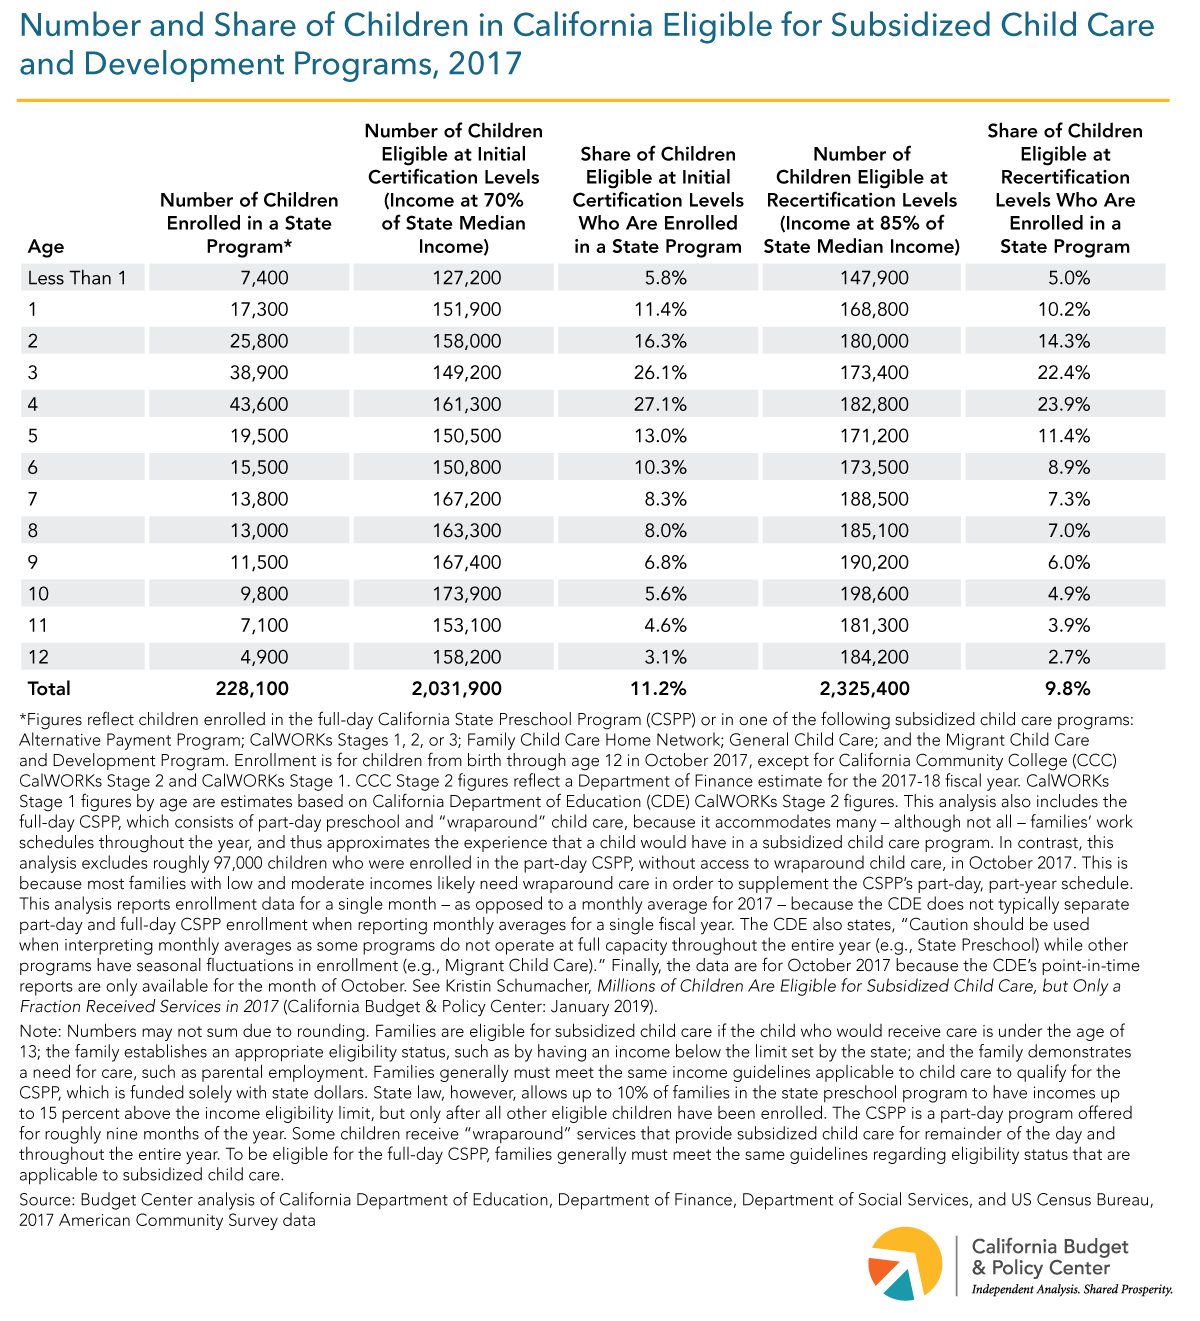
Parents typically incur the highest-priced care — for infants and toddlers — at a younger age when they can least afford it. Even families with older children may struggle to find affordable care before or after the school day or when they are working nonstandard hours. Family supports such as subsidized child care and development programs can help boost families’ economic security by providing stable and affordable child care. According to a Budget Center analysis of federal survey data, an estimated 2 million children from birth through age 12 were eligible for child care assistance in 2017.[3] Across all age groups, only a small share of eligible children were enrolled in a subsidized program: 1 in 9 infants and toddlers (11.6%), 1 in 5 preschool-age children (22.1%), and 1 in 15 school-age children (6.7%). [4] (For additional data by age, see Tables 1 and 2 below.)

The high cost of care coupled with the large number of children eligible for child care assistance underscores the need for additional state and federal investments in California’s subsidized child care and development system. Child care assistance is critical to supporting low- and moderate-income families while parents are at work or school and is vital to helping families achieve economic security. Providing additional access to child care assistance should be a key component of state and federal budget deliberations.


This analysis is the second part of a multiphase effort to analyze subsidized child care and development programs in California. Other phases of this work examine the total unmet need for subsidized child care and unmet need by race and ethnicity. Support for this Fact Sheet was provided by First 5 California.


[1] Child Care Aware of America, The US and the High Cost of Child Care: A Review of Prices and Proposed Solutions for a Broken System (2018).

[2] The US Department of Health and Human Services updated its guidelines on child care affordability in 2016. Access the final rule at https://federalregister.gov/d/2016-22986. “Low wage” is defined as earning less than $14.35 per hour. See University of California Berkeley Labor Center, Low-Wage Work in California (August 2018).

[3] Budget Center analysis of US Census Bureau, American Community Survey data. Data limitations likely result in a conservative estimate of the number of children in California who are eligible for subsidized child care. For more information about the methodology used to calculate this estimate, see the Technical Appendix.

[4] Figures reflect children enrolled in the full-day California State Preschool Program (CSPP) or in one of the following subsidized child care programs: Alternative Payment Program; CalWORKs Stages 1, 2, or 3; Family Child Care Home Network; General Child Care; and the Migrant Child Care and Development Program. Enrollment is for October 2017, except for California Community College CalWORKs Stage 2, which reflects a Department of Finance estimate for the 2017-18 fiscal year. This analysis also includes the full-day CSPP, which consists of part-day preschool and “wraparound” child care, because it accommodates many — although not all — families’ work schedules throughout the year, and thus approximates the experience that a child would have in a subsidized child care program. In contrast, this analysis excludes roughly 97,000 children who were enrolled in the part-day CSPP, without access to wraparound child care, in October 2017. This is because most families with low and moderate incomes likely need wraparound care in order to supplement the CSPP’s part-day, part-year schedule. This analysis reports enrollment data for a single month — as opposed to a monthly average for 2017 — because the California Department of Education (CDE) does not typically separate part-day and full-day CSPP enrollment when reporting monthly averages for a single fiscal year. The CDE also states, “Caution should be used when interpreting monthly averages as some programs do not operate at full capacity throughout the entire year (e.g., State Preschool) while other programs have seasonal fluctuations in enrollment (e.g., Migrant Child Care).” Finally, the data are for October 2017 because the CDE’s point-in-time reports are only available for the month of October. See Kristin Schumacher, Millions of Children Are Eligible for Subsidized Child Care, but Only a Fraction Received Services in 2017 (California Budget & Policy Center: January 2018).

Table 1

Table 2

Stay in the know.

Join our email list!

Download the PDF version of this Fact Sheet.

Children of color are more likely than white children to live in poverty in California, largely due to a legacy of racist policies and practices and ongoing discrimination.[1] These persistent inequities have limited opportunity and economic mobility for many families of color.[2] Living in poverty increases the odds that children will experience hardships that adversely affect their development, health, and well-being.[3] California’s subsidized child care and development programs aim to mitigate the effects of poverty by boosting families’ economic security and supporting child development. Because children of color are more likely to live in families with low incomes, they are disproportionately eligible for child care and development programs. In California, children of color make up nearly 74.7% of all children ages 12 and under, but comprise 86.1% of children eligible for subsidized care. This gap is widest for Latinx children (52.3% of the 12-and-under population, compared to 68.1% of children eligible for care).

Overall, of the more than 2 million estimated children birth through age 12 who were eligible for subsidized child care and development programs, just 1 in 9 were enrolled in a subsidized child care program or the full-day, full-year California State Preschool Program.[4] The share of eligible children enrolled in a state program was low across all racial and ethnic groups, ranging from 8.3% of eligible Asian and Pacific Islander children to 30.0% of eligible black children.[5] Nearly 1.4 million Latinx children were eligible for subsidized care, but only 126,100 (9.1%) were enrolled in a state program. Even for black children — the demographic group with the highest share of eligible children enrolled in a full-day, full-year program — roughly 2 out of 3 eligible children did not receive subsidized care.

Governor Newsom has signaled the intent to continue to invest in California’s subsidized child care and development system. Boosting funding for this system is a key way to reduce barriers to success for children of color. Yet, policymakers should use a race-equity lens to ensure that new funding is targeted to children, families, and communities of color that have historically been left behind.


This analysis is the second part of a multiphase effort to analyze subsidized child care and development programs in California. Other phases of this work examine the total unmet need for subsidized child care and unmet need across different age groups. Support for this Fact Sheet was provided by First 5 California.


[1] Alissa Anderson, If The Poverty Rate for Kids of Color Were As Low as That for White Kids, 977,000 Fewer Kids Would be in Poverty (California Budget & Policy Center: April 2018).

[2] Ruth Cosse, et al., Building Strong Foundations: Racial Inequity in Policies that Impact Infants, Toddlers, and Families (CLASP and Zero to Three: November 2018).

[3] Center on the Developing Child at Harvard University, The Foundations of Lifelong Health Are Built in Early Childhood (July 2010) and Slopen, et al., “Racial Disparities in Child Adversity in the US: Interactions With Family Immigration History and Income,” American Journal of Preventive Medicine 50 (2016).

[4] Budget Center analysis of US Census Bureau, American Community Survey data. Data limitations likely result in a conservative estimate of the number of children in California who are eligible for subsidized child care. Families are eligible for subsidized child care if the child who would receive care is under the age of 13; the family establishes an appropriate eligibility status, such as by having an income below the limit set by the state; and the family demonstrates a need for care, such as parental employment. For more information about the methodology used to calculate this estimate, see the Technical Appendix.

[5] Figures reflect children enrolled in the full-day California State Preschool Program (CSPP) or in one of the following subsidized child care programs: Alternative Payment Program; CalWORKs Stages One, Two, or Three; Family Child Care Home Network; General Child Care; and the Migrant Child Care and Development Program. Enrollment is for October 2017, except for California Community College CalWORKs Stage Two, which reflects a Department of Finance estimate for the 2017-18 fiscal year. This analysis also includes the full-day CSPP, which consists of part-day preschool and “wraparound” child care, because it accommodates many — although not all — families’ work schedules throughout the year, and thus approximates the experience that a child would have in a subsidized child care program. In contrast, this analysis excludes roughly 97,000 children who were enrolled in the part-day CSPP, without access to wraparound child care, in October 2017. This is because most families with low and moderate incomes likely need wraparound care in order to supplement the CSPP’s part-day, part-year schedule. This analysis reports enrollment data for a single month — as opposed to a monthly average for 2017 — because the California Department of Education (CDE) does not typically separate part-day and full-day CSPP enrollment when reporting monthly averages for a single fiscal year. The CDE also states, “Caution should be used when interpreting monthly averages as some programs do not operate at full capacity throughout the entire year (e.g., State Preschool) while other programs have seasonal fluctuations in enrollment (e.g., Migrant Child Care).” Finally, the data are for October 2017 because the CDE’s point-in-time reports are only available for the month of October. See Kristin Schumacher, Millions of Children Are Eligible for Subsidized Child Care, but Only a Fraction Received Services in 2017 (California Budget & Policy Center: January 2019).

Stay in the know.

Join our email list!

Download the PDF version of this Fact Sheet.

In late 2017, President Trump signed the Tax Cuts and Jobs Act (TCJA) providing corporations substantial cuts in tax rates and other tax breaks. The TCJA means corporations will pay substantially less in federal taxes at a time when they already contribute far less of their California income in state taxes than they did a generation ago.

During the past three decades, the share of California corporate income paid in state taxes declined by more than half. In the early 1980s, corporations that reported profits in California paid more than 9.5% of this income in state corporate income taxes. In contrast, corporations paid just 4.4% of their California profits in income taxes in 2016, the most recent year for which data are available. California’s state budget would have received $10.9 billion more revenue in 2016 had corporations paid the same share of their income in taxes that year as they did in 1981. This amount is more than the state spends on the University of California, the California State University, and student aid combined.

The reduction of tax rates is one reason corporations pay less of their income in taxes today than they did in the 1980s. Since increasing the corporate tax rate to 9.6% in 1980, the state legislature has cut the rate twice: from 9.6% to 9.3% in 1987 and from 9.3% to 8.84%, its current level, in 1997.

In addition to cutting tax rates since the 1980s, lawmakers have enacted a number of corporate tax breaks that reduce the share of income that California corporations pay in state taxes. For example, beginning in 1987, California allowed multinational corporations to lower their tax liability by calculating their California income based on either their total income from worldwide operations or only from their operations within the US. This so-called “water’s edge” provision will cost the state an estimated $2.2 billion in 2018-19. In total, California is projected to spend $6.6 billion on tax expenditures for corporations in 2018-19, more than it will spend this year ($6.2 billion) on the state’s 115 community colleges.

At the national level, last year’s TCJA made several changes to federal tax law that will benefit corporations. The most significant change was slashing the federal corporate income tax rate from 35% to 21%, the largest one-time reduction to this tax rate in US history. Moreover, because the new federal tax law still includes many corporate tax breaks, including the ability to deduct state and local income taxes, the effective federal tax rate for corporations will often be lower than 21%. As a result, California corporations are likely to pay far less of their income in federal taxes beginning in 2018 than they have in recent years.

As the new Governor crafts a policy agenda that may require additional state resources, policymakers should consider the fact that corporations pay far less of their income in state taxes than they have in the past. And now that corporations are likely to pay less of their income in federal taxes as well, they can afford to contribute more to support the state’s public systems and supports. Increasing the state’s corporate income tax rate may be one way to boost revenue. However, policymakers have other options for increasing the amount corporations pay in state taxes. For example, they could review existing corporate tax rules, such as corporate tax credits, exemptions, and deductions, and reduce or eliminate those that are not achieving the state’s policy goals, including limiting state tax breaks in accordance with the new federal tax law. By reducing spending on corporate tax breaks, the state would have more resources available to invest in systems and programs such as higher education and workforce development that would not only help improve the lives of Californians, but also boost the state’s economy and produce an educated workforce that would benefit the state’s employers, including major corporations.

Stay in the know.

Join our email list!

Download the PDF version of this Fact Sheet.

Support for this Fact Sheet was provided by First 5 California.

Child care keeps parents working and families afloat, yet the high cost of care across California often forces parents to make difficult choices about who cares for their child while they go to work. This can be detrimental for families with low incomes, who often struggle to simply afford the basics. California’s subsidized child care and development system is designed to serve families with low and moderate incomes, but there are far more children eligible for subsidized child care than what is funded by the state and federal governments.[1] This means that families with few resources are often unable to secure affordable care for their children.

In 2017, just 1 in 9 children eligible for subsidized child care and development programs in California were enrolled in a program that could accommodate families for more than a couple hours per day and throughout the entire year.[2] According to a Budget Center analysis of federal survey data, an estimated 2 million children from birth through age 12 were eligible for care, but only 228,100 were able to participate in a subsidized full-day, full-year program.[3] This mismatch between eligibility for care and available spaces largely reflects inadequate state and federal funding. Moreover, decades of wage stagnation has dampened families’ incomes, making it difficult to afford the high cost of child care.[4] In fact, in 2017, roughly 1 out of 3 California workers with children earned low wages. [5]

State and federal policymakers have begun to increase funding for subsidized child care and development programs in recent years.[6] In California, policymakers have incrementally increased the number of spaces for children and boosted provider payment rates. State policymakers also took an important step forward by updating the decade-old income eligibility limits and implementing a 12-month eligibility period. These positive changes were long overdue and allow families to retain subsidized care for their children while they build a secure economic foundation for their families. However, these changes also mean that the small share of families receiving care remain eligible for longer periods of time, while substantially more families have become eligible. Without additional investments in new spaces for children, these changes could further limit access for low-income families.

Governor Newsom’s proposed 2019-20 budget includes a large investment in young children. However, while the proposal expands full-day, full-year preschool and sets aside hundreds of millions of dollars in one-time funding for subsidized child care facilities and teacher training, it does not immediately expand access to subsidized child care programs for children from low- and moderate-income families, instead signaling that the Administration intends to significantly expand the number of children served in the years ahead. Since some parents have been waiting for child care for years, substantial investment in California’s subsidized child care and development system must include increased access to child care programs for children and families.

This analysis is the first part of a multiphase effort to analyze subsidized child care and development programs in California. Future phases of this work will examine the unmet need for subsidized child care across different age groups and by race and ethnicity.


[1] Families are eligible for subsidized child care if the child who would receive care is under the age of 13; the family establishes an appropriate eligibility status, such as by having an income below the limit set by the state; and the family demonstrates a need for care, such as parental employment. Families generally must meet the same income guidelines applicable to child care to qualify for the California State Preschool Program (CSPP), which is funded solely with state dollars. State law, however, allows up to 10% of families in the state preschool program to have incomes up to 15% above the income eligibility limit, but only after all other eligible children have been enrolled. The CSPP is a part-day program offered for roughly nine months of the year. Some children receive “wraparound” services that provide subsidized child care for the remainder of the day and throughout the entire year. To be eligible for the full-day CSPP, families generally must meet the same guidelines regarding eligibility status that are applicable to subsidized child care.

[2] Budget Center analysis of US Census Bureau, American Community Survey data. Data limitations likely result in a conservative estimate of the number of children in California who are eligible for subsidized child care. For more information about the methodology used to calculate this estimate, see the Technical Appendix.

[3] The 228,100 figure reflects children enrolled in the full-day CSPP or in one of the following subsidized child care programs: Alternative Payment Program; CalWORKs Stages One, Two, or Three; Family Child Care Home Network; General Child Care; and the Migrant Child Care and Development Program. Enrollment is for October 2017, except for California Community College CalWORKs Stage Two, which reflects a Department of Finance estimate for the 2017-18 fiscal year. This analysis also includes the full-day CSPP, which consists of part-day preschool and “wraparound” child care, because it accommodates many — although not all — families’ work schedules throughout the year, and thus approximates the experience that a child would have in a subsidized child care program. In contrast, this analysis excludes roughly 97,000 children who were enrolled in the part-day CSPP, without access to wraparound child care, in October 2017. This is because most families with low and moderate incomes likely need wraparound care in order to supplement the CSPP’s part-day, part-year schedule. This analysis reports enrollment data for a single month — as opposed to a monthly average for 2017 — because the California Department of Education (CDE) does not typically separate part-day and full-day CSPP enrollment when reporting monthly averages for a single fiscal year. The CDE also states, “Caution should be used when interpreting monthly averages as some programs do not operate at full capacity throughout the entire year (e.g., State Preschool) while other programs have seasonal fluctuations in enrollment (e.g., Migrant Child Care).” Finally, the data are for October 2017 because the CDE’s point-in-time reports are only available for the month of October.

[4] See Amy Rose, Modest Gains for California’s Low- and Midwage Workers (California Budget & Policy Center: January 2018).

[5] Estimate based on data from the University of California Berkeley Labor Center, Low-Wage Work in California (August 2018). “Low wage” is defined as earning less than $14.35 per hour.

[6] Kristin Schumacher, Dollars for Child Care and Preschool in 2018-19 Near Pre-Recession Levels With Boost From One-Time Funding (California Budget & Policy Center: September 2018).

Stay in the know.

Join our email list!

Download the PDF version of this Fact Sheet.

For the fifth year in a row, funding for California’s subsidized child care and development system has increased. This system provides critical child care and early learning opportunities for a limited number of children from low- and moderate-income families, but state funding was cut dramatically during and after the Great Recession, while federal funding for subsidized child care remained relatively flat.[1] This meant that fewer children and families received subsidized care than prior to the onset of the Great Recession. However, state policymakers have incrementally reinvested in these programs and services beginning with the 2014-15 state fiscal year, and bipartisan support for subsidized child care at the federal level has resulted in newly available federal funds, as well. Due to these investments, after adjusting for inflation, overall funding for California’s subsidized child care and development system in the 2018-19 fiscal year is $3.887 billion, 15% greater than in 2017-18 ($3.375 billion), and nearly even with funding levels in 2007-08, prior to the onset of the Great Recession (see chart).

The 2018-19 budget includes state funds to add 2,100 Alternative Payment Program (AP) child care slots, as well as 2,959 full-day state preschool slots, as agreed upon in the 2016-17 budget agreement. This year’s budget also adds 11,307 time-limited AP child care slots with newly available federal funds.[2] The 2018-19 budget also increases payment rates for providers that contract directly with the state, including an additional increase specifically for the care of infants, toddlers, and children with special needs. Still, despite the increase in state and federal resources, overall funding for subsidized child care and preschool slots in 2018-19 ($3.522 billion) is still nearly $250 million lower than in 2007-08 ($3.771 billion), prior to the onset of the Great Recession, after adjusting for inflation.

In contrast, total funding for programs and activities designed to boost the quality or support the administration of subsidized child care and preschool programs has increased dramatically.[3] These “quality and support programs” include a range of items such as the Quality Rating and Improvement System (QRIS) and funding for the Resource and Referral Network. Total funding for quality and support programs in 2018-19 is $365 million — an increase of 143% compared to 2017-18, after adjusting for inflation. This dramatic increase is primarily due to the new Inclusive Early Care and Education Expansion Program, which was funded with $167 million in one-time Proposition 98 funds that are to be administered through the 2022-23 fiscal year.

While funding for certain quality-boosting activities has increased, funding for other activities that fall within the quality and support category has decreased or been eliminated. For example, the state funded Centralized Eligibility Lists (CELs) with about $8 million for the maintenance of county-level waiting lists for subsidized slots, but funding for CELs was redirected to child care programs in 2011-12 to mitigate the effects of deep budget cuts. Policymakers have not restored funding for this service. In addition, even though funding for the Resource and Referral Network has remained relatively stable at roughly $19 million annually since 2007-08, funding has actually decreased by nearly one-fifth (19%) after adjusting for inflation.

California’s subsidized child care and development system keeps families working while providing kids with an environment that helps them learn and thrive. Yet, we know that the number of children eligible for subsidized care far outstrips the number of available slots.[4] As the new Governor crafts a policy agenda for the next four years, it is critical that early care and education is at the top of the list. Investing in our state’s subsidized child care and development system sets children and families up for success.


[1] The federal American Recovery and Reinvestment Act (ARRA) of 2009 included a $2 billion boost in funding for the Child Care and Development Block Grant (CCDBG), a major source of federal funding for subsidized child care. Due to this, California received $221 million in additional federal funds, which the state used in 2009-10 and 2010-11 to offset a portion of the state budget cuts to the child care and development system, which in turn maintained child care assistance for some families who otherwise would have lost it.

[2] Absent ongoing funding from the federal government, these slots will only be available through June 30, 2020.

[3] The 2014 reauthorization of the CCDBG, a major source of federal funding for subsidized child care, required states to increase the share of funds set aside for improving the quality of subsidized child care. See Hannah Matthews, et al., Implementing the Child Care and Development Block Grant Reauthorization: A Guide for States (The Center for Law and Social Policy and The National Women’s Law Center: June 2017).

[4] Kristin Schumacher, Over 1.2 Million California Children Eligible for Subsidized Child Care Did Not Receive Services From State Programs in 2015 (California Budget & Policy Center: December 2016).

Stay in the know.

Join our email list!

Download the PDF version of this Fact Sheet.

Cal Grants are the foundation of California’s financial aid program for low- and middle-income students pursuing higher education in the state. Cal Grants provide aid for tuition and living expenses that does not have to be paid back. There are two main types of Cal Grants: Entitlement grants and Competitive grants.

Entitlement grants are guaranteed to all California students who meet certain income and GPA requirements and apply to college no later than one year after high school graduation and to community college students who are transferring to a four-year college. Nontraditional students who meet the income and GPA requirements and apply for the award by the deadline more than a year after high school graduation are eligible for Competitive Cal Grants. Competitive grant amounts are equivalent to the Entitlement grants, providing tuition assistance up to $12,630 at University of California, $5,742 at California State University, and $9,084 at most private colleges.[1] The main difference between Competitive grants and Entitlement grants is that Entitlement grants are guaranteed to all eligible students, whereas Competitive grants are currently limited to 25,750 students.

The number of qualified student applicants for Competitive Cal Grants far exceeds available awards. In 2017-18, more than 340,000 students qualified for an award, but only 25,750 grants were available — meaning 92% of eligible students were not served. In the past decade, the number of students who are eligible for Competitive Cal Grants has more than doubled (103%), while the number of awards available has increased by less than 15%.[2] In 2008-09, an eligible student had a 13% chance of receiving a Competitive Cal Grant; in 2017-18, it was 8%. California students have a better chance of getting into the University of California, Berkeley than of receiving a Competitive Cal Grant.[3]

Nontraditional students, such as those who spend significant time in the workforce before enrolling in college, face significant barriers in their academic pursuits. Many of these students rely on financial aid to be able to afford the rising costs associated with a college degree, yet the probability that they will receive the aid they need to succeed is low — and declining over time. Competitive Cal Grants are one of the most effective financial aid investments the state can make to promote access and affordability because they support the lowest-income and least represented students. Increasing the number of Competitive Cal Grant awards available would help ensure college is affordable for a larger share of nontraditional students.


Endnotes

[1] Figures reflect award amounts for the 2018-19 academic year.

[2] The increase in eligible students is likely due to improvements in the California Student Aid Commission’s application system and process, an increase in the number of older students seeking to upgrade their skills to improve their job prospects and meet changing labor market demands, and greater financial aid awareness.

[3] University of California, Berkeley’s incoming freshman acceptance rate for 2017-18 was 18.3%.

Stay in the know.

Join our email list!

In the fall of 2006, with California’s prisons bulging at the seams and the state facing lawsuits targeting prison overcrowding, Governor Arnold Schwarzenegger used his executive authority to “temporarily house” California prisoners in private correctional facilities in other states. (The Legislature endorsed this policy soon after it was implemented.) Initially, the numbers were small: Within a couple of months of the Governor’s emergency proclamation, just 80 Californians had been sent to prison beyond the state line (to Tennessee). However, California’s use of out-of-state “contract beds” expanded rapidly. By late 2010, more than 10,000 people were serving their California prison sentences outside of the state, including in Mississippi and Oklahoma.

Advocates for incarcerated adults criticized the state’s policy, arguing that “transferring prisoners out of state further disrupts ties to family and community.” Concerns were also raised about the conditions in private, for-profit facilities. Nonetheless, state policymakers saw the use of out-of-state facilities as a key strategy for addressing severe overcrowding in California’s prisons, at least temporarily. The apparent need for this strategy became all the more urgent when, in August 2009, a panel of federal judges ordered the state to cap its prison population at 137.5% of the prison system’s “design capacity.” At the time of this order — which was upheld by the US Supreme Court — California’s prison population far exceeded the cap. More than 150,000 adults were housed in state prisons that were designed to hold a total of about 80,000 people, putting the prison population at 188% of capacity.

Yet, thanks to a series of criminal justice reforms adopted by state policymakers and the voters — reforms that have significantly reduced incarceration — California has been able to comply with the court-ordered prison population cap while simultaneously scaling back its reliance on out-of-state facilities. Since peaking at over 10,000 in the early 2010s, the number of California prisoners housed outside of the state has declined to less than 3,000, as Governor Brown’s administration has pursued a policy (articulated in 2012 and again in 2016) that aims to end the use of contract beds in other states. Now, the culmination of this policy is just around the corner: California is expected to sever its ties with all out-of-state contract facilities by the end of January 2019, ending an era that began a dozen years ago during the depths of California’s prison overcrowding crisis.

Does ending the use of out-of-state facilities mean that California’s work is done when it comes to criminal justice reform? Not by a longshot. Although the state continues to comply with the court-ordered prison population cap, the prison system — which is overseen by the California Department of Corrections and Rehabilitation (CDCR) — remains severely overcrowded. Currently, approximately 115,700 adults are incarcerated in 34 state prisons designed to hold about 85,000 people — 136% of capacity. In addition, more than 11,000 adults are housed in other in-state facilities under the CDCR’s jurisdiction, including public and private contract facilities.

With incarceration projected to continue declining modestly over the next few years, California should soon be able to scale back the use of private in-state contract facilities — a goal explicitly spelled out in the 2018-19 state budget package — and could be in a position to close at least one state prison. However, downsizing California’s costly prison infrastructure in a bigger way would require additional criminal justice reforms, such as addressing the state’s harsh, one-size-fits-all sentencing laws. By more rapidly reducing incarceration, California could plan for the closure of multiple prisons and reinvest the savings in a range of public services and systems that can help to promote rehabilitation, reduce poverty, and strengthen families and communities. Watch for more Budget Center analysis and commentary on this topic in the coming months.

Stay in the know.

Join our email list!