Skip to content

Too many families and individuals in all regions of California struggle to afford the costs of housing, child care, health care, food, and other basic necessities – with serious consequences for health and well-being that can also affect the broader community and economy. Many families that include immigrants face particular challenges to maintaining economic security, even in a strong economy, due to jobs with low wages, unstable work, and the “chilling effect” of recent anti-immigrant federal actions. An economic downturn would likely hit these families and their communities especially hard.

At the same time, refundable income tax credits are proven and powerful tools to boost economic security for families and individuals, and California policymakers have made significant state investments in the state’s Earned Income Tax Credit – the CalEITC – and new Young Child Tax Credit.

However, hundreds of thousands of immigrant families are currently excluded from the

CalEITC and Young Child Tax Credit. State lawmakers can choose to include these Californians with a simple change to filing requirements for these tax credits. Doing so would boost economic security for families and individuals in every legislative district, while pumping millions of dollars into local economies throughout California.

Find our estimated economic benefit by each Senate and Assembly District in California below and the boost local economies would see if policymakers expanded the CalEITC and Young Child Tax Credit to all California who work and pay taxes.

California State Senate

Click below to get the Fact Sheet for your state senate district. (Find your representative)

District   1 –  Sen.  Brian Dahle (R) District   21 –  Sen.  Scott Wilk (R)
District   2 –  Sen.  Mike McGuire (D) District   22 –  Sen.  Susan Rubio (D)
District   3 –  Sen.  Bill Dodd (D) District   23 –  Sen.  Mike Morrell (R)
District   4 –  Sen.  Jim Nielsen (R) District   24 –  Sen.  Maria Elena Durazo (D)
District   5 –  Sen.  Cathleen Galgiani (D) District   25 –  Sen.  Anthony Portantino (D) 
District   6 –  Sen.  Richard Pan (D) District   26 –  Sen.  Ben Allen (D)
District   7 –  Sen.  Steve Glazer (D) District   27 –  Sen.  Henry Stern (D)
District   8 –  Sen.  Andreas Borgeas (R) District   28 –  VACANT
District   9 –  Sen.  Nancy Skinner (D) District   29 –  Sen.  Ling Ling Chang (R) 
District   10 –  Sen.  Bob Wieckowski (D) District   30 –  Sen.  Holly Mitchell (D)
District   11 –  Sen.  Scott Wiener (D) District   31 –  Sen.  Richard Roth (D)
District   12 –  Sen.  Anna Caballero (D) District   32 –  Sen.  Bob Archuleta (D)
District   13 –  Sen.  Jerry Hill (D) District   33 –  Sen.  Lena Gonzalez (D)
District   14 –  Sen.  Melissa Hurtado (D) District   34 –  Sen.  Tom Umberg (D)
District   15 –  Sen.  Jim Beall (D) District   35 –  Sen.  Steven Bradford (D)
District   16 –  Sen.  Shannon Grove (R) District   36 –  Sen.  Patricia Bates (R)
District   17 –  Sen.  Bill Monning (D) District   37 –  Sen.  John Moorlach (R)
District   18 –  Sen.  Bob Hertzberg (D) District   38 –  Sen.  Brian Jones (R)
District   19 –  Sen.  Hannah-Beth Jackson (D) District   39 –  Sen.  Toni Atkins (D)
District   20 –  Sen.  Connie Leyva (D) District   40 –  Sen.  Ben Hueso (D)

California State Assembly

Click below to get the Fact Sheet for your state assembly district. (Find your representative)

District  1 –  Asm.  Megan Dahle (R) District  41 –  Asm.  Chris Holden (D)
District  2 –  Asm.  Jim Wood (D) District  42 –  Asm.  Chad Mayes (I)
District  3 –  Asm.  James Gallagher (R) District  43 –  Asm.  Laura Friedman (D)
District  4 –  Asm.  Cecilia Aguiar-Curry (D) District  44 –  Asm.  Jacqui Irwin (D)
District  5 –  Asm.  Frank Bigelow (R) District  45 –  Asm.  Jesse Gabriel (D)
District  6 –  Asm.  Kevin Kiley (R) District  46 –  Asm.  Adrin Nazarian (D)
District  7 –  Asm.  Kevin McCarty (D) District  47 –  Asm.  Eloise Gomez Reyes (D)
District  8 –  Asm.  Ken Cooley (D) District  48 –  Asm.  Blanca Rubio (D)
District  9 –  Asm.  Jim Cooper (D) District  49 –  Asm.  Ed Chau (D)
District  10 –  Asm.  Marc Levine (D) District  50 –  Asm.  Richard Bloom (D)
District  11 –  Asm.  Jim Frazier (D) District  51 –  Asm.  Wendy Carrillo (D)
District  12 –  Asm.  Heath Flora (R) District  52 –  Asm.  Freddie Rodriguez (D)
District  13 –  Asm.  Susan Eggman (D) District  53 –  Asm.  Miguel Santiago (D)
District  14 –  Asm.  Tim Grayson (D) District  54 –  Asm.  Sydney Kamlager-Dove (D)
District  15 –  Asm.  Buffy Wicks (D) District  55 –  Asm.  Phillip Chen (R)
District  16 –  Asm.  Rebecca Bauer-Kahan (D) District  56 –  Asm.  Eduardo Garcia (D)
District  17 –  Asm.  David Chiu (D) District  57 –  Asm.  Ian Calderon (D)
District  18 –  Asm.  Rob Bonta (D) District  58 –  Asm.  Cristina Garcia (D)
District  19 –  Asm.  Phil Ting (D) District  59 –  Asm.  Reggie Jones-Sawyer (D)
District  20 –  Asm.  Bill Quirk (D) District  60 –  Asm.  Sabrina Cervantes (D)
District  21 –  Asm.  Adam Gray (D) District  61 –  Asm.  Jose Medina (D)
District  22 –  Asm.  Kevin Mullin (D) District  62 –  Asm.  Autumn Burke (D)
District  23 –  Asm.  Jim Patterson (R) District  63 –  Asm.  Anthony Rendon (D)
District  24 –  Asm.  Marc Berman (D) District  64 –  Asm.  Mike Gipson (D)
District  25 –  Asm.  Kansen Chu (D) District  65 –  Asm.  Sharon Quirk-Silva (D)
District  26 –  Asm.  Devon Mathis (R) District  66 –  Asm.  Al Muratsuchi (D)
District  27 –  Asm.  Ash Kalra (D) District  67 –  Asm.  Melissa Melendez (R)
District  28 –  Asm.  Evan Low (D) District  68 –  Asm.  Steven Choi (R)
District  29 –  Asm.  Mark Stone (D) District  69 –  Asm.  Tom Daly (D)
District  30 –  Asm.  Robert Rivas (D) District  70 –  Asm.  Patrick O’Donnell (D)
District  31 –  Asm.  Joaquin Arambula (D) District  71 –  Asm.  Randy Voepel (R)
District  32 –  Asm.  Rudy Salas (D) District  72 –  Asm.  Tyler Diep (R)
District  33 –  Asm.  Jay Obernolte (R) District  73 –  Asm.  Bill Brough (R)
District  34 –  Asm.  Vince Fong (R) District  74 –  Asm.  Cottie Petrie-Norris (D)
District  35 –  Asm.  Jordan Cunningham (R) District  75 –  Asm.  Marie Waldron (R)
District  36 –  Asm.  Tom Lackey (R) District  76 –  Asm.  Tasha Boerner Horvath (D)
District  37 –  Asm.  Monique Limon (D) District  77 –  Asm.  Brian Maienschein (D)
District  38 –  Asm.  Christy Smith (D) District  78 –  Asm.  Todd Gloria (D)
District  39 –  Asm.  Luz Rivas (D) District  79 –  Asm.  Shirley Weber (D)
District  40 –  Asm.  James Ramos (D) District  80 –  Asm.  Lorena Gonzalez (D)

Stay in the know.

Join our email list!

Supplemental Security Income/State Supplementary Payment (SSI/SSP) grants are a critical source of income for well over 1 million California seniors and people with disabilities who have low incomes and need help paying for basic necessities, such as housing. Grants are funded with both federal (SSI) and state (SSP) dollars. The maximum monthly grant for an individual is about $944, which consists of an SSI grant of $783 and an SSP grant of $160.72.

To help close budget shortfalls during the Great Recession, the state made deep cuts to the SSP portion, reducing it from $233 per month in early 2009 to $156.40 per month by mid-2011. State policymakers increased the SSP grant by $4.32 per month starting in January 2017. However, no additional state grant increases have been provided since then, and the Governor’s proposed 2020-21 state budget assumes the SSP portion will remain frozen for another year.

Because state cuts largely remain in place, SSI/SSP recipients have less money to meet their basic needs, including housing. This is particularly concerning in light of California’s high housing costs. In all 58 California counties, the “Fair Market Rent” (FMR) for a studio apartment exceeds 50% of the maximum SSI/SSP grant for an individual. Moreover, the studio FMR exceeds the entire grant in 22 counties. People are at greater risk of becoming homeless when housing costs account for more than half of household income.

Stay in the know.

Join our email list!

Nearly 2.6 million California K-12 public school students (41.8%) bring a linguistic asset with them to school every day: living in homes where a language other than English is spoken. A majority of these students (1.4 million) demonstrate English proficiency during their school years. But students’ home language skills are often neglected at school and that means many do not receive the state biliteracy designation on their high school diplomas that could benefit students as they apply for higher education and employment opportunities. California can change this trend of overlooking the language assets of its K-12 students by increasing its supply of adequately trained bilingual education teachers who can help students become biliterate. Increasing the number of bilingual education teachers in California’s classrooms would help improve students’ futures and play an important role in meeting the demand for bilingual workers and boosting the state’s competitiveness in an increasingly globalized economy.

While California has taken some important steps in recent years to help bilingual students achieve biliteracy, the state faces significant challenges in meeting the need for adequately trained bilingual education teachers who can support these students. Voters ended restrictions to bilingual programs by approving Proposition 58 in November 2016. The following year the State Board of Education adopted the California English Learner Roadmap and the Legislature established the Bilingual Teacher Professional Development Program. In that time, the demand for bilingual education teachers has grown — as it has every year since 2012-13 when school districts estimated hiring close to 220 bilingual education teachers. By 2017-18, that number had increased by nearly 250%, to an estimate of roughly 760.

The shortage of adequately trained bilingual education teachers adds to the challenge of increasing demand.1 One way to assess that shortage is to look at the number of teachers who have been authorized to teach bilingually in recent years, which pales in comparison to the number of K-12 students who live in homes where languages other than English are spoken. Specifically, a large imbalance exists between 1) the number of students who live in homes where one of the top 10 languages is spoken and 2) teachers who earned an authorization to teach in those languages from 2008-09 to 2017-18 (See Table). For example, while Spanish-speaking teachers earned the largest share of bilingual authorizations during this period, the number of students who lived in Spanish-speaking homes in 2017-18 was substantially higher, resulting in a ratio of more than 250-to-1. The ratio for most other languages was even more imbalanced: more than 2,000-to-1 for students from Vietnamese-speaking homes, nearly 3,200-to-1 for Filipino-speaking homes, and more than 6,800-to-1 for Arabic-speaking homes.

The bilingual education teacher shortage is a significant obstacle preventing California students from achieving biliteracy. To address this shortage, policymakers can take additional steps to encourage people to become bilingual education teachers, support and retain them, and diversify the languages that those educators are prepared to teach. For example, the Legislature should extend and increase the modest $5 million provided for the Bilingual Teacher Professional Development Program, funding that will run out in 2020. Policymakers should also create systems to track and report students who receive the State Seal of Biliteracy and use this information to recruit, and diversify the languages of, bilingual education teachers, incentivize and prioritize career and technical education funding that creates pathways for bilingual educators, and increase the number of universities offering programs that authorize bilingual education teachers.

The language assets of California’s K-12 students present key opportunities. Increasing the supply of adequately trained bilingual education teachers is necessary to leverage those opportunities so more students can achieve biliteracy and the state can meet the demands of an increasingly globalized economy.


Support for the California Budget & Policy Center’s research and analysis of K-12 education issues is provided by the Sobrato Family Foundation and the Stuart Foundation.

1For a discussion of the shortage of bilingual teachers see the 2017 survey conducted by Californians Together.

Stay in the know.

Join our email list!

California has a key advantage in meeting the increasing demand for a multi-lingual workforce: nearly 2.6 million K-12 public school students who live in homes where a language other than English is spoken. A majority of these students (1.4 million) have demonstrated English proficiency either when they started school or after being categorized as English learners. However, only a small share of these students have been able to demonstrate literacy in their home language — a sign that policymakers and education leaders are missing a key opportunity to leverage the language assets of the state’s students. Increasing the number of bilingual students who achieve biliteracy is a worthwhile goal that can improve their life outcomes and the state’s competitiveness in an increasingly globalized economy.

To encourage biliteracy and recognize students’ language skills, California established the State Seal of Biliteracy program in 2012. Any school district, county office of education, or charter school can offer the Seal of Biliteracy to high school graduates who achieve a high level of literacy and fluency in English and at least one other language. The State Seal of Biliteracy is free, voluntary, and schools can adopt it using an easy on-line form. However, while a majority of California school districts that issue high school diplomas offered the Seal of Biliteracy to their students in 2018-19, more than 3 in 10 (31.8%) did not.

Relatively few California students who live in homes where a language other than English is spoken receive the Seal of Biliteracy, despite the language assets they bring to the state’s classrooms. Any student who does not become biliterate represents a missed opportunity. But, this is especially true for students who live in homes where a language other than English is spoken and are also proficient in English: Five in six — more than 146,000 — of these “qualified” 12th grade students did not receive the Seal of Biliteracy in 2017-18.

Why aren’t more students receiving Seals of Biliteracy? One reason may be that the State Seal of Biliteracy has not been adopted by their schools. The remedy for this problem is easy: All school districts, county offices of education, and charter schools that award high school diplomas should adopt the Seal and offer it to their graduates. Other causes may be more challenging to address. For example, California lacks the number of adequately trained bilingual educators needed to deliver instruction in the home languages of the state’s large number of bilingual students, especially given the diversity of those languages.1 Ironically, the state could help meet its bilingual teacher shortage if even a small fraction of bilingual students who receive the Seal of Biliteracy became bilingual educators. The Seal is an important step toward identifying these students. But if California wants to employ bilingual students to address the state’s bilingual teacher shortage it will need to do a better job tracking those who receive the Seal of Biliteracy and providing them the support they need to become teachers. California’s State Seal of Biliteracy can encourage bilingual students to become biliterate, but unless schools adopt the program students will not be able to demonstrate biliteracy. Even if schools adopt the State Seal of Biliteracy, until they have qualified bilingual educators many students who are bilingual will not be able to achieve biliteracy.

Policymakers and education leaders can take key next steps in promoting California’s bilingual opportunities, including encouraging schools to adopt the Seal of Biliteracy, setting up tracking of students who receive Seal designations on their diplomas, and using this collective information to recruit and support qualified bilingual educators. This can all help leverage the language assets of the state’s large number of bilingual students to assist more Californians to become biliterate and strengthen our state’s workforce.


Support for the California Budget & Policy Center’s research and analysis of K-12 education issues is provided by the Sobrato Family Foundation and the Stuart Foundation.

1 Not graduating from high school is another reason students may not receive the Seal of Biliteracy.

Stay in the know.

Join our email list!

Every day, millions of California students come to school with an invaluable asset: living in homes where a language other than English is spoken. However, this asset is often squandered as many of these students do not become literate in their home language. Achieving biliteracy benefits the students who are proficient in more than one language, the schools and colleges they attend, and the communities where these bilingual Californians live and eventually work. A large body of research, including studies cited in last year’s Getting Down to Facts II report, shows that “bilingual education, on average, benefits English Learner (EL) students, resulting in improved outcomes in English proficiency, target language proficiency, reclassification, academic performance, and social outcomes.” The report also cited research that points to the “important economic, cognitive, and cross-cultural benefits” of bilingualism, including the economic demand for bilingual workers. California has an opportunity to meet this demand given its large number of students who speak a language other than English at home. The question is whether the state can leverage that opportunity to improve the lives of these students, and also the state’s competitiveness in an increasingly globalized economy.

California’s K-12 schools educate a large number of students who live in a home where a language other than English is spoken. The state labels these students by three categories early in their education:

  1. English learner ⁠— students who have yet to demonstrate English proficiency;
  2. Reclassified fluent English proficient ⁠— students who previously were English learners and have been reclassified; and
  3. Initial fluent English proficient ⁠— students who demonstrate English proficiency when they enter school.

Grouped together, this universe of students is nearly 2.6 million in California’s public schools (41.8% of K-12 public school enrollment). By the state’s categories it’s: 1.2 million students who are classified as English learners (19.3%), 1.1 million students reclassified fluent English proficient (18.3%), and 261,000 students classified as initial fluent English proficient. (4.2%).

Few question the need for all California students to become literate in English and the 1.1 million English learners who have been reclassified as fluent English proficient signal progress toward that goal. However, labeling these students based on their English proficiency indicates their home language may be seen as a challenge to overcome rather than an asset. This may help explain why many of the state’s students who live in a home where a language other than English is spoken often are not provided the education required to achieve literacy in their family language. While students who speak more than one language are bilingual, they are not biliterate if they can’t read and write in more than one language. Until California prioritizes quality bilingual education for these students, the state will continue to miss opportunities to help Californians achieve biliteracy and leverage their language assets in our schools and workplaces.

California has taken some important steps in recent years to help bilingual students achieve biliteracy. Voters approved Proposition 58 in November 2016, which ended restrictions to bilingual programs that had been in place for nearly two decades and hindered students’ ability to become biliterate. The following year, the State Board of Education adopted the California English Learner Roadmap that intends to strengthen policies, programs, and practices for students classified as English learners. One key principle of the Roadmap includes building the capacity of educators to leverage the strengths and meet the needs of these students. Paradoxically, a key obstacle to leveraging the language assets of California’s students is a shortage of bilingual educators. A 2017 survey  conducted by Californians Together indicated a majority of K-12 districts (58%) planned to expand their bilingual programs. However, a large share of these districts (86%) said that their supply of bilingual teachers was insufficient to meet the staffing needs of those planned expansions.

Policymakers should look to students who speak languages other than English as an opportunity to help more Californians become biliterate, prepare for the workforce, and improve the state’s competitiveness in an increasingly globalized economy. With quality educational programs and adequate support, students who speak languages other than English can achieve biliteracy and improve knowledge and expertise in our workplaces and communities.


Support for the California Budget & Policy Center’s research and analysis of K-12 education issues is provided by the Sobrato Family Foundation and the Stuart Foundation.

Stay in the know.

Join our email list!

View PDF version of this Fact Sheet.

The early childhood years are the foundation for lifelong well-being. Yet, despite the state’s strong economic growth, about 1 in 10 of California’s children are born without important resources strongly associated with child health and well-being, such as access to health care or economic resources. [1] Children with fewer “assets” are at higher risk for adverse experiences — such as abuse — that expose them to harmful stress. [2] Chronic exposure to stress, especially in the early years, undermines children’s healthy development, with long-term health, behavioral, and academic consequences.[3]

Research indicates that early intervention tools like evidence-based home visiting can reduce or prevent the effects of adverse experiences for children. [4] Home visitors, who are often social workers or nurses, provide parenting education and other assistance to at-risk parents.[5] These services can boost children’s and parents’ well-being by enhancing child and maternal health, helping prevent child abuse, and improving child development.[6] However, the number of children in California who would most benefit from home visiting outweighs the current service levels. In the 2017-18 state fiscal year, 31,800 children benefitted from federally- and locally-funded evidence-based or evidence-informed home visiting, compared to the estimated 151,500 children ages 0 to 2 who would most likely benefit from home visiting services. [7]

Home visiting in California is largely funded and coordinated by local First 5 commissions, the California Home Visiting Program in the California Department of Public Health (CDPH), and — beginning January 2019 — the CalWORKs Home Visiting Program.[8] The 2019-20 budget also expanded support for home visiting by providing funding for services through CDPH, which represents the state’s first financial investment in home visiting for non-CalWORKs families.

Without adequate resources, children are at higher risk to experience traumatic life events. This can jeopardize children’s potential success, imposing significant costs on children, their families, and society. Recognizing this, California is investing in early interventions like home visiting in order to improve outcomes for children and their families. Yet, with home visiting programs out of reach for so many children who could benefit from them, policymakers should consider ways to continue to close the gap. Increasing state funding to expand home visiting is a step in the right direction. Additionally, state policymakers should also strengthen the infrastructure for home visiting by improving local service coordination and data collection, and building workforce capacity.

Support for this Fact Sheet was provided by First 5 California.


[1] Email correspondence with Emily Putnam-Hornstein (USC Suzanne Dworak-Peck School of Social Work Children’s Data Network) on April 30, 2019. Analysis is based on data from the California Strong Start Index. The index counts how many resources are present at birth and assigns a birth asset score from 0 to 12.

[2] Regan Foust, et al., California Strong Start Index Documentation (USC Suzanne Dworak-Peck School of Social Work Children’s Data Network, no date), p. 34.

[3]  Ross Thompson, “Stress and Child Development,” The Future of Children 24:1 (2014), pp. 41-59.

[4] Lynn A. Karoly, Rebecca Kilburn, and Jill S. Cannon, Proven Benefits of Early Childhood Interventions (RAND Corporation: 2005).

[5] For example, parents who are at risk of problems such as substance abuse, unemployment, or family violence. See Charles Michalopoulos, et al., The Mother and Infant Home Visiting Program Evaluation: Early Findings on the Maternal, Infant, and Early Childhood Home Visiting Program — A Report to Congress (US Department of Health and Human Services: January 2015).

[6] US Department of Health and Human Services, The Maternal, Infant, and Early Childhood Home Visiting Program: Partnering With Parents to Help Children Succeed (no date), accessed from https://mchb.hrsa.gov/sites/default/files/mchb/MaternalChildHealthInitiatives/HomeVisiting/pdf/programbrief.pdf on April 2, 2018.

[7] The estimated number of children who would most likely benefit from home visiting is based on statewide birth data from the California Department of Public Health (CDPH) and from data provided by Emily Putnam-Hornstein and Regan Foust (USC Suzanne Dworak-Peck School of Social Work Children’s Data Network) on April 30, 2019 and May 9, 2019. This analysis defines children born with 6 or fewer California Strong Start assets as children most likely to benefit from home visiting services. Compared to other children in the state, this population experiences significantly higher rates of childhood adversities, such as a fatality or reports of abuse or neglect by age 5. Putnam-Hornstein provided the share of children who were born with 0 to 6 assets in 2016. This analysis assumes that share is constant in both 2015 and 2017. Data on the number of children receiving home visiting comes from the CDPH and from First 5 California and applies to the 2017-18 state fiscal year. It is not possible to ascertain the asset scores of children receiving home visiting services. For example, some children receiving services may have an asset score that is greater than 6. This analysis does not include the CalWORKs Home Visiting Program, which was implemented in January 2019.

[8] The California Home Visiting Program receives funding from federal grants and, as of the 2019-20 budget agreement, the state. First 5 supports both national evidence-based home visiting models and local models. The CalWORKs Home Visiting Program, which provides up to 24 months of home visiting for CalWORKs parents who are pregnant or parenting children under age 2, was introduced in the 2018-19 state budget and made permanent in the 2019-20 budget. It is currently supported by federal Temporary Assistance for Needy Families funds and the state General Fund. See Esi Hutchful, Home Visiting is a Valuable Investment in California Families (California Budget & Policy Center: May 2018), California Budget & Policy Center, First Look: 2018-19 State Budget Invests in Reserves and an Array of Vital Services, Sets Course for Future Advances (June 2018), and California Budget & Policy Center, First Look: 2019-20 Budget Includes Balanced Investments, Leaves Opportunities to Improve the Economic Well-Being of More Californians (July 2019).

Stay in the know.

Join our email list!

View PDF version of this Fact Sheet.

The neighborhood a child grows up in can shape their long-term success, affecting their economic mobility as adults.[1] While Governor Newsom has pledged to create a “California for All,” currently opportunities for children are not evenly distributed across the state. Policymakers who aim to boost opportunity and improve children’s life-long prospects can strategically invest in subsidized child care and development programs that serve families with low and moderate incomes by targeting areas that have been left behind.

According to a Budget Center analysis of federal survey data, an estimated 2 million children from birth through age 12 were eligible for subsidized child care and development programs in California in 2017 — roughly 1 in 3 children across the state (32.2%).[2] The share of children eligible by county varied dramatically, with the highest shares of eligible children living in counties in the Central Valley — a region with some of the state’s highest poverty rates.[3] Kings County had the highest share, with more than half of all children in the county eligible for subsidized care (50.9%). (See Map below.) More than half of the children in the county group of Colusa, Glenn, Shasta, Tehama, and Trinity were also eligible (50.2%).[4] Conversely, the counties with the lowest share of eligible children were in and around the San Francisco Bay Area and Lake Tahoe, where the cost of living is significantly higher.[5] San Mateo County had the lowest share of eligible children, with 14.9% of children in the county eligible for subsidized care. [6] Because the cost of living is considerably higher in these counties, many families with incomes too high to qualify for subsidized care may still struggle to afford early care and education for their children.

The five counties with the largest number of eligible children were all located in Southern California: Los Angeles (539,900), San Bernardino (154,000), San Diego (149,600), Riverside (147,900), and Orange (136,900). (See Table below.) Collectively, these five counties accounted for more than half of all children birth through age 12 eligible for subsidized child care and development programs in the state. Los Angeles County alone accounted for more than 1 in 4 eligible children in California (26.6%).

Of the 2 million children eligible for subsidized care in California in 2017, just 1 in 9 children were enrolled in a program that could accommodate families for more than a couple hours per day and throughout the entire year (228,100).[7] The share of eligible children enrolled in a state program also varied across the state. (See Table below.) For example, in Orange County just 1 in 16 eligible children were enrolled in a subsidized program (6.1%). Riverside County also had a large number of eligible children but a very low share enrolled in a state program (7.3%). In contrast, due in part to a long history of prioritizing early care and education at the local level, nearly half of all eligible children were enrolled in a subsidized program in San Francisco (49.5%).[8]

Governor Newsom has signaled the intent to increase families’ access to the state’s subsidized child care and development system by proposing to boost funding for this system in the next fiscal year, including dollars for child care facilities, workforce development, and additional spaces for children. With a Governor focused on children and families, policymakers have an opportunity to invest new funding in the 2019-20 budget in an intentional fashion, targeting counties and even neighborhoods were the need is particularly acute. A child’s opportunity to escape poverty is often influenced by where they grow up. By strategically investing in areas throughout the state where children and families do not have as many opportunities, the Administration can ensure that “California for All” reaches those with the greatest need.


This analysis is the fourth part of a multiphase effort to analyze subsidized child care and development programs in California. Other phases of this work have examined the total unmet need for subsidized child care and unmet need across different age groups and by race and ethnicity. Support for this Fact Sheet was provided by First 5 California.


[1] Raj Chetty, et al., The Opportunity Atlas: Mapping the Childhood Roots of Social Mobility (Opportunity Insights and US Census Bureau: October 2018).

[2] Income eligibility is based on initial certification levels, which is 70% of state median income. Families are eligible for subsidized child care if the child who would receive care is under the age of 13; the family establishes an appropriate eligibility status, such as by having an income below the limit set by the state; and the family demonstrates a need for care, such as parental employment. Families generally must meet the same income guidelines applicable to child care to qualify for the California State Preschool Program (CSPP), which is funded solely with state dollars. State law, however, allows up to 10 percent of families in the state preschool program to have incomes up to 15 percent above the income eligibility limit, but only after all other eligible children have been enrolled. The CSPP is a part-day program offered for roughly nine months of the year. Some children receive “wraparound” services that provide subsidized child care for remainder of the day and throughout the entire year. To be eligible for the full-day CSPP, families generally must meet the same guidelines regarding eligibility status that are applicable to subsidized child care. See Kristin Schumacher, Millions of Children Are Eligible for Subsidized Child Care, but Only a Fraction Received Services in 2017 (California Budget & Policy Center: January 2019).

[3] “Central Valley” refers to both the San Joaquin Valley and the Sacramento Valley. For poverty rates by county, see Esi Hutchful and Sara Kimberlin, Incomes Grew and the Official Poverty Rate Dropped in California in 2017, But Millions Still Struggle With Extremely Low Incomes (California Budget & Policy Center: September 2018).

[4] Estimates for certain counties were deemed unreliable due to data limitations. The following counties have been grouped to improve the reliability of the data: 1) Alpine, Amador, Calaveras, Inyo, Madera, Mariposa, Mono, and Tuolumne; 2) Colusa, Glenn, Shasta,  Tehama, and Trinity; 3) Del Norte, Humboldt, Lassen, Modoc, Nevada, Plumas, Sierra, and Siskiyou; 4) El Dorado and Placer; 5) Lake and Mendocino; 6) Marin, Napa, and Sonoma; 7) Monterey, San Benito, San Luis Obispo, and Santa Cruz; and 8) Sutter, Yolo, and Yuba.

[5] See Sara Kimberlin and Amy Rose, Making Ends Meet: How Much Does It Cost to Support a Family in California? (California Budget & Policy Center: December 2017).

[6] The income eligibility limit does not vary across the state, but a number of counties either have a pilot or are in the process of getting state approval for a county pilot to set income limits at a higher level. For example, San Mateo County and the City and County of San Francisco both have permanent pilots, which sets the income eligibility limit at 85% of state median income (SMI). Statewide the income eligibility limit is 70% of SMI, which is used for every county in this analysis.

[7]  The 228,100 figure reflects children enrolled in the full-day CSPP or in one of the following subsidized child care programs: Alternative Payment Program; CalWORKs Stages 1, 2, or 3; Family Child Care Home Network; General Child Care; and the Migrant Child Care and Development Program. Enrollment is for children from birth through age 12 in October 2017. This analysis also includes the full-day CSPP, which consists of part-day preschool and “wraparound” child care, because it accommodates many — although not all — families’ work schedules throughout the year, and thus approximates the experience that a child would have in a subsidized child care program. In contrast, this analysis excludes roughly 97,000 children who were enrolled in the part-day CSPP, without access to wraparound child care, in October 2017. This is because most families with low and moderate incomes likely need wraparound care in order to supplement the CSPP’s part-day, part-year schedule. This analysis reports enrollment data for a single month — as opposed to a monthly average for 2017 — because the CDE does not typically separate part-day and full-day CSPP enrollment when reporting monthly averages for a single fiscal year. The CDE also states, “Caution should be used when interpreting monthly averages as some programs do not operate at full capacity throughout the entire year (e.g., State Preschool) while other programs have seasonal fluctuations in enrollment (e.g., Migrant Child Care).” Finally, the data are for October 2017 because the CDE’s point-in-time reports are only available for the month of October. See Kristin Schumacher, Millions of Children Are Eligible for Subsidized Child Care, but Only a Fraction Received Services in 2017 (California Budget & Policy Center: January 2019).

[8] San Francisco was the first city in the United States to pass a “Children’s Amendment.” Passed in 1991, this measure dedicated local funding to early care and education, among other programs and services for children. Voters in San Francisco also approved additional funding for a “Preschool for All” program in 2004. See San Francisco Office of Early Care & Education, San Francisco Citywide Plan for Early Care and Education (2016).

Stay in the know.

Join our email list!

View the PDF version of this Fact Sheet.

Governor Newsom’s proposed 2019-20 state budget includes $12.7 billion for state corrections.[1] The largest share of this proposed spending (55.5%, or $7.1 billion) goes to state prison operations. This includes the cost of salaries and benefits for correctional officers as well as the cost of various support services for incarcerated adults, such as meals and clothing.

The next-largest set of state corrections expenditures — totaling a proposed $3.4 billion in 2019-20 — pays for health-related services for incarcerated adults. Of this amount, $2.6 billion (20.2% of total spending on state corrections) is for medical and dental care and roughly $800 million (6.3% of the total) is for mental health care.

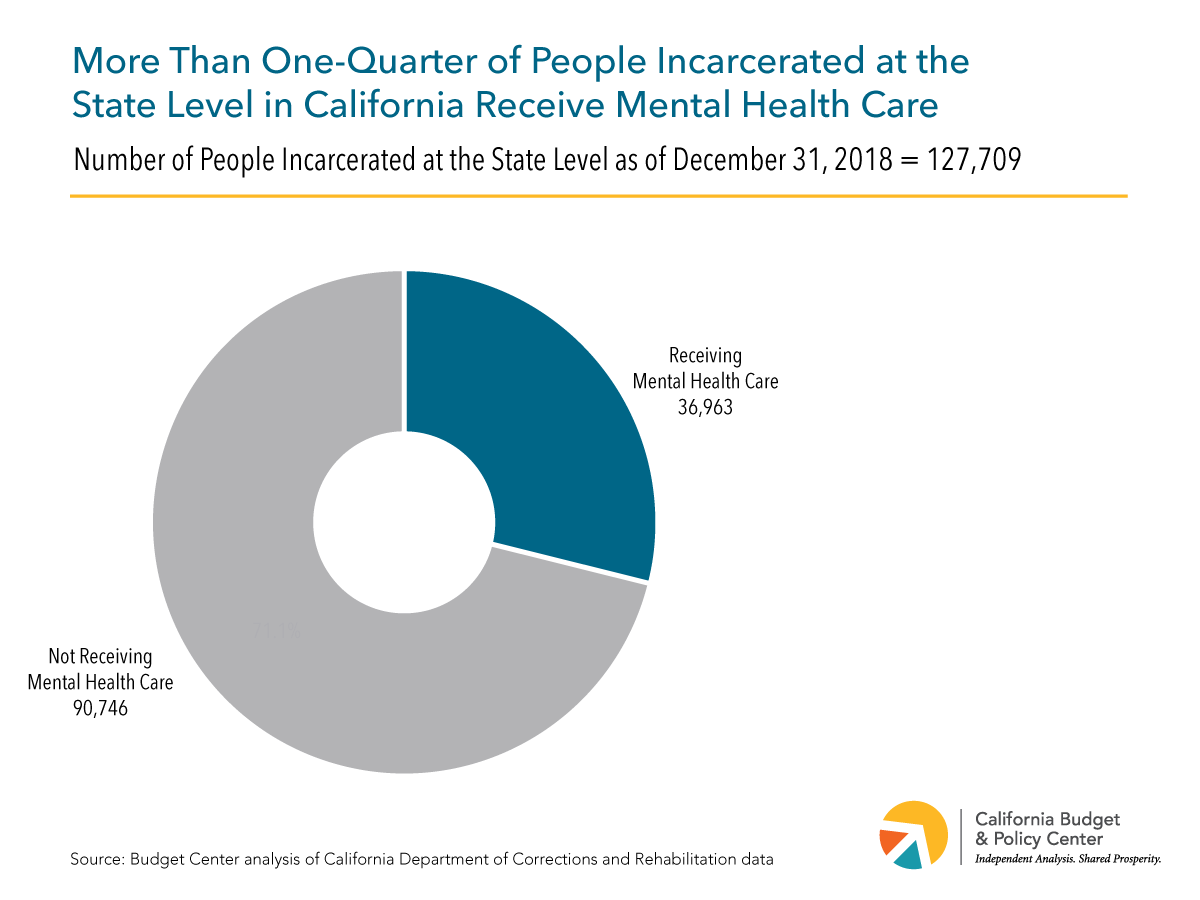
The fact that California spends hundreds of millions of dollars each year to provide mental health services in state prisons points to the prevalence of mental illness among incarcerated adults. Over 38,500 prisoners received mental health care in December 2017, the most recent month for which data are available.[2]

Moreover, the number of prisoners receiving mental health treatment has grown in recent years. In April 2013, these prisoners totaled 32,535 and accounted for less than 25% of all incarcerated adults.[3] By December 2017, this number had increased by more than 6,000 — to 38,561 — and was equal to nearly 30% of all incarcerated adults.[4] In contrast, during this same period the total number of adults incarcerated by the state declined by about 2,300, from 132,567 to 130,263.

Since the 1990s, a court-appointed officer has overseen mental health care delivery in California’s prisons to ensure that the state provides a constitutionally adequate level of care.[5] According to this officer, conditions are improving for prisoners who experience mental illness. “While more work remains to be done, [state officials] should take well-deserved encouragement from the progress they have made toward compliance.”[6]

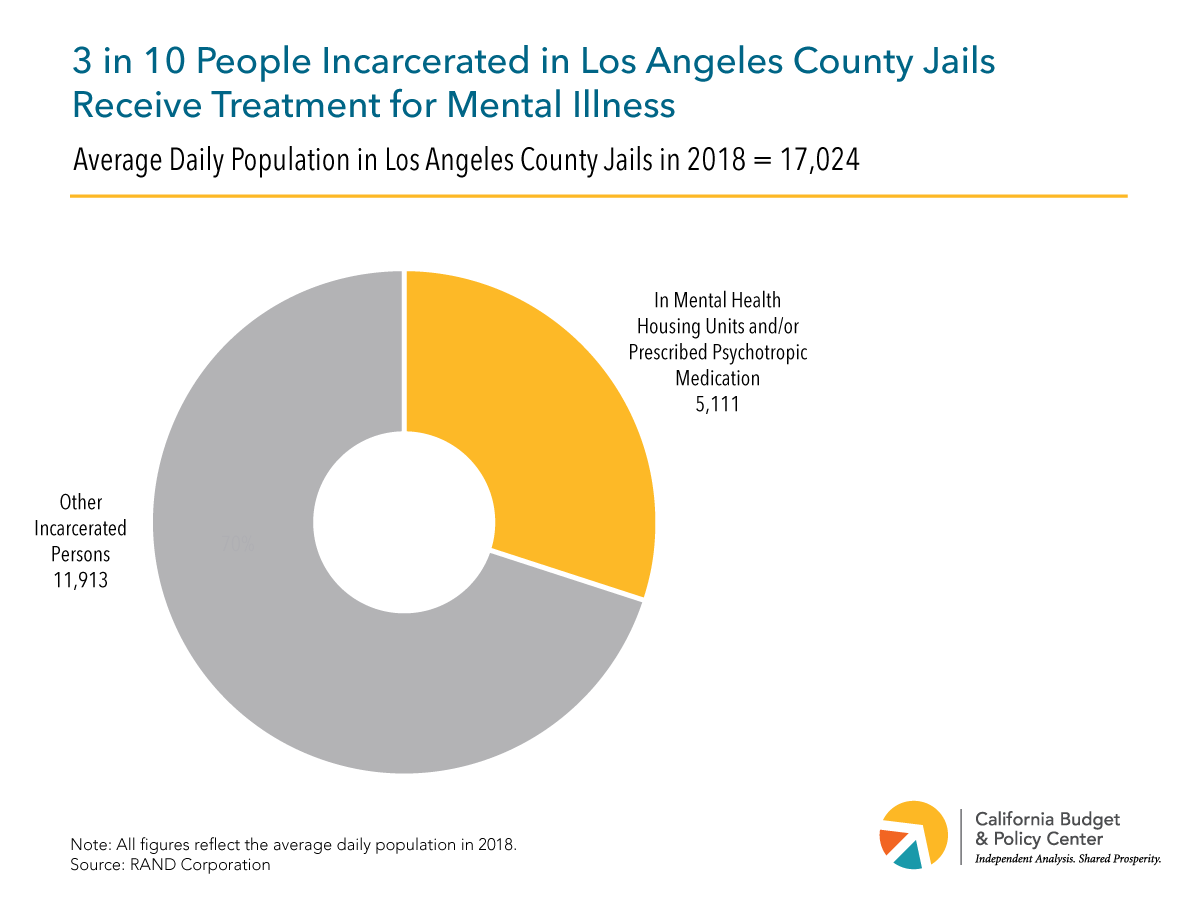
Other observers note that prisons “are singularly ill-suited to house the mentally ill.”[7] People experiencing mental illness “are especially sensitive to the unique stresses and traumas of prison life, and their psychiatric conditions often deteriorate as a result.”[8] While California must continue to improve mental health care for incarcerated adults, reforms are also needed to address “the intersection between mental illness and criminal justice” so that Californians who need mental health treatment receive the appropriate care and do not end up in state prisons (or local jails).[9]

Support for this Fact Sheet was provided by the California Health Care Foundation.


[1] As used in this Fact Sheet, spending on “state corrections” reflects all funds budgeted through the California Department of Corrections and Rehabilitation (CDCR) and the Board of State and Community Corrections for state operations and local assistance. Several categories in the chart reflect the cost of both services and administration. In the case of dental and mental health care, the Department of Finance (DOF) combines the costs of administering these services into a single expenditure category. The Budget Center estimated the respective shares of administrative spending for dental care vs. mental health care in state prisons based on a methodology recommended by the DOF.

[2] California Department of Corrections and Rehabilitation, Offender Data Points: Offender Demographics for the 24-Month Period Ending December 2017 (no date), pp. 4 and 15.

[3] Matthew A. Lopes, Jr., Twenty-Sixth Round Monitoring Report of the Special Master on the Defendants’ Compliance With Provisionally Approved Plans, Policies, and Protocols (May 6, 2016), p. 3.

[4] The reasons for this increase are unclear. The CDCR suggests it may reflect the state’s improved ability “to assess, diagnose, and respond to [prisoners’] mental health treatment needs” as the prison population has declined and mental health-related staffing has increased. California Department of Corrections and Rehabilitation, An Update to the Future of California Corrections (January 2016), pp. 12-13.

[5] See Legislative Analyst’s Office, Overview of Inmate Mental Health Programs (March 16, 2017), p. 1, and California Department of Corrections and Rehabilitation, Notice: Decision in Mental Health Care Class Action (Coleman v. Brown) (no date).

[6] Matthew A. Lopes, Jr., Twenty-Sixth Round Monitoring Report of the Special Master on the Defendants’ Compliance With Provisionally Approved Plans, Policies, and Protocols (May 6, 2016), p. 123.

[7] Stanford Law School Three Strikes Project, When Did Prisons Become Acceptable Mental Healthcare Facilities? (February 2015), p. 7.

[8] Stanford Law School Three Strikes Project, When Did Prisons Become Acceptable Mental Healthcare Facilities? (February 2015), pp. 7-8.

[9] Stanford Justice Advocacy Project, The Prevalence and Severity of Mental Illness Among California Prisoners on the Rise (May 2017), p. 8.

Stay in the know.

Join our email list!