
April 2019 | By Kayla Kitson
Download Full Data Hit
Join our email list!

The Budget Center hosted a special briefing event on the California Earned Income Tax Credit (CalEITC), a refundable state tax credit modeled after the federal EITC that helps people who earn little from their jobs afford basic necessities. As part of our Policy Perspectives Speakers Series, this event discussed Governor Gavin Newsom’s plans in the 2019-20 state budget proposal to significantly expand the CalEITC.
Join our email list!

Join our email list!
Join our email list!
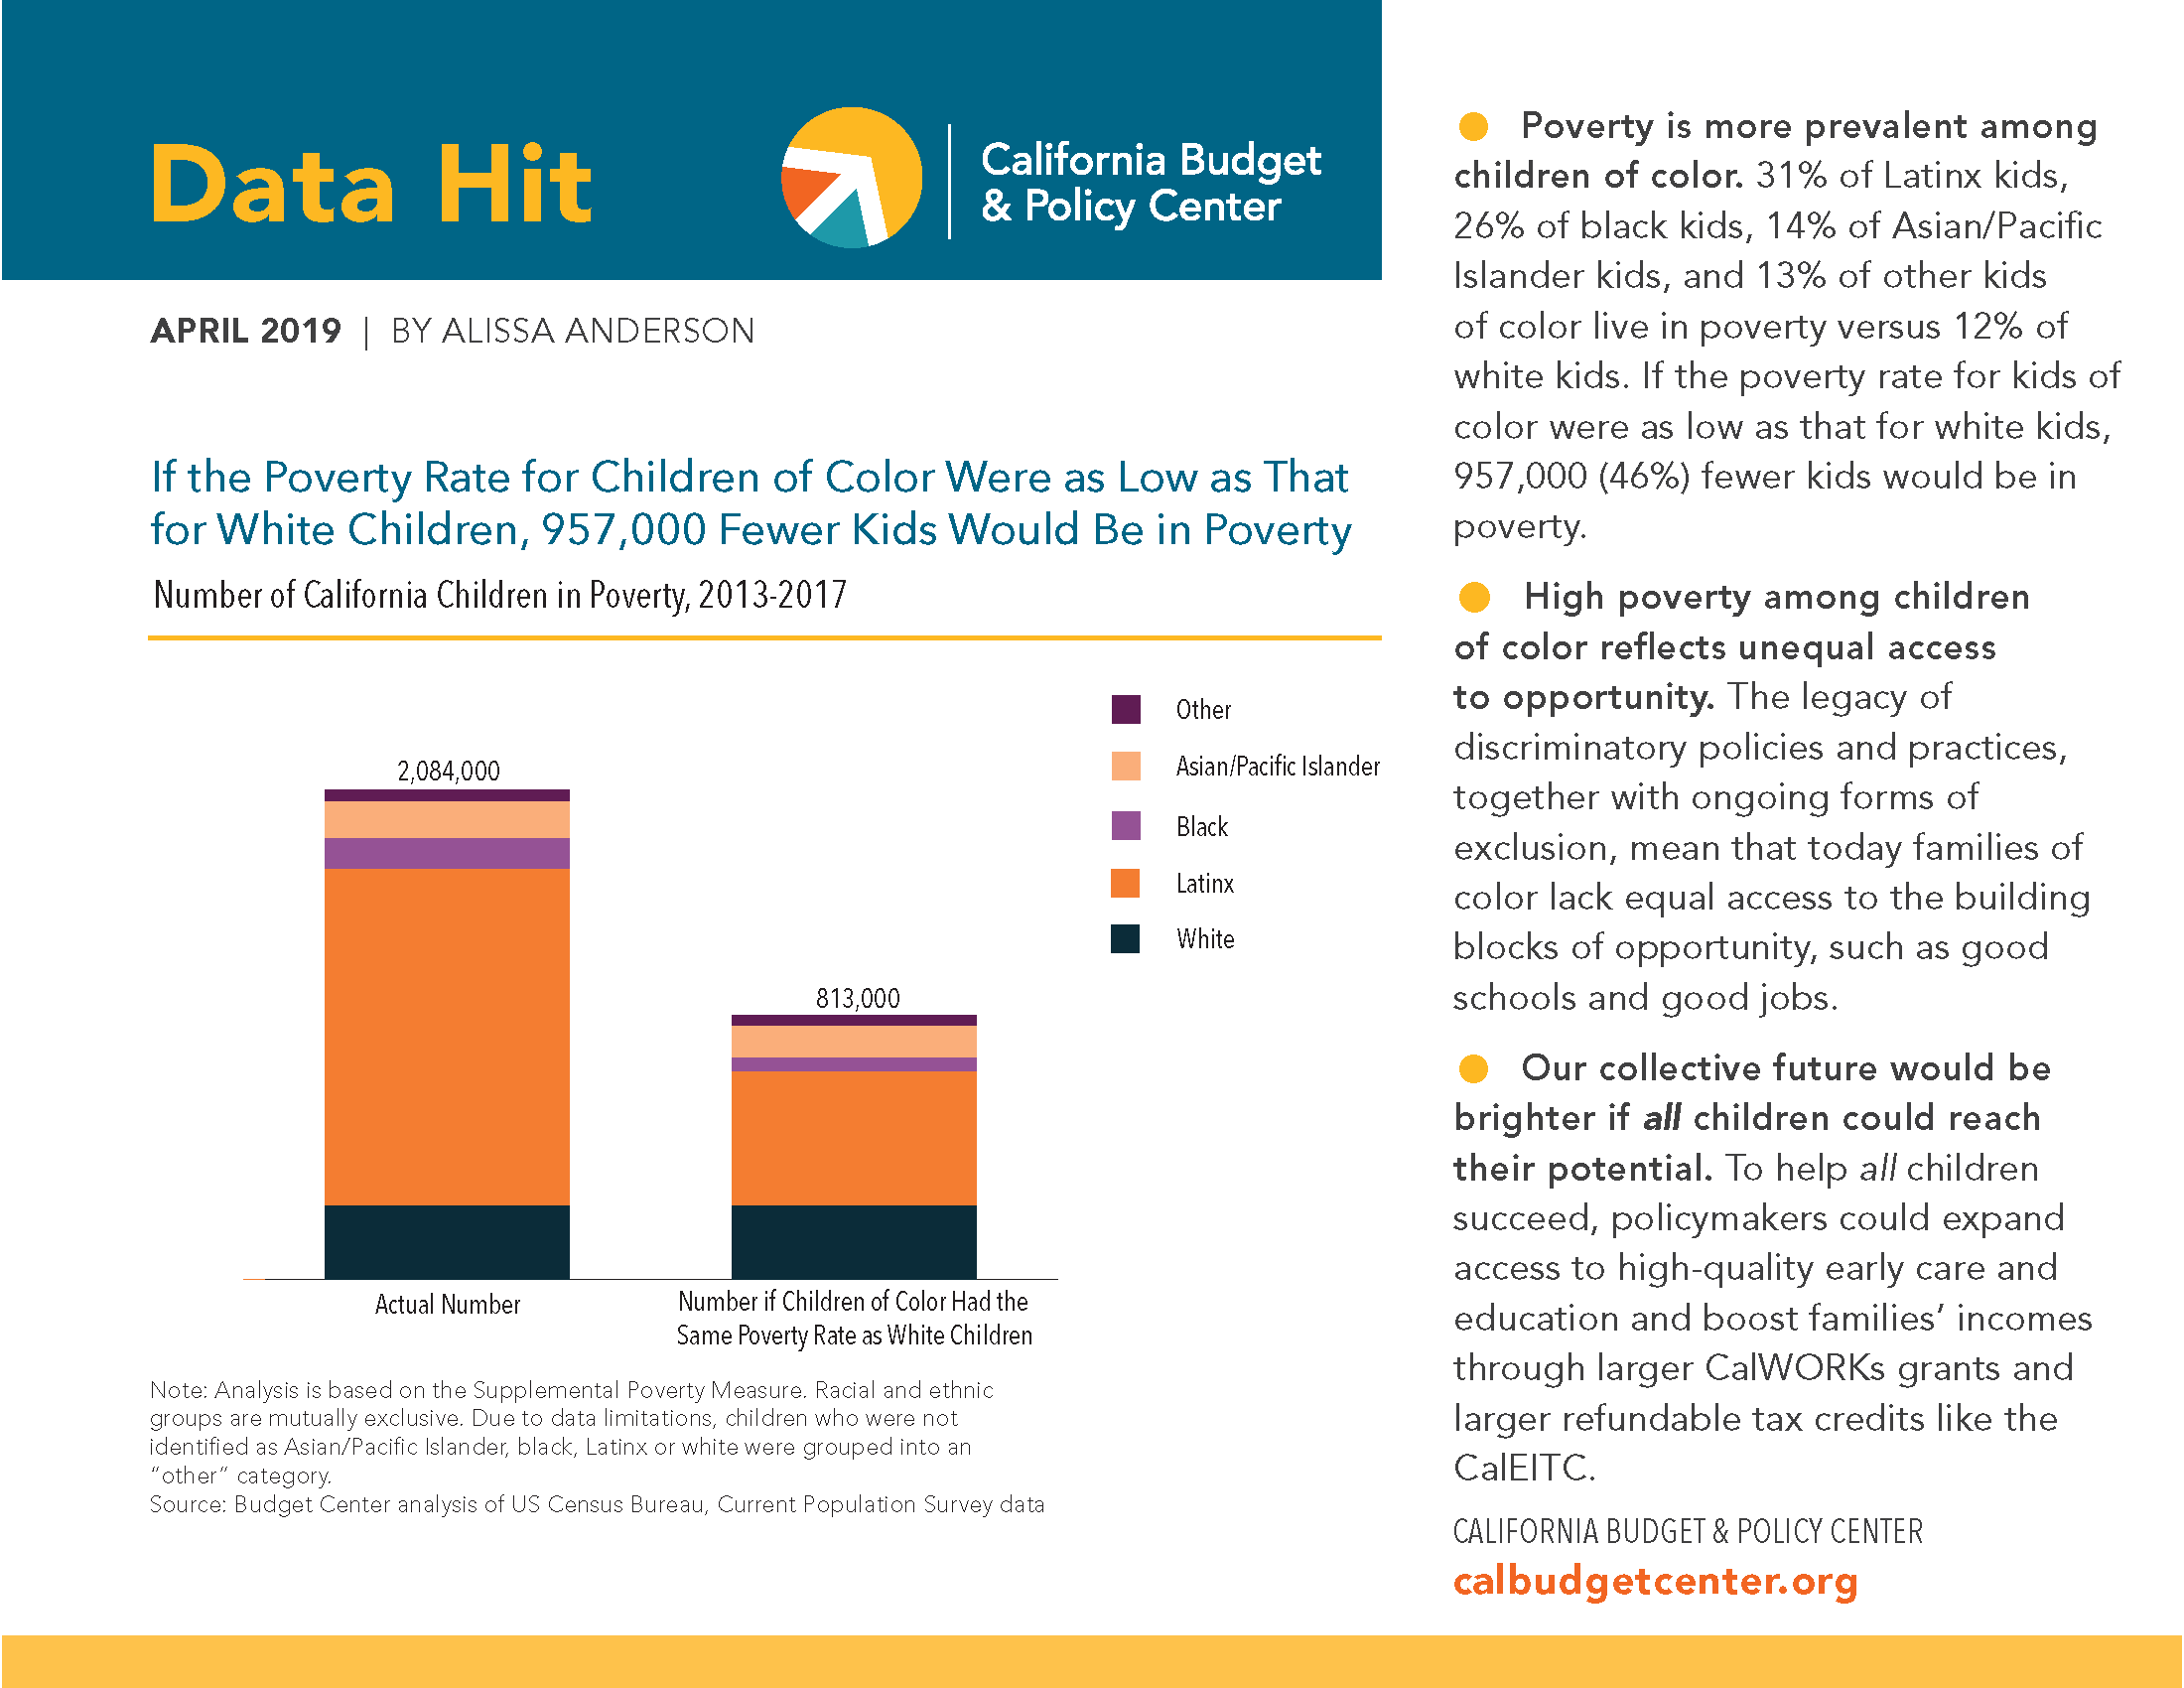
The California Budget & Policy Center hosted a special briefing event on the California Earned Income Tax Credit (CalEITC), a refundable state tax credit modeled after the federal EITC that helps people who earn little from their jobs afford basic necessities.
As part of our Policy Perspectives Speakers Series, this event discussed Governor Gavin Newsom’s plans in the 2019-20 state budget proposal to significantly expand the CalEITC. Budget Center analysts examined how this expansion would work, who would benefit from it, and issues policymakers should consider as this proposal moves forward. Speakers were:
Alissa and Sara’s comments drew from our latest guide, Expanding the CalEITC: A Smart Investment to Broaden Economic Security in California.

Join our email list!
The California Earned Income Tax Credit (CalEITC) is a refundable state tax credit that helps people who earn little from their jobs to pay for basic necessities. The CalEITC builds on the proven success of the federal earned income tax credit (EITC), which reduces poverty and boosts employment, and may even improve children’s health and educational attainment.
A new California Budget & Policy Center guide, Expanding the CalEITC: A Smart Investment to Broaden Economic Security in California, provides an overview of how EITCs support families, children, and communities; examines key features of the CalEITC; and shows how Governor Gavin Newsom’s 2019-20 budget proposal to significantly expand the credit will impact state residents with low incomes. The guide also highlights several ways that the CalEITC could be further strengthened, including by extending the credit to working immigrants who pay taxes and to unpaid family caregivers.
Join our email list!
California has two refundable income tax credits that boost the incomes of people who earn little from their jobs, helping them to afford necessities. These are:
These credits reduce the amount of state income tax California families and individuals owe based on how much they earn from work and how many qualifying children they live with. Since these credits are refundable, people who qualify for a credit that exceeds the amount of income tax they owe can receive the balance as a tax refund. This means that families and individuals who do not owe any state income tax can get the full credit that they qualify for as a refund.
Two federal refundable income tax credits are also available to families and individuals who earn little from work. These are:
This updated interactive tool estimates how much people can expect to receive from all four of these credits in tax year 2019 based on their tax filing status, number of children, and annual earnings from work. The additional chart below the interactive shows on a smaller scale the two credits that individuals without children may qualify for – the federal EITC and CalEITC.

Join our email list!
For Thrive, the Alliance for Nonprofits for San Mateo County’s “Tax Time Matters,” Senior Policy Analyst Sara Kimberlin presented on how the California Earned Income Tax Credit (CalEITC) boosts economic security for low-income workers and the Governor’s proposal to significantly expand the credit in the 2019-20 state budget.
Join our email list!
|
|
|
|