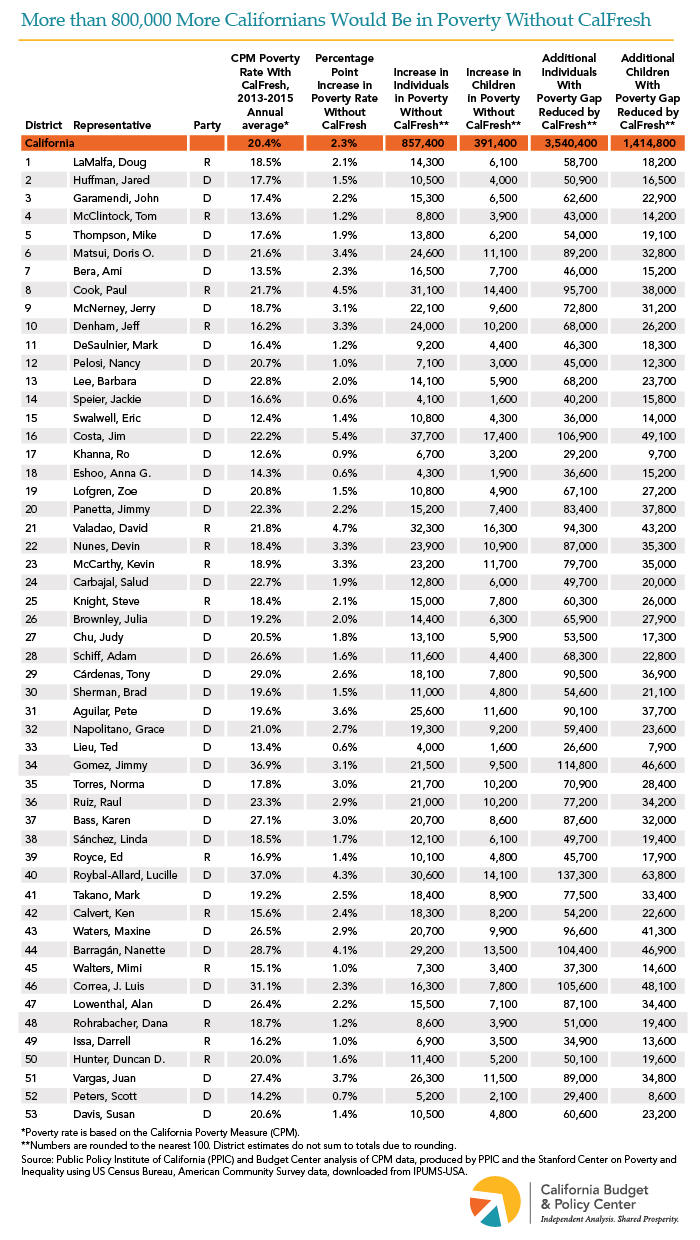
Food assistance provided by the Supplemental Nutrition Assistance Program (SNAP) — known as CalFresh in California — significantly reduces the rate and severity of poverty throughout the state. Without CalFresh, the poverty rate would have been higher in every California congressional district from 2013 to 2015, according to updated California Poverty Measure data recently produced by the Public Policy Institute of California and the Stanford Center on Poverty and Inequality. During this period, CalFresh reduced the poverty rate by 2.3 percentage points statewide, with the largest reductions — up to 5.4 percentage points — in districts in the Central Valley (see maps below.) More than 30,000 people per year would have been in poverty without CalFresh in Districts 16 (D-Costa), 21 (R-Valadao), 8 (R-Cook), and 40 (D-Roybal-Allard). Food assistance through CalFresh also lessened the severity of poverty for 3.5 million more people per year across California by reducing their poverty gap, or the shortfall between a family’s level of resources and the poverty threshold.
Congress will soon need to reauthorize the Farm Bill, which sets eligibility and funding levels for SNAP, but both President Trump and some congressional leaders have proposed cutting federal support and limiting who is eligible. Cuts like these would greatly reduce the effectiveness of one of California’s most important tools to mitigate poverty.
There was a problem processing your signup. Please try again. Or contact us
Please check your email to confirm your signup.
Supplemental Security Income/State Supplementary Payment (SSI/SSP) grants are a critical source of basic income for well over 1 million low-income people with disabilities and adults age 65 or older in California. Grants are funded with both federal (SSI) and state (SSP) dollars. Currently, the maximum monthly grant for an individual is about $911, which consists of an SSI grant of $750 and an SSP grant of $160.72. In order to help close budget shortfalls during the Great Recession, state policymakers made deep cuts to the SSP portion of the grant, reducing it from $233 per month in early 2009 to $156.40 per month by mid-2011. With an improving fiscal outlook, state policymakers increased the SSP portion by a modest $4.32 per month starting in January 2017. However, no additional state increases have been provided since then, and the Governor’s proposed 2018-19 state budget assumes that the SSP portion will remain frozen for another year. Because state cuts largely remain in place, SSI/SSP recipients have less money in their budgets to buy basic necessities such as medicine and food. (People enrolled in the SSI/SSP program are not eligible for CalFresh food assistance.) They also have less money to pay the rent. In fact, in every county, the “Fair Market Rent” (FMR) for a studio apartment exceeds 50% of the maximum SSI/SSP grant for an individual. People are at greater risk of becoming homeless when housing costs account for more than half of household income.
There was a problem processing your signup. Please try again. Or contact us
Please check your email to confirm your signup.
Supplemental Security Income (SSI) provides federally funded cash assistance to help low-income seniors and people with disabilities pay for housing, food, and other necessities. The maximum monthly SSI grant for most recipients in California is currently $750 per month — about 74% of the federal poverty line for an individual. Also, California funds a State Supplementary Payment (SSP), which provides up to an additional $160.72 per month for most recipients. Yet, the combined maximum SSI/SSP grant for an individual — $910.72 per month — is still equal to only 90% of the poverty line. SSI/SSP funding is expected to total $9.6 billion in the current fiscal year (2017-18), with the federal government providing $7.1 billion and the state, $2.5 billion. SSI/SSP recipients live in all 53 of California’s congressional districts. For example, in the 23rd District, represented by House Majority Leader Kevin McCarthy (R-Bakersfield), nearly 27,000 residents rely on SSI/SSP to help make ends meet. In the 12th District, represented by House Minority Leader Nancy Pelosi (D-San Francisco), more than 38,000 residents are enrolled in SSI/SSP. Republican proposals to scale back federal support for the safety net could include reductions to SSI. Any such cuts would be a further blow to SSI/SSP recipients who already struggle with California’s high cost of living.
There was a problem processing your signup. Please try again. Or contact us
Please check your email to confirm your signup.
The Supplemental Nutrition Assistance Program (SNAP) is the country’s largest anti-hunger program. SNAP benefits are 100% federally funded and help families and individuals put food on the table by paying for a minimally adequate diet. Research shows that SNAP yields important long-term benefits in terms of participants’ economic self-sufficiency, health, and educational attainment, especially for children.[1]
In California, SNAP — known as CalFresh — serves a particularly vulnerable population. On average, almost 4.3 million Californians received CalFresh assistance each month during the 2016 federal fiscal year. Over half of these participants were children, and another 7.2% were either people with disabilities or adults age 60 or older.[2] Of younger adults without disabilities who receive CalFresh benefits, more than half lived with children.[3]
By increasing purchasing power for millions of Californians, CalFresh plays a crucial role in fighting poverty. With an average CalFresh household living on a gross income of $707 a month, the $281 average monthly benefit boosted their resources by 40%.[4] Without CalFresh food assistance, 22.7% of Californians would have lived in poverty and 7.0% would have lived in deep poverty in 2013-2015.[5] However, because of CalFresh, the poverty and deep poverty rates are actually 20.4% and 5.8%, respectively.[6]
Despite being one of the most effective anti-poverty programs, SNAP faces growing threats from federal policymakers. On February 12, the Trump Administration released the President’s budget for the 2019 federal fiscal year, which proposes slashing SNAP funding by over $213 billion (nearly 30%) over 10 years, including by narrowing eligibility and cutting benefits.[7] These changes would harm those who rely on food assistance, including the growing population of older Californians who already struggle to put food on the table.[8] Instead of targeting SNAP benefits, policymakers should focus on strengthening its ability to reduce hunger, ease hardship, and improve child well-being.
[8] Budget Center analysis of the California Health Interview Survey, 2011-2015. More than one-quarter of Californians age 65 or older (27.1%) report that they cannot afford enough food.
There was a problem processing your signup. Please try again. Or contact us
Please check your email to confirm your signup.
The California Work Opportunity and Responsibility to Kids (CalWORKs) program is a critical component of California’s safety net for families with low incomes. CalWORKs supports about 860,000 children throughout the state by providing families with modest monthly cash grants, while helping parents overcome barriers to employment and find work. Policymakers made a number of cuts to CalWORKs during and after the Great Recession, including reducing grant levels and eliminating the annual state cost-of-living adjustment (COLA). Recent years’ budgets have incrementally increased CalWORKs grant levels, but this has not been adequate to restore cuts made in prior years.
The Governor’s proposed budget for 2018-19 — the fiscal year that begins this coming July 1 — does not increase CalWORKs grants or reinstate the COLA, despite the fact that state revenues are projected to exceed expenditures by billions of dollars. If grant levels remain frozen, the proposed maximum monthly grant for a family of three in a high cost county would be $9 lower than in 2007-08, without adjusting for inflation. If grant levels had been adjusted for inflation each year beginning in 2007-08, the maximum grant in 2018-19 would be $983, which is $269 higher than the proposed value of $714. Because policymakers have not restored the value of CalWORKs grants, the purchasing power of the maximum grant will be 27% lower than in 2007-08. This severely reduces the resources that parents could use to provide food for their family, keep their homes warm, or avoid an eviction.
For a decade following the implementation of welfare reform in 1998, the annualized maximum grant for a family of three hovered just above the deep-poverty line — defined as 50% of the federal poverty line. In 2008, however, the value of this grant dropped below the deep-poverty line. Absent a significant grant increase in the 2018-19 fiscal year, this grant will equal just 41.2% of the poverty line, leaving it below the deep-poverty line for the eleventh straight calendar year.
Despite the state’s strong economic growth in recent years, the choices policymakers made during and after the Great Recession continue to hold back families participating in CalWORKs. Due to the fact that state revenues are projected to exceed expenditures by billions of dollars, the 2018-19 fiscal year offers state policymakers the opportunity to boost the economic security of very-low-income families with children. Policymakers should implement a multi-year plan for raising CalWORKs grants and restore the state COLA to ensure that this important program is better able to assist families in California.
There was a problem processing your signup. Please try again. Or contact us
Please check your email to confirm your signup.
The data set for this analysis is available for download.
For decades, California took a “tough on crime” approach to criminal and juvenile justice. Harsh, one-size-fits-all sentencing policies such as the 1994 “Three Strikes and You’re Out” law emphasized punishment over rehabilitation and significantly lengthened prison sentences. These and other policies greatly increased the number of adults incarcerated by the state and contributed to the creation of a bloated and costly correctional system. This shift toward a “do the crime, do the time” philosophy also affected California youth involved with the juvenile justice system. In 2000, for example, the voters passed Proposition 21, which required more youth accused of crimes to be tried in adult court, among other changes.
In recent years, however, California has fundamentally reformed its approach to criminal and juvenile justice through legislation and at the ballot box. These reforms have aimed to reduce incarceration, promote more effective pathways to rehabilitation, prevent crime, and spend tax revenues more wisely. These policy changes largely stemmed from litigation against the state that prompted judicial intervention, with the most prominent example being the 2009 federal court order — subsequently upheld by the US Supreme Court — requiring California to reduce overcrowding in state prisons. Significant reforms include:
The California Community Corrections Performance Incentives Act (Senate Bill 678 of 2009). This legislation created financial incentives for counties to reduce the number of adult felony probationers sent to state prison, including by reducing recidivism through the use of “evidence-based” (scientifically proven) supervision practices.
Public safety realignment (Assembly 109 of 2011). The state transferred, or realigned, to counties the responsibility for managing and supervising adults convicted of certain “lower-level” felonies, effective October 1, 2011. (Previously, these individuals would have served state prison sentences and been released to state parole.) Counties receive constitutionally protected funding from the state each year to carry out these responsibilities.
Prop. 36 of 2012. This ballot initiative amended the state’s “three strikes” law to shorten prison sentences for many people who receive a third strike for a nonviolent, nonserious felony.
Prop. 47 of 2014. This ballot initiative reclassified certain drug and property crimes as misdemeanors, thus helping to reduce the number of adults incarcerated in state prisons as well as in county jails.
Prop. 57 of 2016. This ballot initiative established new policies to address overcrowding in state prisons. Specifically, the measure 1) created a new parole consideration process for state prisoners serving a sentence for a nonviolent felony offense and 2) gave state officials broad new authority to award sentencing credits to reduce the amount of time that people spend in prison. Prop. 57 also changed state law to require juvenile court judges to decide whether youth should be tried in adult court.
On the whole, these reforms have provided an opening for counties to reassess how they respond to crime as well as how they address incarceration — two key areas of county budgets. In an effort to highlight counties’ individual approaches in these areas, this analysis examines county spending on both incarceration and responding to crime for selected fiscal years from 1990-91 to 2015-16. This analysis includes four components: 1) an interactive tool below that shows inflation-adjusted expenditures as well as spending as a share of each county’s budget; 2) individual county Fact Sheets below that display the same spending data; 3) a downloadable Excel file that includes the full data set produced by this analysis; and 4) a Technical Appendix that describes the methodology.
Click below to get the Fact Sheet for your county.
Note: The City and County of San Francisco is excluded from the analysis because the State Controller’s Office does not provide information for San Francisco that is comparable to the data reported for the state’s other 57 counties.
There was a problem processing your signup. Please try again. Or contact us
Please check your email to confirm your signup.
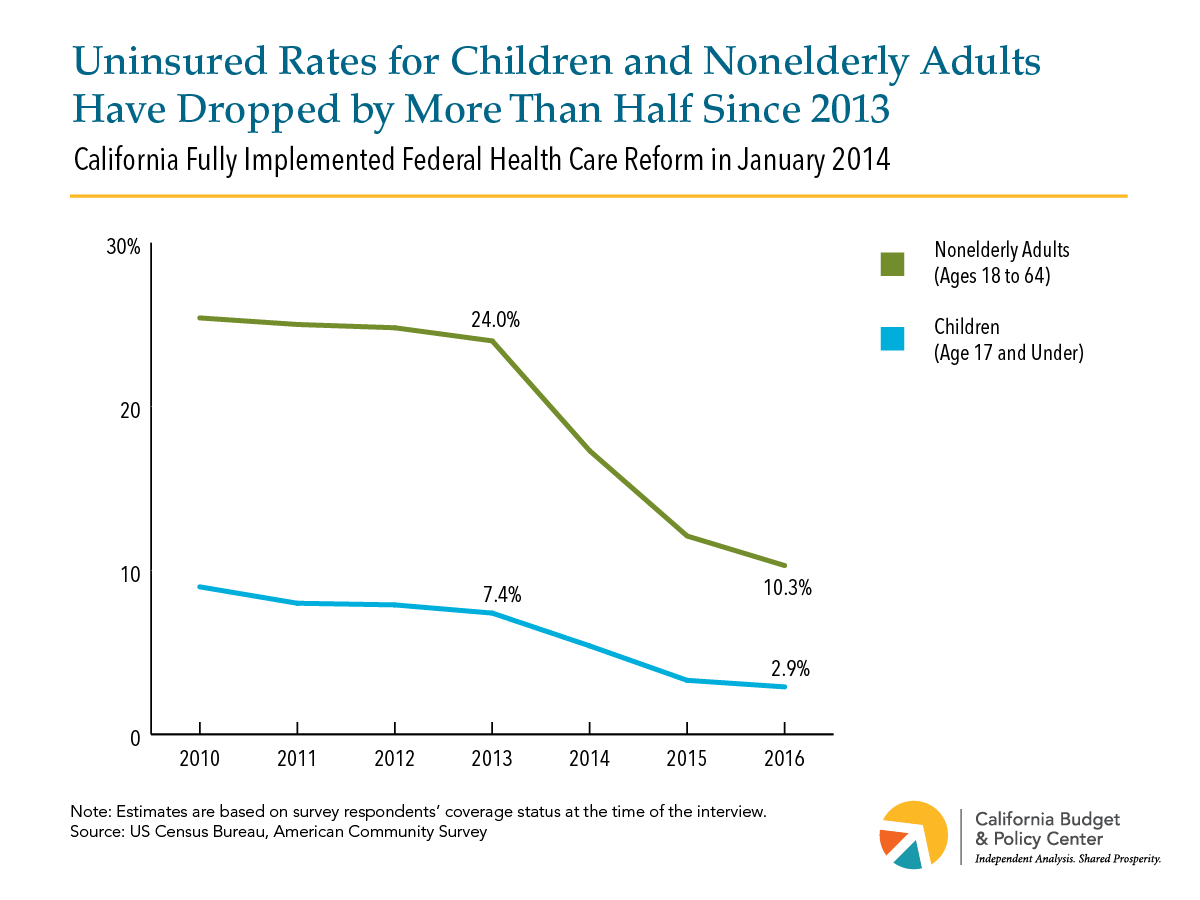
The federal Affordable Care Act (ACA), signed into law by President Obama in 2010, has helped to substantially reduce uninsured rates in California. US Census Bureau figures released last weekshow that:
3 out of every 100 children (2.9%) lacked health care coverage in 2016 (see Figure 1). This is down by over two-thirds since 2010 and by more than half since 2013, the year before California fully implemented the ACA.
The uninsured rate for adults ages 18 to 64 also has fallen, but remained at a relatively high 10.3% in 2016.
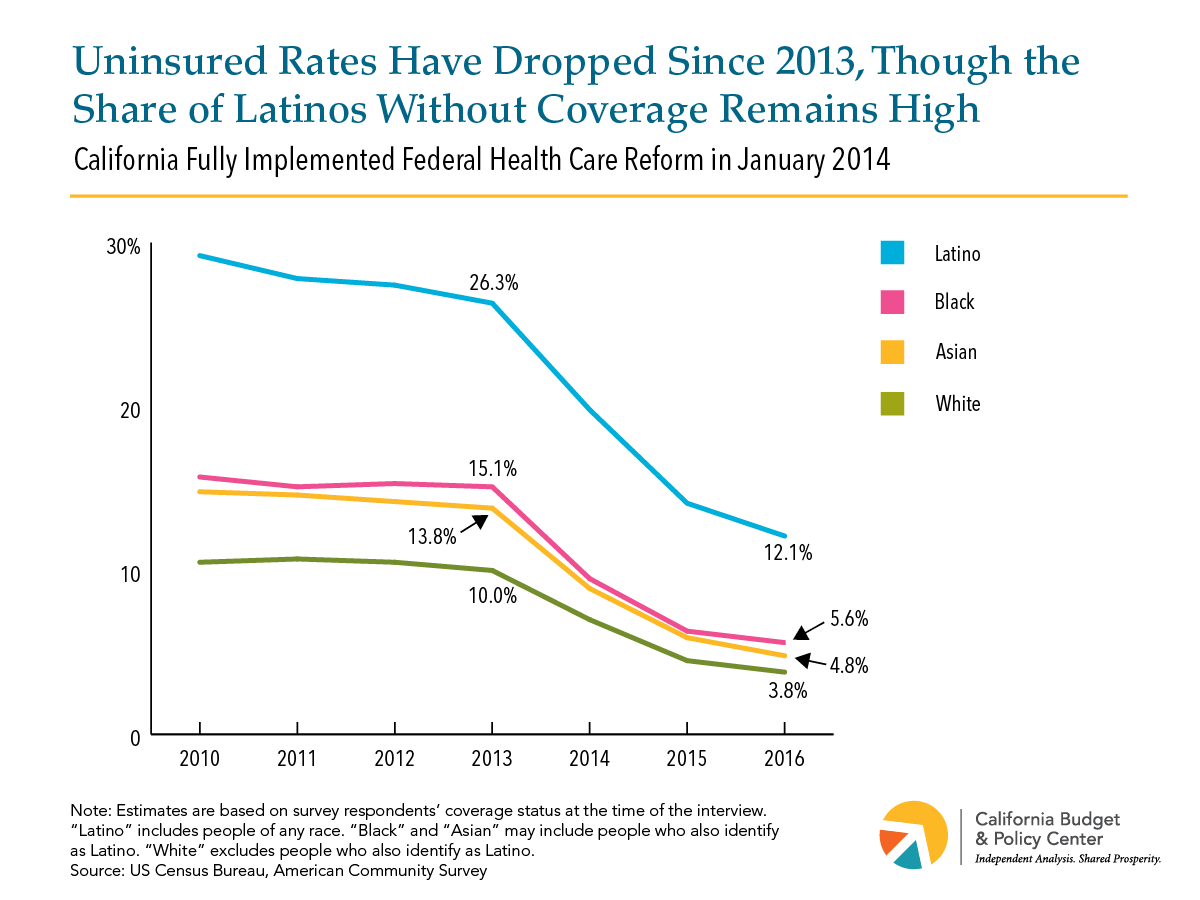
Uninsured rates for Asian, black, and white Californians declined by over 60% from 2013 to 2016 (see Figure 2).
The share of Latinos without coverage also has dropped, though Latinos’ uninsured rate remained in double digits in 2016 (12.1%).
Further reducing uninsured rates would require improving the ACA. Yet, the President and some congressional leaders continue trying to roll back health care reform. A new US Senate plan to dismantle the ACA and deeply cut federal funding for Medicaid — the Graham-Cassidy proposal — would likely cause millions of Californians to lose coverage.
There was a problem processing your signup. Please try again. Or contact us
Please check your email to confirm your signup.
Whether renting an apartment or seeking to purchase a home, Californians face very high housing costs in many parts of the state.
High Rents Are Unaffordable to Households with Low and Moderate Incomes
Typical rents for a modest two-bedroom apartment in the areas where nearly two-thirds of Californians live are $1,500 or more per month — a level that is unaffordable for residents with low and moderate incomes.[1] Affordable housing costs are defined by the US Department of Housing and Urban Development (HUD) as costing 30 percent or less of household income. By HUD’s standard, a family would need at least $60,000 in annual income to afford a monthly rent of $1,500 — an income that would require 110 hours of work per week at the current state minimum wage of $10.50 per hour.[2]
However, rents vary substantially across California. Rents are highest in coastal urban areas, while rents in the Central Valley and in northern inland areas are significantly less expensive, in many cases less than $1,000 per month for a modest two-bedroom apartment. Nonetheless, even these more affordable rents are beyond the reach of many Californians. Rent that is affordable for a full-time minimum-wage worker can be no more than $546 per month — which is lower than HUD’s two-bedroom Fair Market Rent in every part of California.[3] This means that a single parent working full-time at minimum wage cannot expect to afford a modest two-bedroom apartment for her family anywhere in California.
High Home Prices Put Ownership Out of Reach for Californians With Moderate Incomes
For many middle-income Californians, buying a home is an important goal and part of achieving the “American dream” — but home purchase prices are out of reach for many households with moderate incomes.
Two-thirds of Californians live in areas where the median sales price for a single-family home is $500,000 or more. To purchase a half-million-dollar home while keeping housing expenses to no more than 30 percent of income requires an annual income of roughly $145,000, well over twice the state median household income. In addition to the high annual income required to afford monthly ownership expenses, making a 20 percent down-payment on a home that costs half a million dollars requires $100,000 in savings. Furthermore, nearly 1 in 10 Californians live in a county where the median sales price for a single-family home is $1 million or more — only affordable to households with annual incomes of roughly $244,000 or more, with $200,000 in savings required for a 20 percent down-payment.
Like rents, home sales prices vary greatly throughout the state. In many inland areas of the state, typical home prices are less than $250,000. However, these less expensive areas tend to have substantially lower household incomes than the more expensive parts of the state. In fact, even in the county with the least-expensive median home price (Lassen County), the income required to afford the median-priced home is more than 150 percent of the local median income.
Policies That Slow the Growth in Housing Costs Can Help Families and the State Economy
California’s high housing costs create serious burdens for families and individuals with low incomes, who are likely to struggle to afford typical rents even when working full-time. Those with moderate incomes are affected by the state’s high housing costs as well, as high home sale prices put the dream of homeownership out of reach for many. High housing costs can also restrict the ability of families to relocate to access jobs or move close to family, and can push families to live farther from their jobs, leading to longer commutes, which cause increased pollution and reduced time with family. High housing costs also negatively affect the state economy by making it more difficult for employers to recruit workers and deterring individuals from moving to or remaining in California, thus limiting the available labor force and dampening economic growth.
Policy solutions are urgently needed to prevent housing costs from further escalating and to make more housing available that is affordable to lower-income households. Strategies such as subsidizing the development of affordable housing and facilitating more private housing production can help increase the supply of housing, including units affordable to residents with low incomes, thus reducing pressure on costs. These and other policy approaches need to be seriously considered in order to address the negative impacts of California’s high housing costs.
Endnotes
[1] Rents reflect Fair Market Rents (FMR) for 2017, published annually by the US Department of Housing and Urban Development. FMRs are based on the 40th percentile (in a few cases 50th percentile) of gross rents, or rent including utilities, paid by renters within a specific metropolitan area or rural county who moved into their housing units within the past 15 months. FMRs are broadly representative of typical rents paid within a metropolitan area, and are adjusted by HUD to account for expected inflation in housing costs, but they may be lower than the current asking rents for vacant apartments in particularly high-demand cities or neighborhoods within a larger metropolitan area, or in areas where asking rents have been increasing very rapidly.
There was a problem processing your signup. Please try again. Or contact us
Please check your email to confirm your signup.
This website uses cookies to analyze site traffic and to allow users to complete forms on the site. The California Budget & Policy Center does not share, trade, sell, or otherwise disclose personal information. By using our website you agree to our Privacy Policy.