California is well-known for its high housing costs. Yet, to understand the state’s housing affordability problem, it is important to consider California’s housing costs relative to incomes. If high housing costs are matched by high incomes, then expensive housing may be affordable to many households. At the same time, even relatively low housing costs may be unaffordable if local incomes are also low. Unfortunately, while housing costs vary across California, housing affordability is clearly a problem throughout the state when housing costs are compared to incomes.
Renters Are Especially Likely to Have Unaffordable Housing Costs, While Homeowners Without Mortgages Are Least Affected
For renters, housing costs include monthly rent payments, plus the cost of utilities if not included in the rent. Housing costs for homeowners include monthly mortgage principal and interest payments, plus property tax, property insurance, utilities, and condo or mobile home fees (if applicable). For housing costs to be considered affordable, these total costs should not exceed 30 percent of household income, according to the US Department of Housing and Urban Development. Households paying more than 30 percent of income toward housing are considered housing “cost-burdened,” and those with housing costs that exceed half of income are considered “severely” cost-burdened. Across California, more than 4 in 10 households had unaffordable housing costs, exceeding 30 percent of household income, in 2015. More than 1 in 5 households statewide faced severe housing cost burdens, spending more than half of their income toward housing expenses.
Unaffordable housing costs particularly affect renters, and also affect a substantial share of homeowners with mortgages. More than half of renter households and more than a third of mortgage holders paid over 30 percent of income toward housing in 2015. Owners without mortgages are less likely to face high housing burdens. Besides not having the monthly expense of a mortgage, many of these homeowners have been in their homes for decades and therefore benefit from relatively low property taxes due to Proposition 13’s limitation on property tax increases.

Low-Income Households and People of Color Are Particularly Affected by Unaffordable Housing
Households with lower incomes are especially likely to have housing costs that are unaffordable. More than 8 in 10 low-income households (those with incomes of less than 200 percent of the federal poverty line) were housing cost-burdened in 2015, and more than half of households spent more than half their income on housing. At the same time, only 15 percent of high-income households (with incomes of 400 percent or more of the federal poverty line) were housing cost-burdened in 2015, and less than 3 percent were severely cost-burdened.

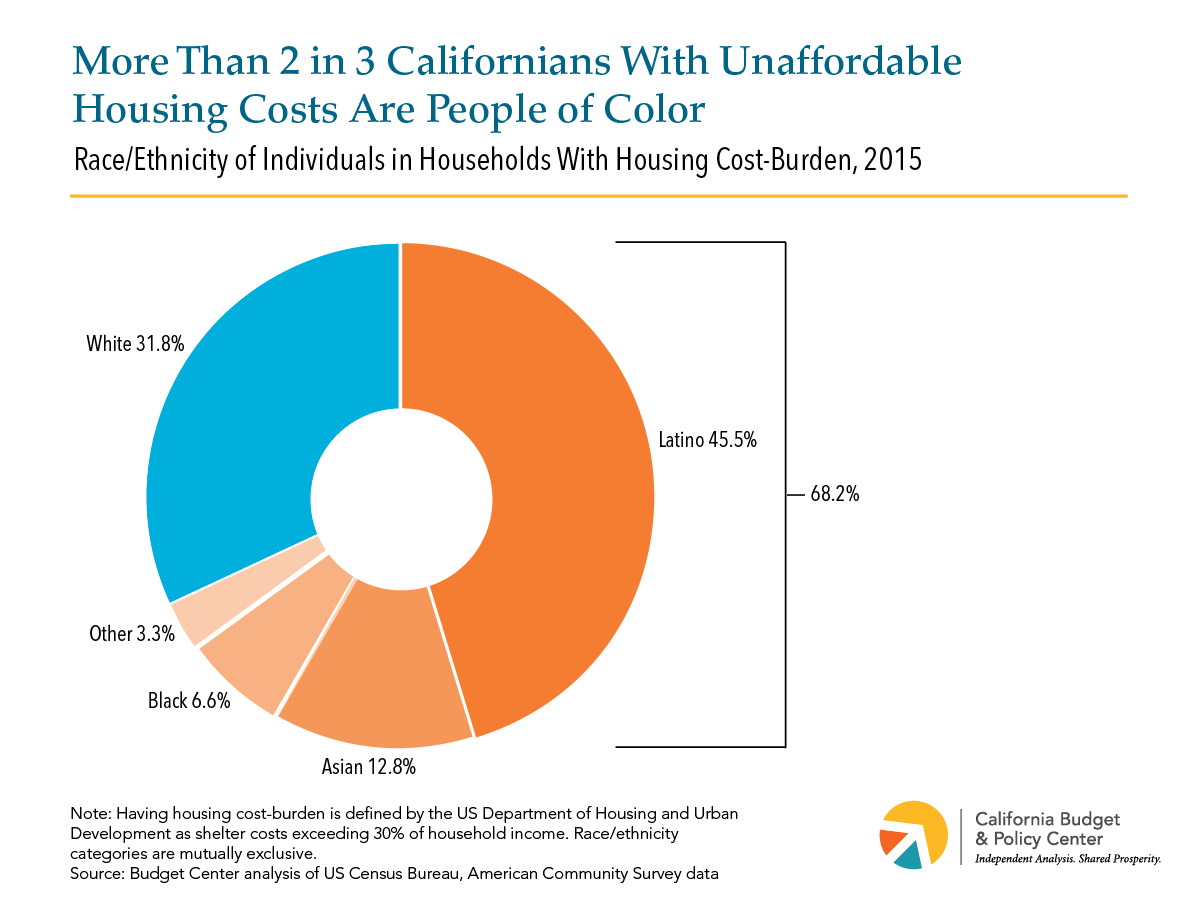
Many of the individuals affected by unaffordable housing costs are people of color. Among all Californians paying more than 30 percent of income toward rent in 2015, more than two-thirds were people of color, and about 45 percent were Latino.
Housing Affordability Is a Problem in All Regions of California
Housing costs vary substantially throughout California, with the highest costs in coastal urban areas and the lowest costs in inland rural areas. But incomes also vary regionally, and areas with relatively lower housing costs also tend to have lower typical incomes. The result is that housing cost-burden is high throughout the state. Across every region of California, from the high-cost San Francisco Bay Area and Los Angeles to the lower-cost Central Valley and Far North, at least a third of households spent more than 30 percent of their incomes toward housing in 2015, and at least 1 in 6 spent more than half their incomes on housing costs.

High Housing Cost-Burdens Call for Policies Designed to Increase the Supply of Housing and Help Families Meet Basic Needs
What problems arise when households pay more than they can afford for housing? Unaffordable housing costs can force families to spend less on other basic necessities like health care or food, to cut costs by seeking lower-quality child care, and to under-invest in important assets like education or retirement savings.
Given the challenges of housing affordability across all regions of California — especially for renters, households with lower incomes, and people of color — there is a need for strategies to increase affordability in every part of the state. Policies that increase local incentives and local accountability for accommodating more housing development, including development of housing affordable to lower-income households, are one approach to increasing the supply of housing in all parts of California, and thus reducing upward pressure on housing costs in order to improve affordability. Funding to support affordable housing construction and preservation can also help. Moreover, policies outside of the housing arena that help families make ends meet — by reducing costs for child care, food, or other necessities, or by supplementing incomes — represent another important approach to reducing the negative impact of unaffordable housing costs.