Supplemental Security Income/State Supplementary Payment (SSI/SSP) grants are a critical source of basic income for well over 1 million low-income people with disabilities and adults age 65 or older in California. Grants are funded with both federal (SSI) and state (SSP) dollars. Currently, the maximum monthly grant for an individual is roughly $896, which consists of an SSI grant of $735 and an SSP grant of $160.72. In order to help close budget shortfalls during the Great Recession, state policymakers made deep cuts to the SSP portion of the grant, reducing it from $233 per month in early 2009 to $156.40 per month by mid-2011. With an improving fiscal outlook, policymakers recently provided a state cost-of-living adjustment to the SSP portion, effective January 2017. However, this modest increase — $4.32 per month for individuals — represents only a small step toward restoring the SSP portion to its pre-recession value. Because state cuts largely remain in place, the full SSI/SSP grant continues to lose ground to housing costs, which have risen throughout much of California in recent years. For example, in every county, the “Fair Market Rent” (FMR) for a studio apartment exceeds 50% of the maximum SSI/SSP grant for an individual. People are at greater risk of becoming homeless when housing costs account for more than half of household income.
There was a problem processing your signup. Please try again. Or contact us
Please check your email to confirm your signup.
California’s K-12 education spending per student has increased significantly since 2012-13, but continues to trail the nation as a whole. While not reflective of how much it actually costs to provide California’s students a high-quality education, rankings of state K-12 education spending are often used to assess California’s public investment in its schools.[1] According to the most recent available information,
In 2015-16, California ranked 41st among all states in spending per K-12 student after adjusting for differences in the cost of living in each state (see table below).[2] California schools spent $10,291 per K-12 student in 2015-16, which is about $1,900 less than the $12,252 per student spent by the nation as a whole.[3] California’s spending per student in 2015-16 was about $2,000 higher than it had been in 2012-13, at which point California ranked 50th in the nation.
California ranked 37th among all states in K-12 spending as a share of the state economy in 2015-16. California’s K-12 school spending in 2015-16 was 3.29% of state personal income — a measure that reflects the size of the state’s economy — compared to 3.78% in the nation as a whole. In 2012-13, California’s K-12 school spending equaled 3.18% of state personal income — compared to 3.93% in the nation as a whole — and ranked 46th among all states. Gauging school spending as a share of the personal income received by the state’s residents can be useful because it takes into account differences in states’ wealth and thus in their capacity to support K-12 schools.
California ranked last in the nation in the number of K-12 students per teacher in 2015-16. California’s student-to-teacher ratio in 2015-16 was greater than 22-to-1, more than 40% higher than the national ratio of 15.4 students per teacher. California had also ranked last in the nation in the number of K-12 students per teacher in 2012-13, with a ratio greater than 24-to-1.
California ranks last or close to last in the nation in the number of students per staff. In 2012-13 (the most recent year for which data are available), California’s student-to-librarian ratio was more than 7,800-to-1 (ranking 51st), its student-to-guidance-counselor ratio was 790-to-1 (51st), and its student-to-administrator ratio was 315-to-1 (48th).
In 2012-13, the gap between California’s spending per K-12 student and the nation as a whole grew to its widest point in at least 40 years. California voters approved Proposition 30 in November 2012, which increased state revenues and provided a significant boost to K-12 school spending.[4] However, the latest figures illustrate that a sizable gap between California spending per K-12 student and the US remains. Accounting for differences in states’ costs of living, California would have needed to spend an additional $13.5 billion in 2015-16 to equal spending per K-12 student in the nation as a whole, an increase of 19.1%.
Substantially increasing California’s K-12 education spending almost certainly depends on the state raising additional revenue. Prop. 55, approved by voters in November 2016, extended Prop. 30’s personal income tax rates for very high-income Californians through 2030 (they had been scheduled to expire at the end of 2018), but did not extend Prop. 30’s quarter-cent increase in the state sales tax rate, which expired at the end of 2016. As a result, the Prop. 55 tax rate extensions will not affect state support for K-12 schools until 2018-19 and are unlikely to increase the level of state revenue compared to the boost that Prop. 30 provided.
Endnotes
[1] All state rankings and related comparisons in this fact sheet include the District of Columbia. For a discussion of why the amount that California is reported to spend per K-12 student, as well as its ranking relative to other states, varies depending on the source of this information and how it is interpreted, see Jonathan Kaplan, Key Considerations When Comparing California K-12 School Spending to Other States(California Budget & Policy Center: August 2015).
[2] Without adjusting for differences in states’ costs of living, California ranked 28th in the nation.
[3] California’s K-12 spending per student reflects a Budget Center analysis that adjusts spending figures for variations in states’ costs of living. This adjustment uses a “comparable wage index” developed by Dr. Lori Taylor at Texas A&M University and William Fowler, Jr. at the National Center for Education Statistics, and subsequently updated by Dr. Taylor. This index is a commonly used method of adjusting K-12 spending for differences in states’ costs of living. For example, see Education Week, Quality Counts 2017: Building on ESSA’s K-12 Foundation (December 2016).
[4] Proposition 30 raised the state sales tax rate through 2016 and the personal income tax rates on high-income taxpayers through 2018.
There was a problem processing your signup. Please try again. Or contact us
Please check your email to confirm your signup.
Endnotes are available in the PDF version of this Fact Sheet.
As the 115th Congress convenes this month, the US economy is in its seventh year of recovery from the Great Recession. Yet many communities in California have not shared in the nation’s recent economic gains. Statewide, nearly 6 million people, including almost 2 million children, are living in families with incomes below the US Census Bureau’s official poverty line, which is about $19,000 in annual income for a family of three.
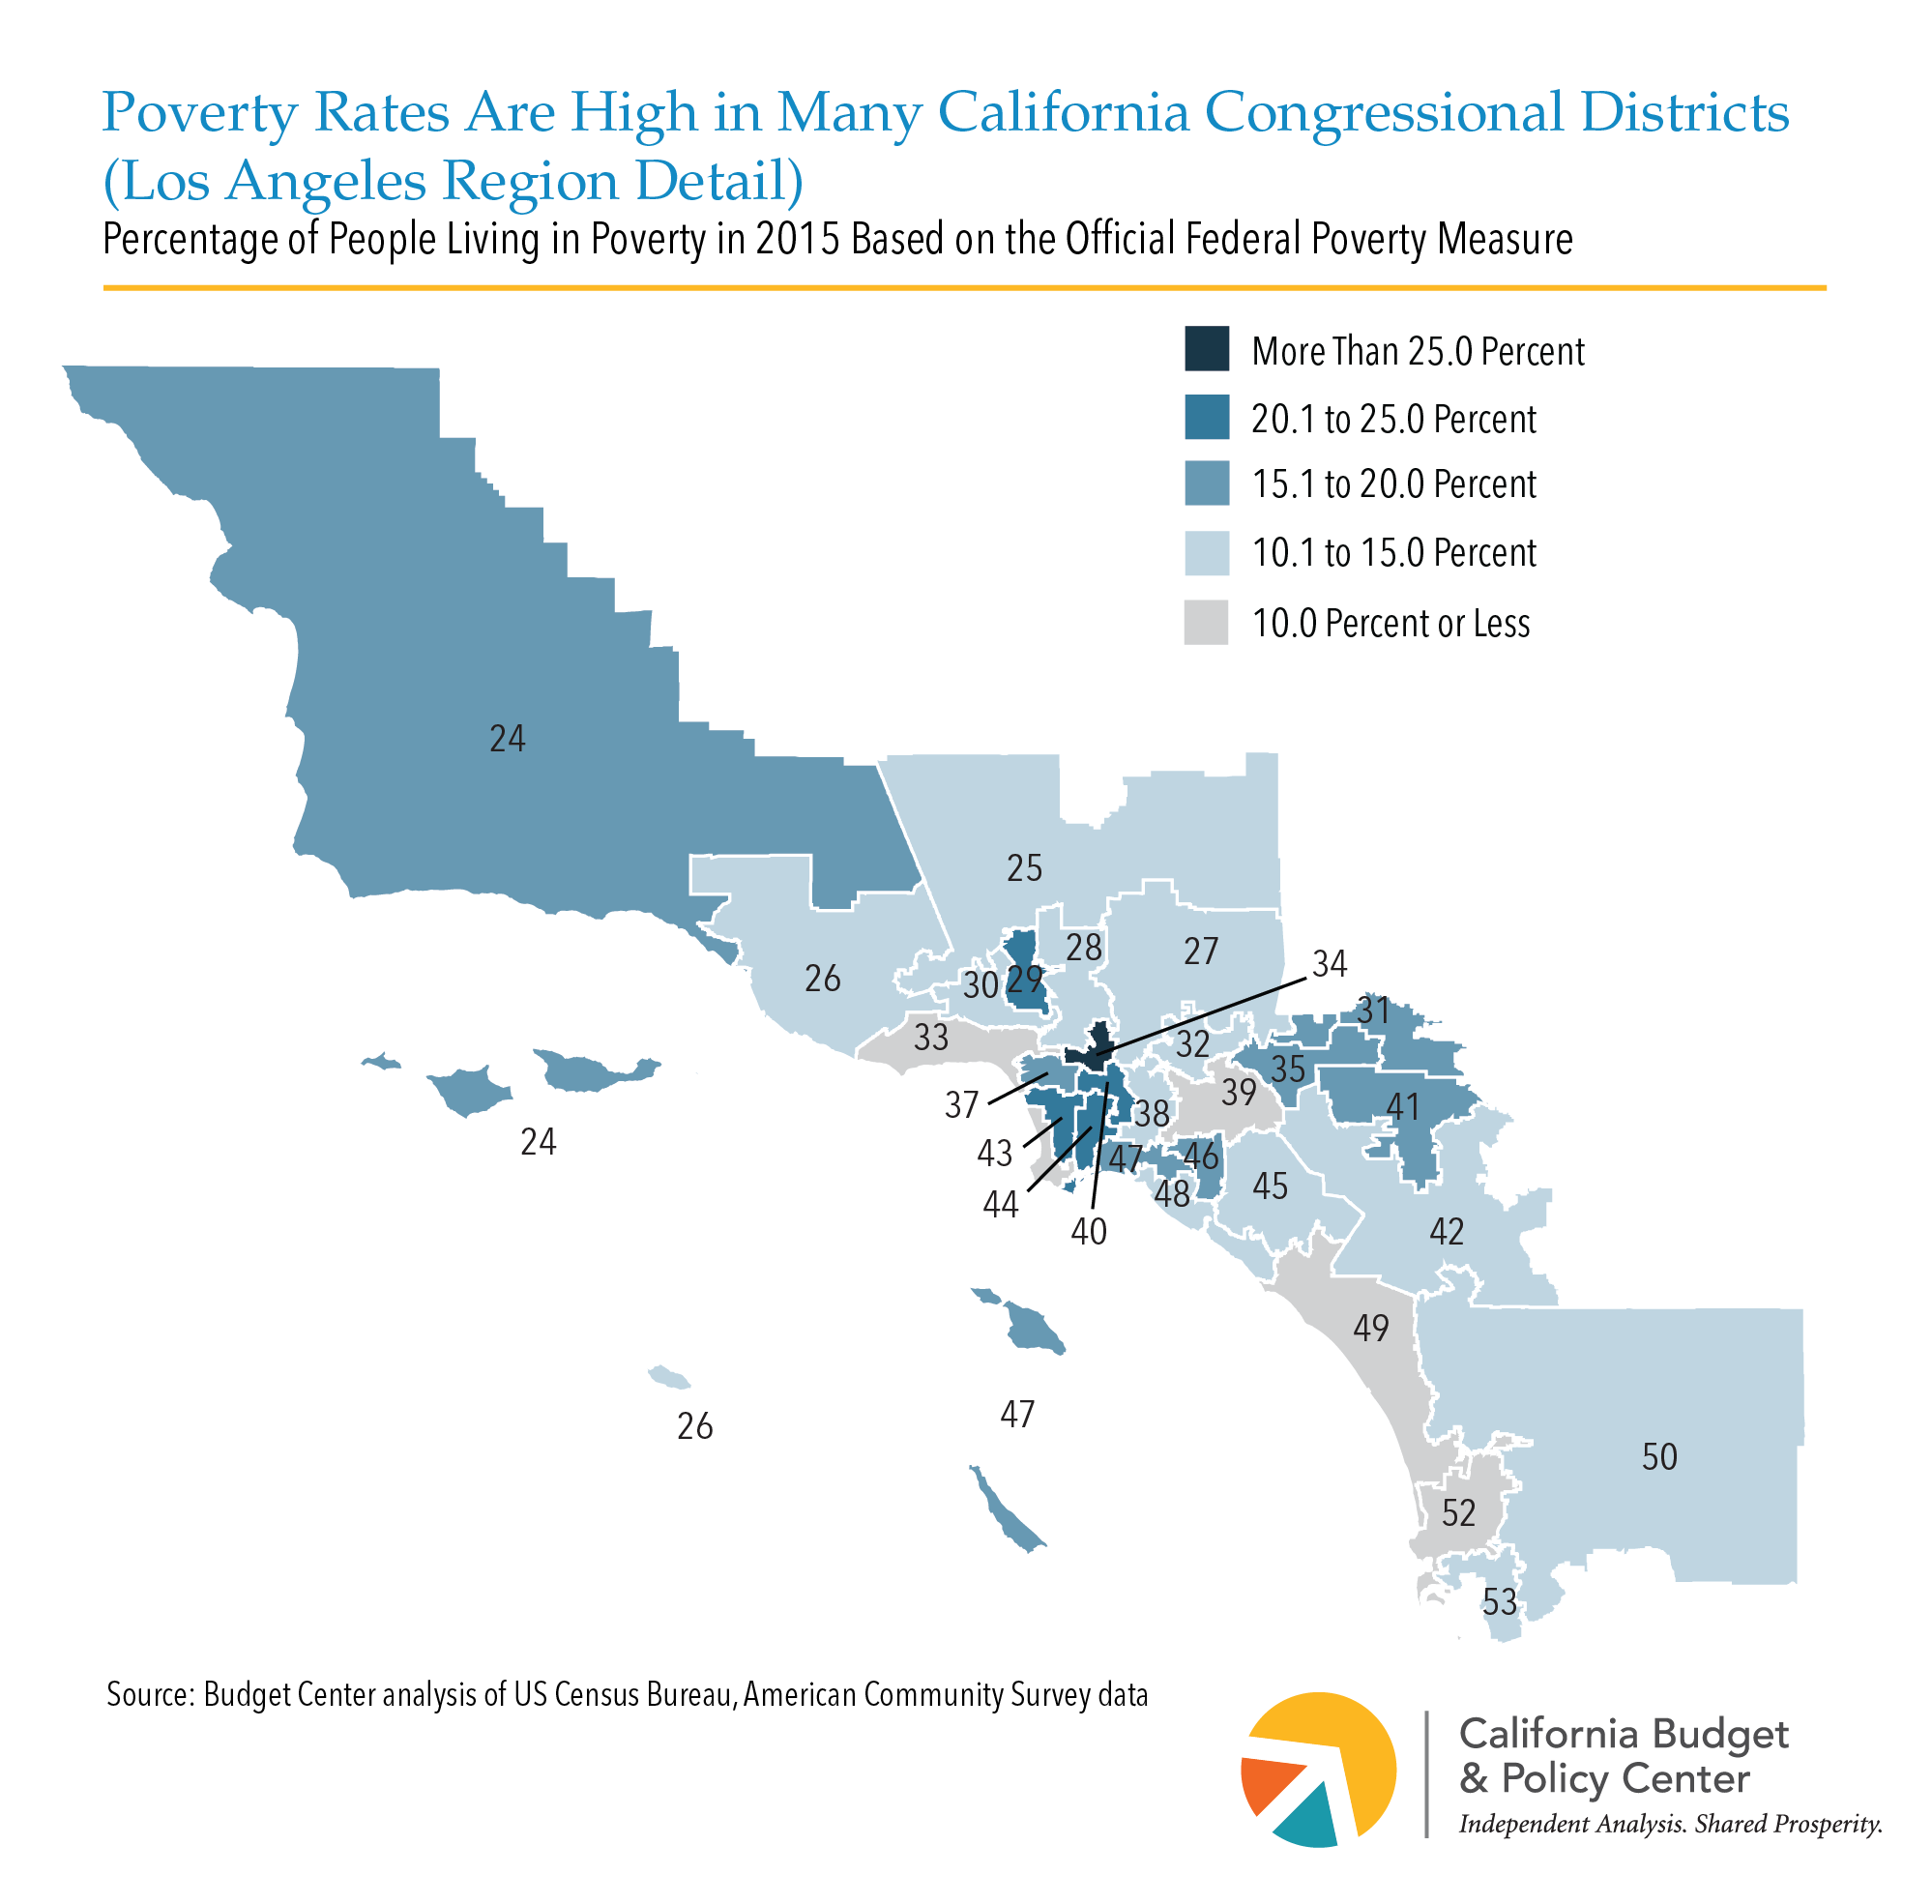
Poverty affects communities in every one of California’s 53 congressional districts, but there are stark differences in the level of economic hardship across districts. The latest Census figures show that the official 2015 poverty rate ranged from a low of 6.8% in District 17 (D-Khanna) in the San Jose area to a high of 30.8% in District 16 (D-Costa) in the San Joaquin Valley. Also, poverty has increased in nearly every district since 2000, and the largest increases are concentrated in inland, suburban communities, reflecting a broader national trend. These findings highlight the urgent need for the new Congress to prioritize policies that give all people the opportunity to thrive and move up the economic ladder.
The latest Census data (see Maps below) show that:
Three congressional districts are extremely distressed, with more than one-quarter of all residents living in poverty. These districts — 16 (D-Costa), 21 (R-Valadao), and 34 (D-Becerra) — include communities in the San Joaquin Valley and in Los Angeles.
In eight districts, between one-fifth and one-quarter of all residents live in poverty. These districts — 6 (D-Matsui), 8 (R-Cook), 29 (D-Cárdenas), 36 (D-Ruiz), 40 (D-Roybal-Allard), 43 (D-Waters), 44 (D-Barragán), and 51 (D-Vargas) — include communities along the US-Mexico border as well as in Los Angeles, the Inland Empire, the San Fernando Valley, and the Sacramento region.
Only 10 districts have fewer than 1 in 10 residents living in poverty. These districts — 4 (R-McClintock), 14 (D-Speier), 15 (D-Swalwell), 17 (D-Khanna), 18 (D-Eshoo), 19 (D-Lofgren), 33 (D-Lieu), 39 (R-Royce), 49 (R-Issa), 52 (D-Peters) — largely include communities in the Bay Area and along the southern California coast.
In addition, a recent Brookings Institution analysis shows that nearly every California congressional district was more economically distressed in recent years than in 2000, due largely to the impact of the Great Recession. The communities that have been hit the hardest tend to be those in inland, suburban areas (see Table below). Specifically:
Poverty rates rose in 45 of California’s 53 congressional districts between 2000 and 2010-14. For example, the poverty rate increased by more than 4.0 percentage points between 2000 and 2010-14 in four districts: 5 (D-Thompson), 7 (D-Bera), 8 (R-Cook), and 41 (D-Takano), which include communities in the Inland Empire, the eastern Sierra, the Bay Area, and the Sacramento vicinity. In contrast, poverty rates declined in just two districts, while there was no statistically significant change in the remaining six districts.
Growth in the number of people living in poverty far outpaced overall population gains in most districts. For example:
Between 2000 and 2010-14, the number of people facing severe economic hardship more than doubled, rising by 112%, in District 42 (R-Calvert), which includes suburban communities in Riverside County. Although District 42 experienced the greatest population gains in California during this period (the number of district residents rose by about three-quarters), the increase in the number of residents living in poverty still far exceeded the growth in the overall population.
In District 7 (D-Bera), which includes suburban communities east and south of Sacramento, the number of residents facing severe economic hardship increased by about 84% between 2000 and 2010-14, far outpacing the 25% increase in the district’s total population.
Three other districts saw the number of economically distressed residents rise by more than 70% between 2000 and 2010-14, far exceeding overall population growth. These districts — 8 (R-Cook), 25 (R-Knight), and 45 (R-Walters) — include communities in the Inland Empire and Death Valley region, northern Los Angeles County, and Orange County. The vast majority of people living in poverty in these districts reside in suburban areas.
There was a problem processing your signup. Please try again. Or contact us
Please check your email to confirm your signup.
Endnotes are available in the PDF version of this Fact Sheet.
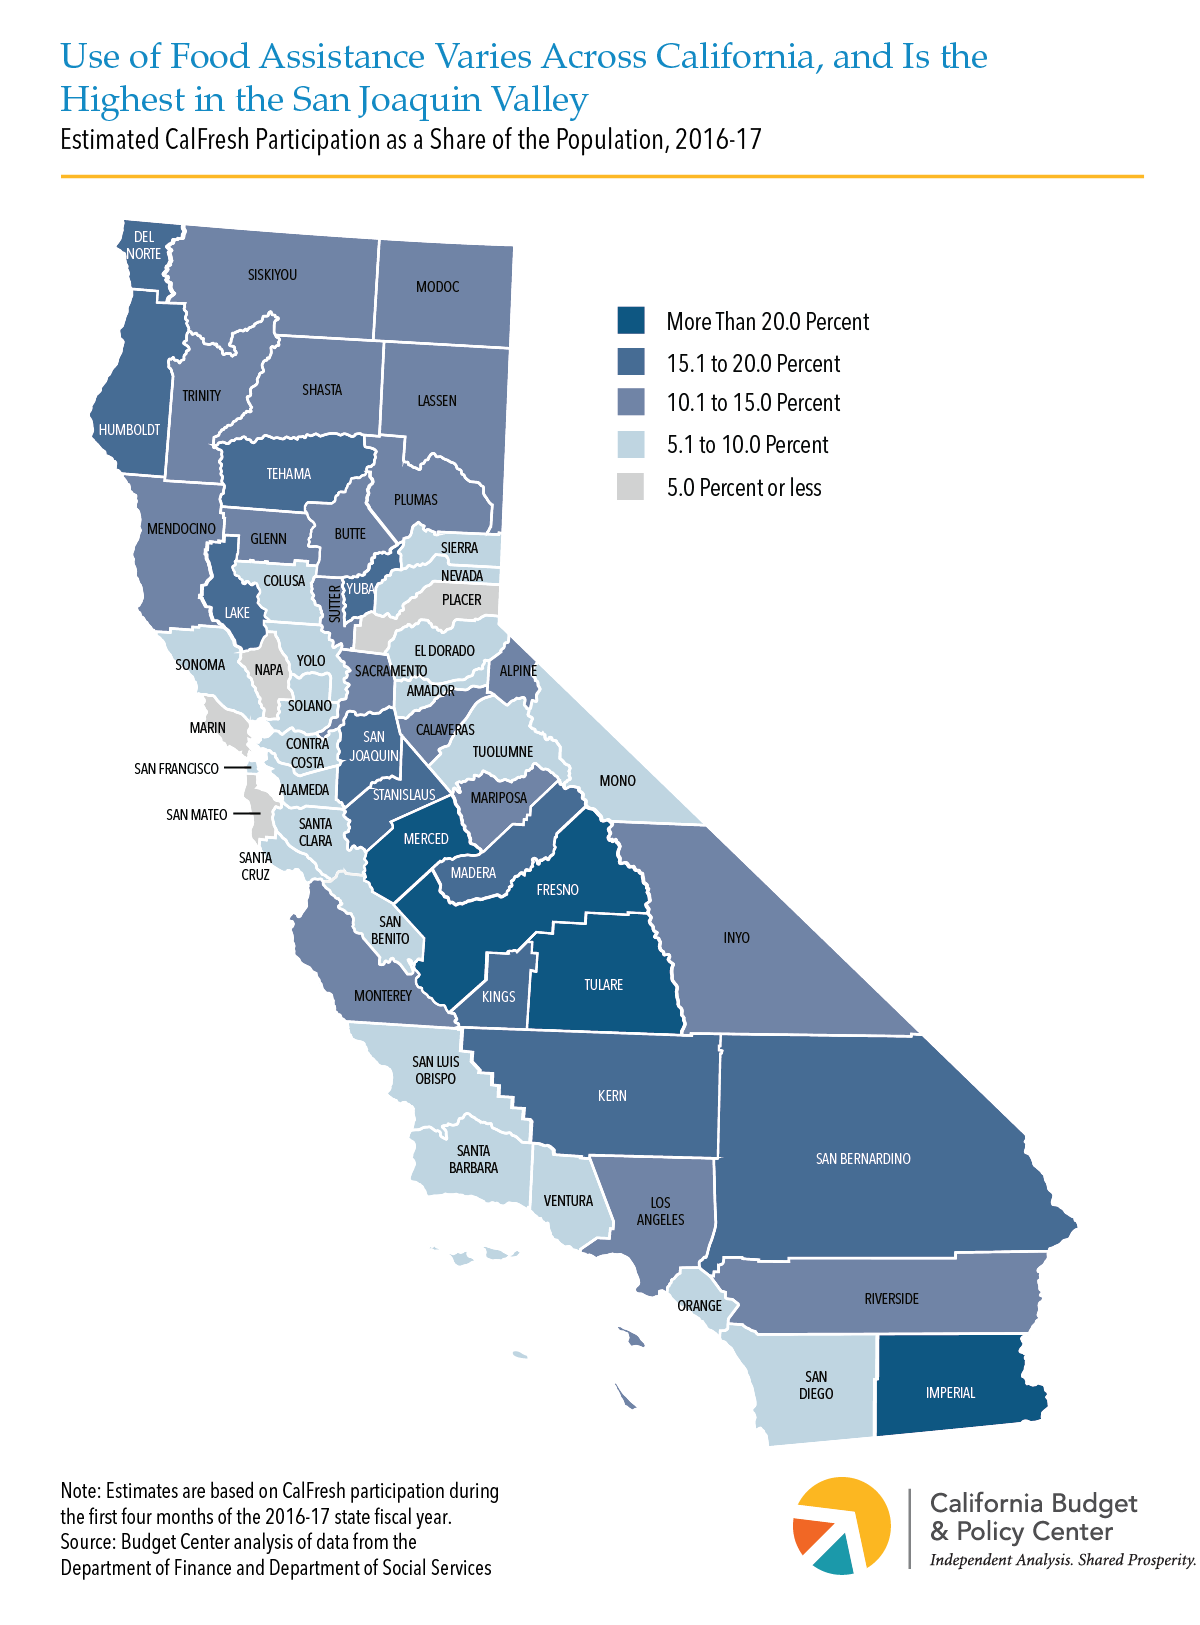
The Supplemental Nutrition Assistance Program (SNAP) — known as CalFresh in California — is the cornerstone of the federal government’s effort to reduce hunger and help struggling families put food on the table. An estimated 4.3 million individuals on average will receive CalFresh food assistance each month during the 2016-17 fiscal year, which began this past July 1. Of the 10 counties with the highest shares of residents participating in CalFresh, five are in the San Joaquin Valley: Tulare (25.5% of residents receive CalFresh), Fresno (21.8%), Merced (20.5%), Madera (18.5%), and Kern (18.3%). (See Map below.) In addition to helping households afford food, SNAP benefits also boost local economies, with every $1 in benefits producing as much as $1.79 in economic activity. During 2016-17, an estimated $7.1 billion in SNAP benefits will flow from the federal government directly to California households, potentially creating $12.7 billion in economic activity throughout the state. (See Table below.)
SNAP lifts families out of poverty and has been shown to improve children’s health and well being. Yet at the federal level, Republicans have proposed severe cuts to SNAP in each of the last six years. If President-elect Trump and the Republican-led Congress follow through on cutting annual federal funding for SNAP, many families would be plunged into poverty, and children could be deprived of the nutrition necessary to stay healthy and reach their full potential.
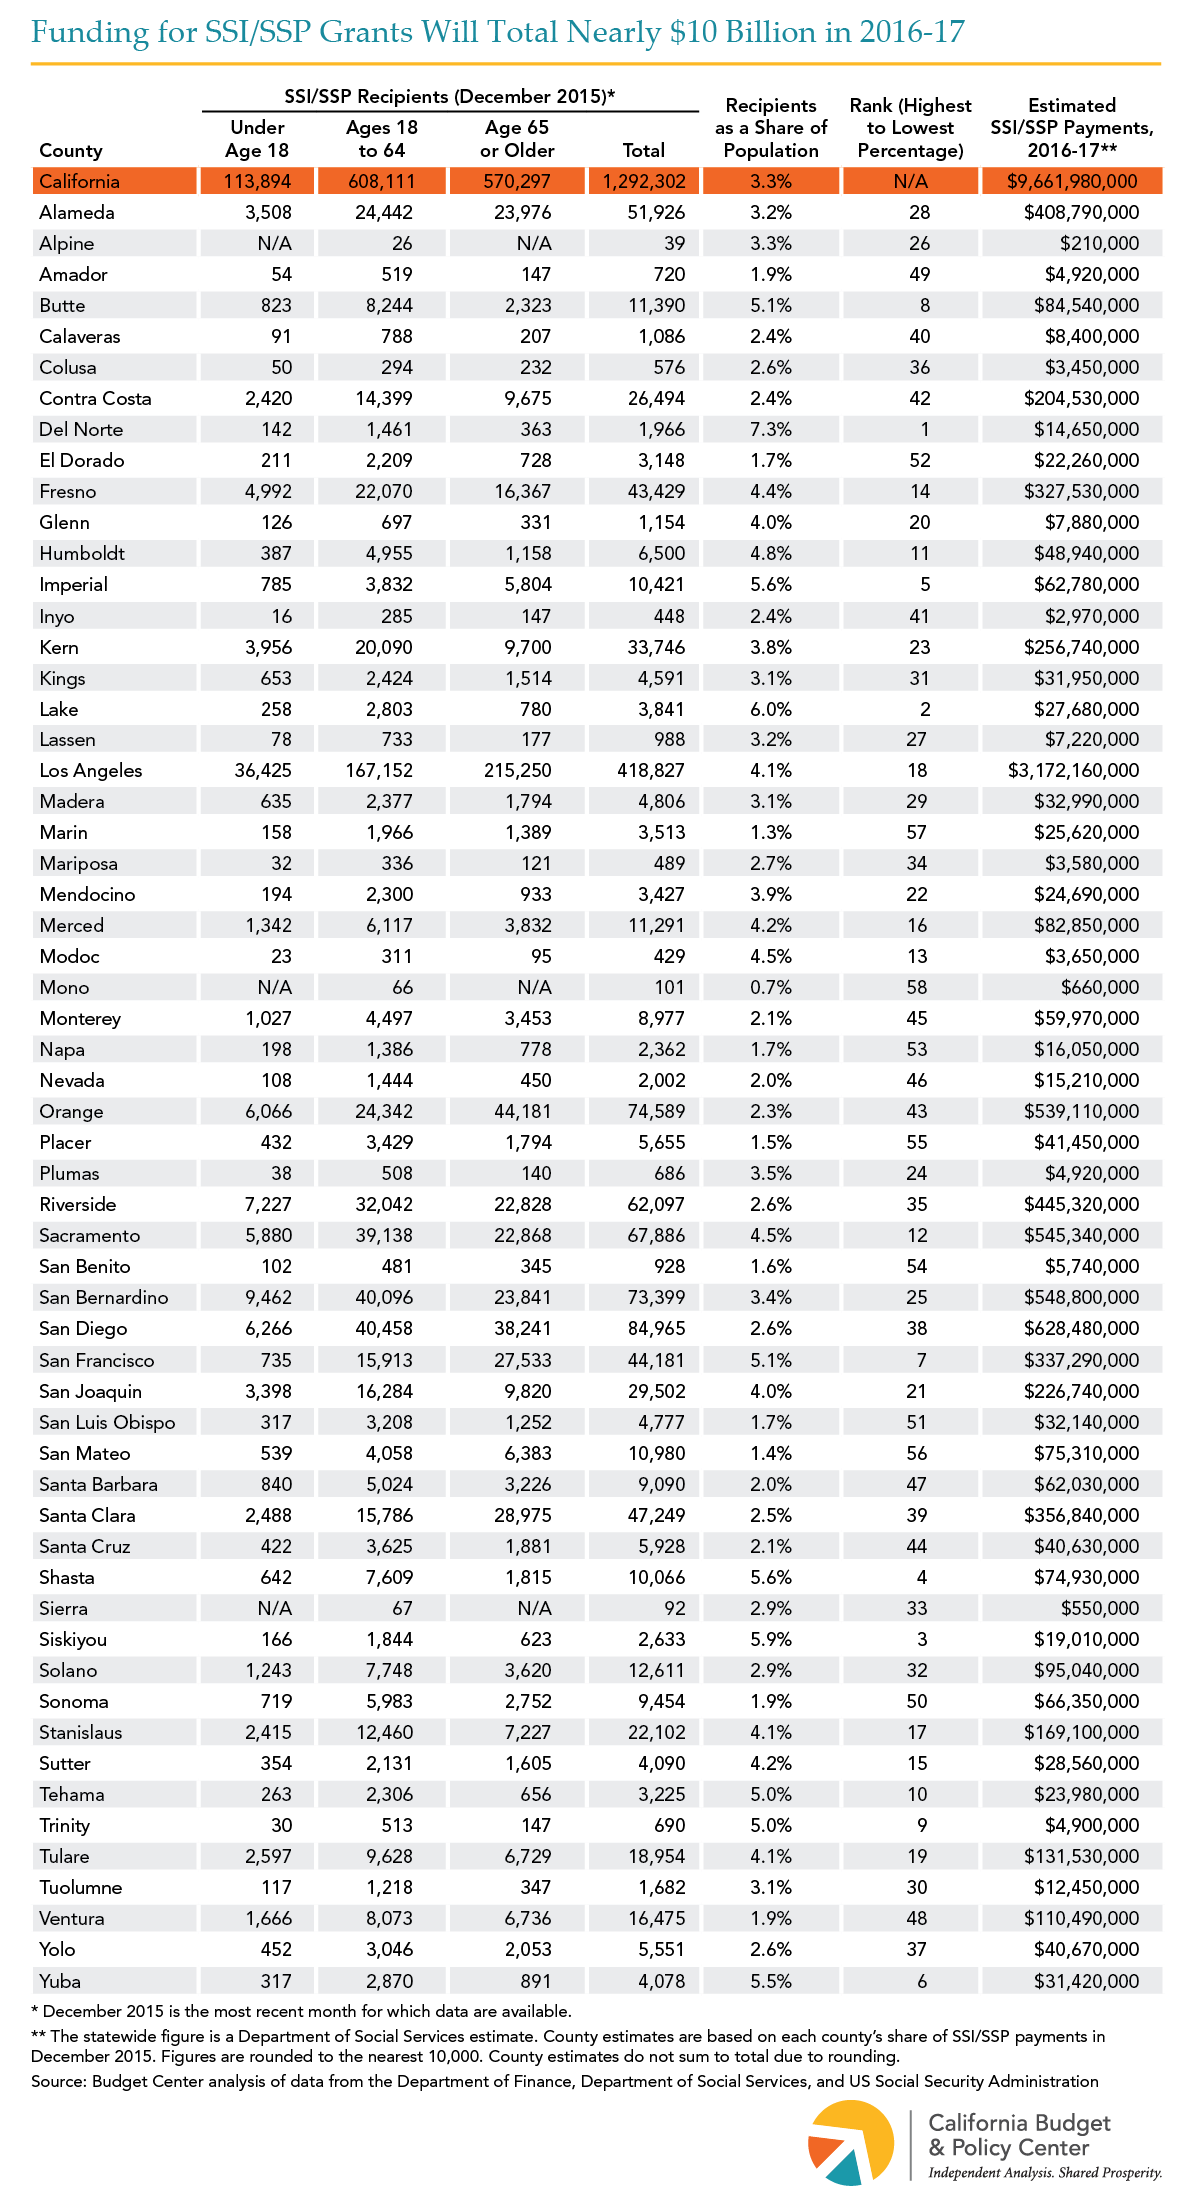
Supplemental Security Income (SSI) provides federally funded cash assistance to help low-income seniors and people with disabilities pay for housing, food, and other necessities. The maximum monthly SSI grant for most recipients in California is currently $735 per month — less than 75% of the federal poverty line for an individual. Also, California funds a State Supplementary Payment (SSP), which provides up to an additional $160.72 per month for most recipients. Yet, the combined maximum SSI/SSP grant for an individual — $895.72 per month — is still equal to only about 90% of the poverty line. Total funding for SSI/SSP will reach nearly $10 billion in 2016-17, with the federal government providing $7.2 billion and the state, $2.5 billion. Of the 10 California counties with the highest shares of residents enrolled in SSI/SSP, most — including the top three of Del Norte (7.3%), Lake (6.0%), and Siskiyou (5.9%) — are in rural areas. The efforts of Republican leaders in Washington to scale back federal support for the safety net could include reductions to SSI. Any such cuts would be a further blow to SSI/SSP recipients who already struggle with California’s high cost of living.
There was a problem processing your signup. Please try again. Or contact us
Please check your email to confirm your signup.
Supplemental Security Income (SSI) provides federally funded cash assistance to help low-income seniors and people with disabilities pay for housing, food, and other necessities. The maximum monthly SSI grant for most recipients in California is currently $735 per month — less than 75% of the federal poverty line for an individual. Also, California funds a State Supplementary Payment (SSP), which provides up to an additional $160.72 per month for most recipients. Yet, the combined maximum SSI/SSP grant for an individual — $895.72 per month — is still equal to only about 90% of the poverty line. Total funding for SSI/SSP will reach nearly $10 billion in 2016-17, with the federal government providing $7.2 billion and the state, $2.5 billion. SSI/SSP recipients live in all 53 of California’s congressional districts. For example, in the 23rd District, represented by House Majority Leader Kevin McCarthy (R-Bakersfield), 3.6% of residents rely on SSI/SSP to help make ends meet. In the 12th District, represented by House Minority Leader Nancy Pelosi (D-San Francisco), 5.2% of residents are enrolled in SSI/SSP. The efforts of Republican leaders in Washington to scale back federal support for the safety net could include reductions to SSI. Any such cuts would be a further blow to SSI/SSP recipients who already struggle with California’s high cost of living.
There was a problem processing your signup. Please try again. Or contact us
Please check your email to confirm your signup.
Endnotes are available in the PDF version of this Fact Sheet.
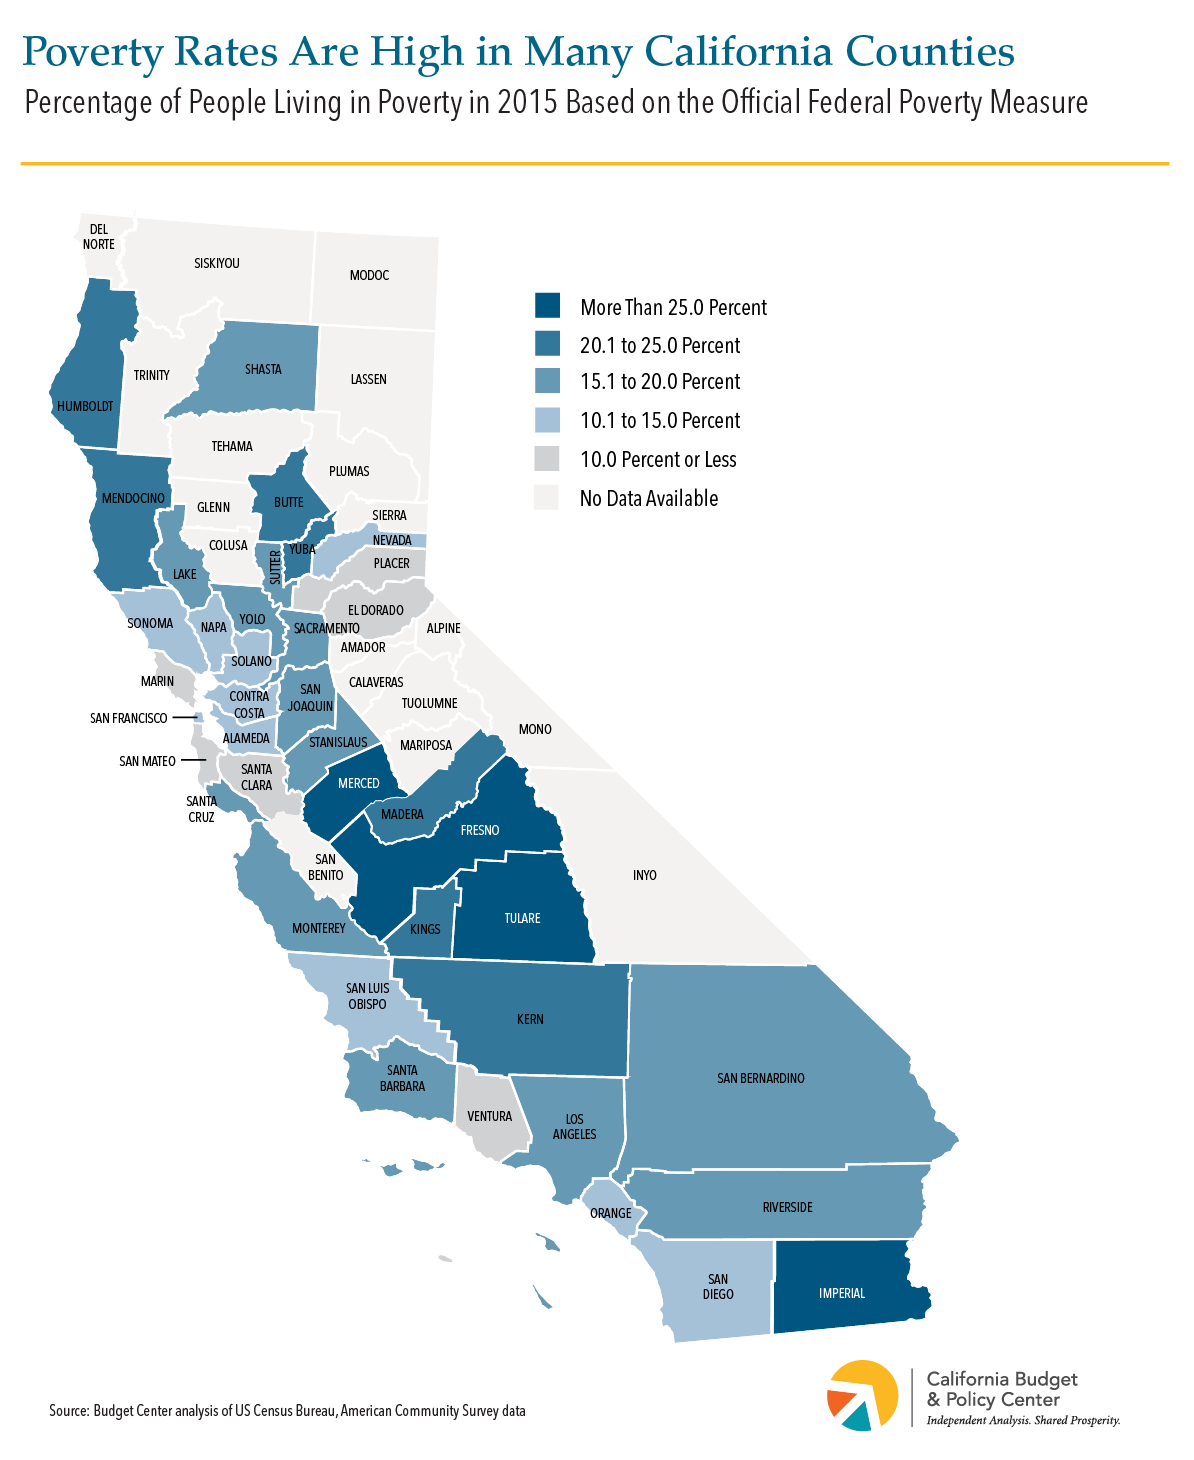
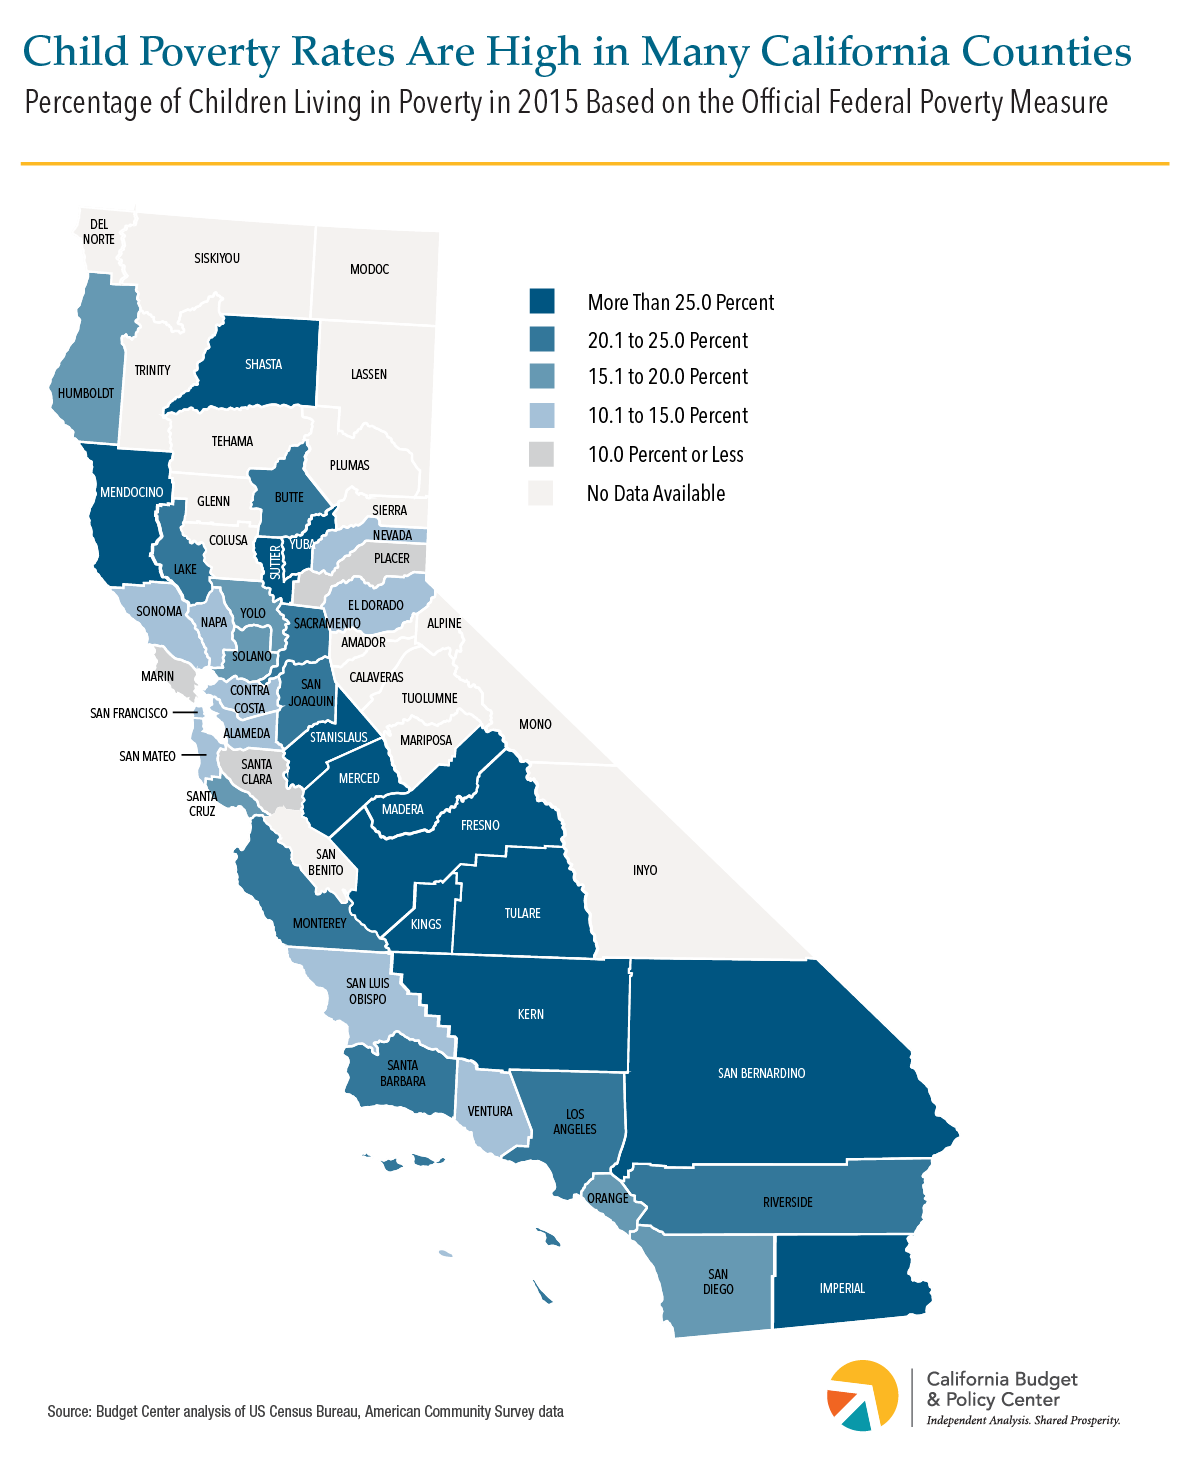
People in many communities across the state are not sharing in California’s recent economic gains. Statewide, nearly 6 million people (15.3 percent), including almost 2 million children (21.2 percent), lived in poverty in 2015, based on the US Census Bureau’s official poverty line, which is about $19,000 in annual income for a family of three. Among California’s counties, there are stark differences in people’s economic well-being. The latest Census figures show that:
The share of people struggling to make ends meet varies widely throughout the state. The official 2015 poverty rates ranged from a low of 7.1 percent to a high of 27.6 percent, while the 2015 child poverty rates ranged from a low of 7.4 percent to a high of 38.5 percent. (See tables in this companion Fact Sheet for poverty rates and child poverty rates in each county).
In 11 counties, more than 1 in 5 people lived in poverty in 2015 (see Map 1, below). This includes four counties — Fresno, Imperial, Merced, and Tulare — where more than one-quarter of all residents lived in poverty. Such high poverty rates are particularly striking given that 2015 marked the sixth year of recovery from the Great Recession, which ended nationally in 2009.
In 21 counties, more than 1 in 5 children lived in poverty in 2015 (see Map 2, below). This includes five counties — Fresno, Madera, Merced, Tulare, and Yuba — where more than one-third of all children lived in poverty and another eight counties where between one-quarter and one-third of all children lived in poverty.
There was a problem processing your signup. Please try again. Or contact us
Please check your email to confirm your signup.
Endnotes are available in the PDF version of this Fact Sheet.
The share of Californians facing severe economic hardship remains higher than at the onset of the Great Recession, in 2007, in many communities throughout the state. Statewide, 15.3 percent of residents struggled to get by in 2015 — the most recent year for which data are available — based on the US Census Bureau’s official poverty measure. This was 2.9 percentage points higher than in 2007 (12.4 percent), when the state poverty rate fell to a recent low. In addition, 21.2 percent of California children lived in poverty in 2015 — 3.9 percentage points higher than in 2007 (17.3 percent). Specifically, the latest Census figures show that:
Poverty remained more widespread in 2015 than at the onset of the recession in 30 out of the 40 counties for which data are available (see Map 1, below). This is especially notable given that 2015 marked the sixth year since the end of the national recession. There was no statistically significant difference in poverty rates between 2007 and 2015 in the remaining 10 counties for which data are available.
Three counties stand out with severely higher poverty rates. In Kings, Madera, and Sutter counties the 2015 poverty rate was more than 8.0 percentage points higher than in 2007.
Another 11 counties have poverty rates that substantially exceed 2007 levels. These counties, which include both Inland Empire counties and several counties in the Central Valley, had 2015 poverty rates that were between 4.1 and 8.0 percentage points higher than in 2007.
In 16 counties, poverty rates modestly exceed 2007 levels. These counties had 2015 poverty rates that exceeded 2007 levels by up to 4.0 percentage points. Notably, these include counties, such as San Francisco and San Mateo, where the local job market has been booming for several years.
Also, child poverty rates in 19 counties are significantly higher than in 2007 (see Map 2, below). Specifically:
Six counties stand out with severely higher child poverty rates. In Kings, Madera, Merced, and Sutter counties the 2015 child poverty rate was more than 12.0 percentage points higher than in 2007, and in San Bernardino and Stanislaus counties the 2015 child poverty rate was between 8.1 and 12.0 percentage points higher than in 2007.
Another nine counties have child poverty rates that are substantially higher than in 2007. These counties, which include parts of the Central Valley, central coast, and southern California, had 2015 child poverty rates that were between 4.1 and 8.0 percentage points higher than in 2007.
In four counties, child poverty rates are modestly higher than in 2007. Los Angeles, San Diego, San Mateo, and Sonoma counties had 2015 child poverty rates up to 4.0 percentage points higher than in 2007.
Map 1
Map 2
The following tables provide the underlying data for 2007, 2012, and 2015 that this Fact Sheet is based on.
There was a problem processing your signup. Please try again. Or contact us
Please check your email to confirm your signup.
This website uses cookies to analyze site traffic and to allow users to complete forms on the site. The California Budget & Policy Center does not share, trade, sell, or otherwise disclose personal information. By using our website you agree to our Privacy Policy.