Summer Financial Aid: A Tool for Boosting Low-Income Students’ Graduation Rates
July 2019 | By Amy Rose
Ensuring college students graduate from California’s public universities in a timely manner is necessary for the state to satisfy student demand for higher education and to meet the state’s workforce needs. As previously discussed in our analyses, the high cost of college attendance and overcrowded degree programs make it difficult for many low-income students to graduate on time. One way students can graduate more quickly is to enroll in summer courses. However, many low-income students miss out on summer enrollment because of insufficient financial aid. Providing low-income students with financial aid during the summer can help ensure timely graduation, which means less student loan debt, greater earning potential, and more room for the next cohort of students to start college. The 2019-20 budget includes summer-term financial aid to help some low-income students cross the graduation stage in a timely manner, but leaves others without support.
Limited Summer Financial Aid Keeps Low-Income Students Away
Students attending the state’s public four-year universities, California State University (CSU) and University of California (UC), pay for college through a combination of family contributions, earnings from work, and federal, state, and institutional aid. Many low-income students receive state and federal need-based financial aid to help pay for tuition and living expenses.
At the federal level, Pell Grants provide financial aid to low-income students to help afford the cost of college such as food and housing. The maximum Pell Grant award for 2019-20 is $6,195. In 2017, Congress reinstated the Year-Round Pell Grant, which allows students to receive a Pell Grant during the summer without drawing from their lifetime eligibility.
In California, Cal Grants are the foundation of the state’s financial aid for college students. In 2019-20 the maximum Cal Grant tuition award at CSU is $5,742 and $12,570 at UC. While Pell Grants are available for summer coursework, Cal Grants have limitations. If students take more courses during the summer it draws from their total lifetime financial aid eligibility. This means that students who wish to attend summer courses must: 1) do so without the support of Cal Grants or 2) cut into their lifetime award eligibility — leaving them without aid later in their academic careers.
As a recent Budget Center report highlighted, for students experiencing unmet basic needs, lack of financial support is a barrier to success, so receiving financial aid in the summer might allow students to continue their studies year-round and could shorten the time it takes for students to earn a degree. While a growing number of students are graduating from high school and more are attending college, completion rates at CSU and UC are low. At CSU, only 26% of students graduate in four years and 69% do so in six years. At UC, 61% of students graduate in four years and 85% graduate in six years.
For low-income students, the time it takes to earn a bachelor’s degree is often much longer because of a variety of factors, including limited availability of financial aid and other expenses of affording college. At CSU, the four- and six-year graduation rate for low-income students is 18.5% and 56.2%, respectively. Among this population, outcomes vary significantly by race and ethnicity. Black students and Latino and Hispanic students graduate at about half of the rate as their White counterparts (13.7% and 15.6%, respectively, compared to 29.3%). The CSU is working to improve graduation rates and eliminate achievement gaps through their Graduation Initiative 2025. While graduation rates are higher at UC than CSU, racial disparities still exist. Four-year graduation rates for White UC students is 70% compared to 50% for Black UC students. These racial disparities in graduation rates mimic disparities in socioeconomic status, health outcomes, and health care for people of color and reflect a legacy of discriminatory policies and practices that cut people of color off from opportunity.
Summer Financial Aid Can Help Boost Graduation Rates and Ease Capacity Limits
Summer financial aid can help more students graduate on time and ease the capacity limitations at CSU and UC.
Every year thousands of students who are qualified for admittance to the CSU and UC do not attend these colleges due to capacity limitations. These students either delay entering college, attend a private nonprofit or for-profit (often at much higher costs), or skip college completely, which disproportionately impacts low-income students who may not have the financial resources to attend a private university or who may take on staggering amounts of debt to cover the higher costs. Turning away qualified students is also counterproductive to the state’s efforts to increase the number of bachelor degrees awarded at CSU and UC in order to meet future workforce demands. To meet these needs, the CSU and UC should increase enrollment and improve graduation rates.
Limited capacity at CSU and UC also affects current students, many whom struggle to get the courses they need due to “impacted” campuses, which occurs when the number of qualified applicants is greater than the number of available spaces in a major. When programs are impacted students must wait for classes to become available, delaying their time to graduation. The sooner students graduate the sooner they can enter the workforce and free up space at a campus for another student.
California lawmakers have followed the lead of the federal Pell Grant’s extension to summer by funding some summer financial aid in the 2019-20 state budget. The budget allocates $6 million to CSU and $4 million to UC to provide summer-term financial aid to eligible students, including undocumented students. While this is a step in the right direction, the spending plan leaves behind students attending California community colleges and the state’s private institutions. Additionally, the budget notes that this funding will be suspended in two years unless General Fund revenues are higher than expected in the coming years.
Ensuring all students have access to quality public higher education is a long-standing priority of state leaders. The 2019-20 state budget builds on recent institutional efforts to help students more quickly earn a bachelor’s degree at UC and CSU. Now it’s time for the state to support these efforts by extending financial aid to summer at all of California’s colleges.
There was a problem processing your signup. Please try again. Or contact us
Please check your email to confirm your signup.
The Trump Administration has quietly announced a proposal to change the way the federal poverty line is updated each year for inflation. This proposal is far more than a minor technical change affecting government statistics — it would cut low-income Californians’ access to health care, basic nutrition, and other essential needs. These consequences arise because the federal poverty line forms the basis of criteria that determine whether individuals are eligible to access many vital public supports that are funded (at least in part) by federal dollars — like public health insurance through Medi-Cal, food assistance through CalFresh, and home energy assistance through the Low Income Home Energy Assistance Program (LIHEAP). As a result, changing the method for updating the poverty line as proposed would threaten low-income Californians’ ability to meet their most basic needs.
The Trump Administration’s under-the-radar proposal, included in a notice requesting public comments issued by the Office of Management and Budget (OMB), puts forward the idea of updating the Census Bureau’s official poverty thresholds, or poverty line, using an alternative measure of inflation in place of the inflation measure currently used to update the thresholds each year (the Consumer Price Index for All Urban Consumers, or CPI-U). Two alternative inflation measures specifically mentioned as options are the chained Consumer Price Index (the chained CPI, or C-CPI-U) or the Personal Consumption Expenditures Price Index (PCE Price Index). Using either of these alternative inflation measures would make the poverty thresholds increase more slowly over time. There are several reasons that this proposed change would actually make the federal poverty line less accurate rather than more accurate as a measure of basic economic security. What is more, the Trump Administration is explicitly not requesting input to understand how this change would affect people’s access to vital public supports that help address families’ and individuals’ most basic needs.
Slowing Down the Annual Increase in the Poverty Line Would Make It Less Accurate, Not More Accurate, Especially in California
Switching to a slower-rising inflation measure to update the federal poverty line each year would make the official poverty thresholds less accurate as a measure of a minimum adequate level of economic security. The federal poverty line is already far lower than the basic cost to support a family, particularly in California, where the cost of living is high in many regions. According to the Budget Center’s Making Ends Meet analysis, the statewide average cost of a basic family budget for a working single parent with two children — including housing and utilities, food, child care, health care, transportation, taxes, and miscellaneous other basic necessities — totals nearly $66,000 (in 2017 dollars), while the 2017 official poverty threshold for the same family was only $19,749. In the most expensive parts of the state the cost of basic needs is much higher — as much as $103,423 for this same family in San Francisco County, or more than five times the federal poverty line. Even in Fresno County, a county with relatively low costs, the basic family budget for a single parent with two children is more than $50,000, or two and a half times the poverty line. Slowing down the rate by which the poverty thresholds are updated each year would only make this disconnect worse.
The slower-rising chained CPI and PCE Price Index are also unlikely to be more accurate ways to measure inflation specifically for low-income households, or to update a poverty threshold, which represents a minimum level of resources to meet basic needs. The largest basic needs expense in a household budget is typically housing, and housing costs in California in recent years have increased much faster than even the standard CPI-U inflation measure currently used to update the federal poverty line. While the CPI-U rose by 21.6% from 2006 to 2017, median household rent in California rose by 41.6%, or nearly twice as fast. Research has shown that costs for the overall bundle of goodstypically purchased by low-income households have risen faster than costs for the goods typically purchased by higher-income households. Also, the reason that the chained CPI increases more slowly than the standard CPI-U inflation measure used currently to update the poverty line is because the chained CPI assumes that consumers will trade more expensive items for similar less expensive items as prices change (e.g., they will buy chicken instead of beef if the price of beef rises). The PCE Price Index makes the same assumption. However, housing and child care are typically the two largest expenses in the basic family budgets for working families, and both are items where it is unlikely that families can easily switch to a similar, lower-cost alternative if they face an increase in price.
The Trump Administration has framed considering alternative inflation measures as an important technical question for accurate calculation of the federal poverty line, but research on ways to improve the measurement of poverty has not identified slowing down the annual inflation update as a key strategy. An expert panel of the National Academy of Sciences examined many technical aspects of the official federal poverty measure in 1995 and issued recommendations for improving the government measure of poverty, resulting in the creation of the Supplemental Poverty Measure (SPM). The SPM poverty line is higher than the official poverty line for most people, particularly in California. For example, the SPM poverty threshold for a family of two adults and two children who rent their home in the Los Angeles metropolitan area was $34,308 in 2017, while the official federal poverty threshold for the same family was only $24,858. The SPM incorporates many other improvements to measuring poverty. (See the Budget Center poverty explainer webinar for more details on the SPM.) If the objective is to improve poverty measurement, it would make more sense to consider all of these types of improvements rather than focusing on just one item, the choice of inflation measure. This is particularly true because switching to one of the proposed alternative inflation measures alone would cause the poverty thresholds to shrink over time, when research provides more support for increasing the thresholds.
Changing the Way the Poverty Thresholds Are Updated Could Reduce Low-Income Californians’ Access to Vital Public Supports
This proposal would have serious, concrete consequences in the lives of low-income individuals and families. That is because the federal poverty thresholds are the basis for the federal poverty guidelines that are used to determine eligibility, benefits, and funding levels for a wide variety of public supports and federal grants that help families and individuals meet their basic needs. Millions of Californians with low incomes are enrolled in Medi-Cal (known as Medicaid at the federal level) for public health insurance, for example, and millions of Californians access CalFresh food assistance (known as the Supplemental Nutrition Assistance Program, or SNAP, at the federal level) to meet their basic need for food. To be eligible to access these public supports, a family’s or individual’s income must be less than the federal poverty guideline or a multiple of it. Slowing down the annual increase in the poverty guidelines would result in fewer Californians eligible to access these critical public supports over time, with a small impact at first but a large impact over the long term.
The Public Can Submit Comments on This Proposal Now
The public has until Friday, June 21 to submit comments to the Office of Management and Budget via an online submission form on this proposed change to how the poverty line is updated each year for inflation. Individuals and organizations are encouraged to share the implications of the proposal for their households or those they serve, keeping comments substantive and unique, with at least 70% of the content different from other submitted comments. The Trump Administration explicitly did not request public comments on how the proposed change to the poverty thresholds would affect the federal poverty guidelines and eligibility for vital public supports. However, organizations can draw attention to the importance of this cascading effect of the proposal by describing what questions the federal government should take the time to research, and what additional input the government should solicit and consider, before deciding whether to move forward with the change.
The poverty line is more than a measure, and ensuring that low-income Californians have access to vital public supports such as health care and food assistance, and that those benefits are not diminished over time under the guise of a technical change, should be a priority for all Californians.
There was a problem processing your signup. Please try again. Or contact us
Please check your email to confirm your signup.
College can be stressful for students, especially during this time of the year as students are completing final examinations and graduating. Considering the challenging academic workload, it is normal for students to feel worried, anxious, restless, or sad from time to time. If these feelings or other mental health symptoms persist and start to interfere with daily living and academic performance, it may be indicative of a mental health issue. Without treatment for mental health issues, college students are more likely to drop out, abuse substances, and even commit suicide.
Years of rising demand in mental health services among California college students have contributed to longer wait times and growing pressure to improve access to these services. California higher education leaders and policymakers are taking steps to reduce the gap between students’ need for mental health services and their use of these services.
In light of Mental Health Awareness Month, and as budget deliberations are underway in the state legislature, this piece describes mental health trends and examines current state proposals to maintain, improve, and/or expand access to mental health supports in college campuses across California.
Mental Health Trends in California Colleges
The 2018 National College Health Assessment reports that in the past year, 63% of college students surveyed felt overwhelming anxiety, 42% felt so depressed that it was difficult to function, 62% felt very lonely, and 12% seriously considered suicide. Researchers at UC Berkeley found that nationally, the percentage of students who reported being diagnosed or treated for anxiety disorder in the past year doubled from 2008 to 2016 from 10% to 20%.
Students in California’s public colleges report similar experiences. At the California State University (CSU), students reported an increase in hopelessness, loneliness, sadness, depression, anxiety, and suicidal thoughts in the past two years and 16% of students received some psychological counseling or treatment on campuses last year. At the University of California (UC), the percentage of students seeking mental health services in the past 10 years rose 78%, nearly three times higher than enrollment growth during the same period. While the demand for mental health services has increased significantly, it may actually understate the need, as many students may choose not to seek support due to the stigma attached to counseling.
At California Community Colleges (CCC), students experience similar rates of psychological distress as UC and CSU students — uncomfortable feelings or emotions that affect daily living — according to a recent study. However, students from CCC reported higher rates of impaired academic performance due to mental health issues than students at CSU and UC campuses. CCC students were half as likely to receive referrals for counseling or mental health services by a faculty member and were also less likely to receive services on campuses than their UC and CSU counterparts.
Availability of Mental Health Services and Resources for College Students Varies Across the State
The UC, CSU, and CCC have long recognized the need to provide mental health resources on campus, but have differed in their responses to meet increasing demand due to budget constraints and other factors. For that reason, students’ access to mental health services varies depending on the sector and campus.
At the UC, each campus has a Student Counseling Center that provides direct services, outreach and prevention services, and campus consultation services. In response to the increasing demand for mental health services at these centers, the UC Board of Regents approved a 5% annual increase in the Student Services Fee (SSF) for five consecutive years (2014 – 2019), with half of revenues earmarked for Student Mental Health. In 2018-19, the UC received $4.8 million in State General Fund in lieu of another SSF increase. As a result of this funding, UC was able to hire 70 Full Time Equivalent (FTE) counseling providers, reduce the average wait times for intakes from 12-18 days to 9-11 days, increase the use of case managers and launch integrated care efforts, and more.
The CSU campuses also provide myriad services to support students, focusing on efforts around education outreach, training, and acute crisis care. All campuses provide baseline mental health services: counseling, suicide and violence prevention, emergency crisis interventions, outreach, consultation, and referral resources.
Several CSU campuses have attempted to address the increased demand for mental health in a variety of innovative ways. Some campuses offer wellness workshops, a series of emotional well-being workshops led by counselors. At CSU Fresno, the Let’s Talk Program has allowed counselors to meet with students anonymously for 20-minute sessions in locations around campus, during which the counselor assesses the student’s need. Campuses have also invested in peer mentoring programs, which have “increased academic and social integration” as well as “improved student outcomes for all students, particularly those from historically underserved communities,” according to the CSU Office of the Chancellor.
CSU is also working to strengthen community partnerships in order to increase mental health services. Earlier this year, the Office of the Chancellor hosted a systemwide convening to connect campuses with their local county behavioral health offices. The goal of this convening was to develop partnerships that will bring additional mental health services to CSU students.
Compared to the UC and CSU systems, mental health services at the CCC appear to be less consistent, partly because community colleges typically do not offer their own health insurance plans. Currently, 90 of the 115 community colleges offer mental health services, with students averaging one to three counseling sessions per semester. Establishing health services is optional for community college districts, and districts that provide health services cannot charge a student health fee that exceeds $21 per semester, which means student health services are typically more scarce on campuses with relatively small student populations.
In 2011, CCC implemented the California Community Colleges Student Mental Health Program (CCC SMHP), a statewide effort focusing on prevention and early intervention. The CCC SMHP promotes faculty and staff training, peer counseling, and suicide prevention. According to a recent CCC SMHP report, nearly 168,000 students, faculty, and community members have been reached through prevention and early intervention trainings.
Barriers to Accessing Mental Health Support
One of the greatest challenges on California college campuses is that mental health funding has not kept pace with demand. This disinvestment in crucial services results in understaffed counseling offices, long wait times, and inadequate facilities — all of which negatively affect students seeking help.
The International Association of Counseling Services advisesthere to be one professional for every 1,000 to 1,500 students — an effort pushed for by legislators and vetoed by Governor Brown in 2018. Recent reports suggest that staffing ratios at the UC and CSU are close to that ratio (about 1,100 students per counselor at UC and 2,000 students per counselor at CSU); however, ratios at the CCC exceed more than 7,000 students per counselor. While the rates of both perceived and personal stigma have decreased in recent years, it is particularly salient for black students, Latinx students, and others who may already suffer from discrimination. Ensuring diversity among counseling staff may help with stigmatization and is a priority advocated for by students.
Before students can receive counseling, many must wait up to a few weeks for an available appointment. Additionally, many campuses have inadequate counseling infrastructure, with appointments taking place in non-discrete locations.
Current Budget and Policy Proposals to Improve Access to Mental Health Services
Improving access to mental health services for college students is a widely shared goal among policymakers, students, and institutional leaders. Several budget and policy proposals have been introduced this year from the legislature, Governor, and educational institutions.
In the legislature, AB1689 (McCarty) would create the College Mental Health Services Program, a matching grant program to enhance the provision of mental health services at CSU, UC, and CCC. Additionally, the Assembly’s budget provides $2 million ongoing and $3 million one-time of Proposition 63 state administration fund to support student mental health services at UC and CSU, and $10 million ongoing and $12 million one-time Proposition 63 state administration fund for the community colleges. The Senate’s budget allocates $550 million for “Mental Health Partnerships” between local behavioral health departments and K-12 schools, county offices of education, and public colleges within a county region.
For the UC, Governor Newsom’s proposed 2019-20 budget includes $5.3 million ongoing General Fund to improve mental health programs on campuses, which UC proposes using to hire more counselors and stabilize funding for existing counselors. Ultimately, UC notes that this funding would help to improve capacity for direct services, further enhance provider diversity, and bolster targeted prevention efforts for vulnerable students. In 2018-19, UC received $4.8 million in State General Funds to support expanding mental health services. This year, UC asked to make this funding permanent and ongoing and warned that without it, there is a potential for counseling staff layoffs, worsening accessibility, longer wait times, and decreased provider diversity.
For the CCC, there are no funds included in the Governor’s budget for the mental health needs of students. However, last year the legislature approved $10 million dollars of one-time funding in the 2018-19 state budget for California Community Colleges to support mental health services and training.
Mental Health Services Are Critical to Student Success
Given the increased rate of mental health issues among college students, California colleges must work to improve access to mental health services and treatment. Increased mental health funding should be directed to prevention and early intervention as well as direct services for students, considering that the demand for these services already exceeds the availability at many campuses across the state. Adequately funding these services can help mitigate the negative toll that mental health conditions can take and help students succeed academically.
There was a problem processing your signup. Please try again. Or contact us
Please check your email to confirm your signup.
Executive Summary
On May 9, Governor Gavin Newsom released the May Revision to his proposed 2019-20 state budget that continues to call for a series of bold investments in creating economic security and opportunities for Californians, while also fostering the state’s fiscal health.
The Governor forecasts revenues that are $3.2 billion higher (over a three-year “budget window” from 2017-18 to 2019-20) than projected in January, driven largely by continued economic growth.
The Governor’s proposal includes a mix of one-time and ongoing investments vital to low- and middle-income California’s economic prosperity, including: a significant expansion of the state’s Earned Income Tax Credit (EITC), investment in early childhood development, extending paid family leave, continuing to expand health coverage, increasing investment in K-12 and state higher education systems, and working toward greater access to mental health services. The Governor’s revised budget also provides additional support for housing and homelessness supports, recognizing that the high cost of housing continues to burden and destabilize many Californians. These proposals, individually and in combination, would significantly improve the health and well-being of millions of Californians, most notably low- and middle-income people of color, immigrants, and women and children.
The May Revision also continues to bolster the state’s fiscal resilience by building up reserves and paying down state debts and liabilities. While the Governor’s revised budget continues to call for a variety of program expansions, the May Revision sunsets some of those investments within a few years.
These proposals — a combination of one-time and ongoing investments, building up reserves, and paying down debts — represent a mostly balanced approach to managing the state’s fiscal health. But, there are opportunities to further enhance the state’s fiscal health and extend support to more Californians in need. By seeking an extension of California’s tax on health insurance plans — also known as MCOs — the state could move even closer to universal health coverage. The state also has room to further improve the economic and social well-being for all Californians, including older adults and people with disabilities, working immigrants who file their taxes and who are left out of the EITC expansion, and families with young children who are struggling to find affordable child care.
Download full report (PDF) or use the links below to browse individual sections of this report:
May Revision Reflects Short-Term Improvements in the Revenue Outlook, but Slowing Growth in the Long Term
The Governor’s revised budget assumes that General Fund revenues for the three-year budget window, spanning 2017-18 to 2019-20, will be $3.2 billion higher than projected in January, before accounting for transfers. After accounting for transfers, including deposits into the state’s rainy day fund and loan repayments, General Fund revenues are expected to be $1.9 billion higher than in the January forecast. However, these improvements are expected to be temporary, and the revised forecast reflects increasing risks and slower economic and revenue growth beyond the budget window.
The improved short-term outlook is driven by higher Personal Income Tax (PIT) and Corporation Tax (CT) receipts, while Sales and Use Tax (SUT) projections have been revised downward. PIT revenues for 2017-18 to 2019-20 are expected to be nearly $1.9 billion higher than projected in January, primarily reflecting upward revisions in capital gains realizations due to an improved stock market forecast. Capital gains realizations are now expected to return to a normal level by 2022 — one year later than was forecast in the January budget proposal. The revised budget notes that new tax return data for 2017 shows that the income distribution was less skewed toward higher-income taxpayers than previously assumed, which offsets some of the expected revenue increases.
Expected CT revenues have been revised upward by over $1.7 billion, but this is largely due to the shifting of income from 2017 to 2018 and one-time payments associated with the 2017 federal tax law. The projection for SUT revenues was adjusted downward by $360 million, reflecting lower than expected growth in capital investments, lower cannabis sales, and higher utilization of the sales tax exemption for manufacturing equipment. Slightly offsetting these decreases is a modest increase in the expected revenue boost resulting from the US Supreme Court ruling in Wayfair v. South Dakota and the state’s recently enacted AB 147, which expand the state’s ability to require out-of-state retailers and marketplace facilitators to collect use tax.
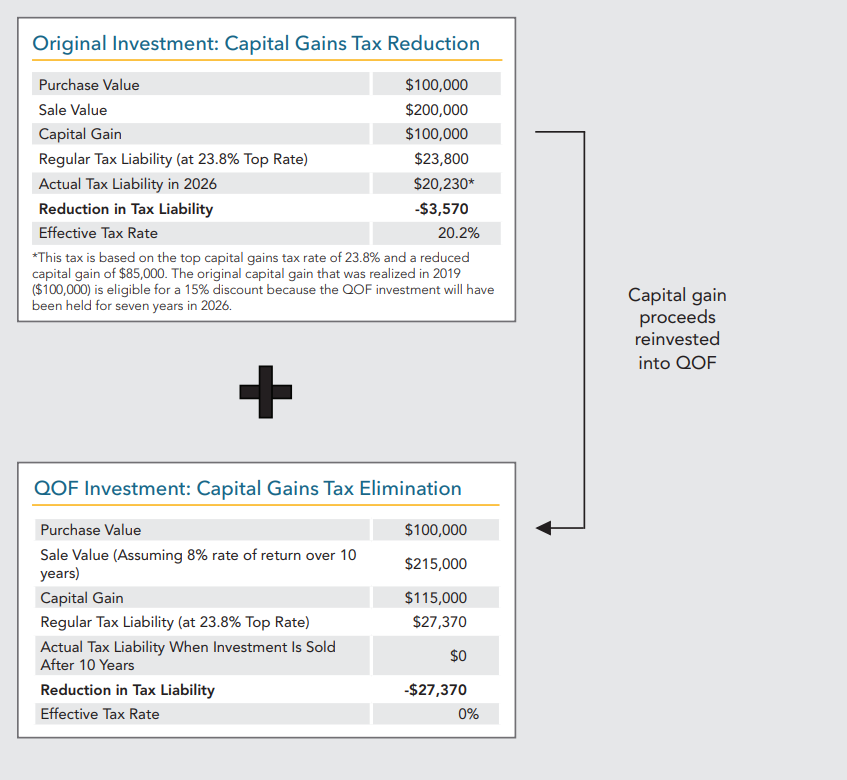
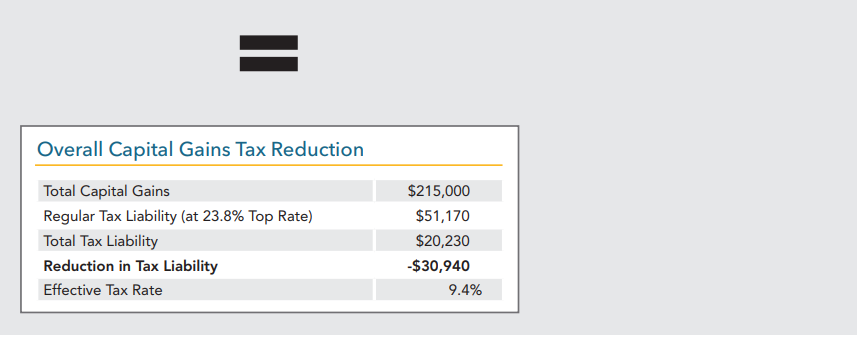
The May Revision includes some policy proposals that, while well-intended, would reduce available revenues. As in the January budget proposal, the revised budget includes a proposal to adopt (or “conform to”) certain provisions of the 2017 federal tax law, some of which would decrease state revenues. One of these items would allow for deferred and reduced capital gains taxes for individuals and corporations that make investments in economically-distressed census tracts designated as Opportunity Zones. The Governor proposes to limit these tax incentives to investments in affordable housing and green technology within the state. Additionally, the tax conformity package includes a provision that would allow small businesses more flexibility in the accounting methods used for tax purposes.
The May Revision also contains a new proposal to exempt diapers and menstrual products from sales taxes for two years, beginning in January 2020. This would result in decreased General Fund revenues of $17.5 million in 2019-20 and $35 million in the following year. Additionally, since a portion of sales tax revenues are allocated to local governments, cities and counties would see revenue reductions. The total state and local revenue losses due to these exemptions is projected to be $38 million in 2019-20 and $76 million in 2020-21.
Revised Budget Proposal Continues to Build Up Reserves to Bolster State’s Fiscal Resilience
California voters approved Proposition 2 in November 2014, amending the California Constitution to revise the rules for the state’s Budget Stabilization Account (BSA), commonly referred to as the rainy day fund. Prop. 2 requires an annual set-aside equal to 1.5% of estimated General Fund revenues. An additional set-aside is required when capital gains revenues in a given year exceed 8% of General Fund tax revenues. For 15 years ─ from 2015-16 to 2029-30 ─ half of these funds must be deposited into the rainy day fund and the other half is to be used to reduce certain state liabilities (also known as “budgetary debt”). Prop. 2 also established a new state budget reserve for K-12 schools and community colleges called the Public School System Stabilization Account (PSSSA). The PSSSA requires that, when certain conditions are met, the state deposit a portion of General Fund revenues into the new reserve as part of California’s Proposition 98 funding guarantee (See Prop. 98 section).
The Governor’s May Revision includes a total transfer of $2.2 billion to the BSA for 2019-20, which will bring the reserve’s balance to $16.5 billion by the end of the fiscal year. Prop. 2 requires that when the BSA balance has reached its constitutional maximum of 10% of General Fund tax revenues, any additional dollars that would otherwise go into the BSA must be spent on infrastructure, including spending on deferred maintenance. However, while the BSA has already reached this maximum (total proposed General Fund Expenditures for 2019-20 are $147 billion), the Governor’s budget assumes that constitutionally required deposits will continue to be made because the account’s current balance was achieved in part through supplemental payments in prior years. This assumption is based on an opinion by the Legislative Counsel, but could be subject to a legal challenge.
The revised budget also includes a deposit of $389.3 million into the PSSSA, the first time such a deposit would be made into this reserve.
Additionally, the 2018-19 budget agreement created the Safety Net Reserve Fund, which holds funds that can be used to maintain benefits and services for CalWORKs and Medi-Cal participants in the event of an economic downturn. The May Revision maintains a proposed $700 million deposit into the Safety Net Reserve, bringing the fund’s balance to $900 million.
Each year, the state also deposits additional funds into a “Special Fund for Economic Uncertainties” (SFEU). The Governor’s proposed budget assumes an SFEU balance of $1.6 billion.
Taking into account the BSA, PSSSA, Safety Net Reserve, and SFEU, the Governor’s proposal would build state reserves to a total of $19.4 billion in 2019-20.
The Governor’s revised proposal continues to prioritize paying down state and local unfunded pension liabilities and paying off outstanding budgetary debt incurred during the Great Recession and its aftermath.
The May Revision continues to include required and supplemental contributions to two state-run retirement systems: the California Public Employees’ Retirement System (CalPERS) and the California State Teachers’ Retirement System (CalSTRS). CalPERS and CalSTRS, like many retirement systems, are not funded at levels that will keep up with future benefits, resulting in the state needing to make higher annual contributions in order to pay down unfunded liabilities.
Beyond statutorily required contributions, the Governor’s revised budget maintains the January proposal to provide a $3 billion supplemental pension payment to CalPERS that would be made in the current fiscal year (2018-19).
In the case of CalSTRS, the budget proposal continues to devote an additional $1.1 billion toward the state’s share of CalSTRS unfunded liabilities. The $1.1 billion comes from Prop. 2 funds (see Reserves section) that are required to be set aside for reducing state liabilities.
In addition, the Governor’s revised budget includes a one-time $3.2 billion non-Proposition 98 payment to CalSTRS to reduce the employers’ (local educational agencies and community colleges) share of unfunded liabilities in response to prior changes in contribution levels and pressures confronting employers. This is slightly higher than the $3 billion proposed in January for this purpose. In 2014, the state enacted AB 1469, increasing the share of CalSTRS costs borne by all parties (the state, employers, and teachers), but particularly increasing the contribution rate of employers. Confronting a series of other pressures, including enrollment decline and increases in the costs of local services, some local educational agencies are in danger of not being able to meet their financial obligations. Overall, the proposed supplemental payment would free up local dollars for investment in education, allow employers to pay down retirement obligations, or close budget deficits.
As with the January proposal, the revised budget would pay off all remaining outstanding budgetary debts and deferrals incurred during the Great Recession.
May Revision Further Expands the California Earned Income Tax Credit
The California Earned Income Tax Credit is a refundable state tax credit that boosts the incomes of low-earning workers and their families, helping them to afford necessities, such as utilities or food. The May Revision proposes to further expand the credit beyond the plan included in the Governor’s January budget and also to rename the credit the “California EITC, a cost-of-living refund.” Specifically, the revised budget would double a component of the California EITC that the Governor proposed creating in January. This component, the “young child tax credit,” would provide an additional $1,000 — up from $500 proposed in January — for each tax filer who is eligible for the California EITC and has at least one qualifying child under age 6. This revised proposal would increase the maximum California EITC for families with at least one qualifying child under age 6 from:
• Nearly $2,900 currently to nearly $3,900 if the family has a total of 3 or more qualifying children;
• From more than $2,500 to more than $3,500 if the family has two qualifying children; and
• From more than $1,500 to more than $2,500 if the family has one qualifying child.
As proposed in January, the young child tax credit would “phase-out” (decline) for families with annual earnings over $28,000. The credit would fully phase out for families with annual earnings of $30,000.
The Administration estimates that the Governor’s revised California EITC expansion plan will reduce state personal income tax (PIT) revenue by $190 million more than in January, increasing the cost of the proposed expansion from $600 million to $790 million. As a result, the total cost of the California EITC is estimated to be about $1.2 billion under the revised proposal, up from $1 billion under the January proposal.
The May Revision maintains the Governor’s January proposal to offset the cost of the expanded California EITC by conforming to several federal tax law provisions — mainly affecting business income – that would, on net, increase state revenue. However, the May Revision increases the number of provisions to which the Governor is proposing that California conform, according to Administration officials. One notable addition is the proposal to conform to federal law that generally prohibits corporations and other taxpayers to carry back a net operating loss (NOL). (A NOL occurs when a taxpayer’s total tax deductions exceed total income for the tax year. NOLs can be claimed by both corporate and individual taxpayers, but are usually related to losses from operating a business.) The Administration projects that, collectively, its conformity package will increase state revenue by $1.7 billion in 2019-20 and by roughly $1.4 billion per year thereafter. Because this package would raise revenue by increasing state taxes — primarily on corporations and other businesses — it would require a two-thirds vote of each house of the Legislature.
The May Revision also proposes to provide $18.7 million in 2019-20 for the Franchise Tax Board (FTB) to develop and administer a program that would give tax filers who qualify for the California EITC the option to receive a portion of their credit as advance monthly payments. Budget documents state that this program “is targeted to begin in 2021,” contingent upon determination by the Department of Finance that this program will not affect tax filers’ eligibility for any state or federal income-based supports. This contingency is in response to concerns that have been raised by the Legislative Analyst’s Office and others that providing periodic, advanced payments of the California EITC could reduce the amount of support families receive from other sources. According to Administration officials, tax filers who expect to qualify for a California EITC of more than $1,200 would be eligible to receive half of their expected credit in advance monthly payments. This would allow participants in the program to receive advance payments of at least $50 per month.
Budget documents do not provide any additional details about the Governor’s January proposal to provide $5 million one-time General Fund to nonprofits, community-based organizations, or governmental entities that provide increased awareness of the California EITC and free tax preparation services.
The Governor’s May Revision also does not extend the California EITC to low-earning immigrants and their children who are currently ineligible due to a rule requiring tax filers and all of the children they claim to have Social Security Numbers (SSNs) valid for work in order to qualify for the credit. Hundreds of thousands of additional low-income working families would become eligible for the California EITC — at relatively little cost — if California permitted tax filers to claim the credit using a federally assigned Individual Taxpayer Identification Number (ITIN) or any federally assigned SSN.
Governor Maintains Proposal to Raise CalWORKs Grants to the Deep Poverty Threshold for Some Families
The California Work Opportunity and Responsibility to Kids (CalWORKs) program provides modest cash assistance for over 775,000 low-income children while helping parents overcome barriers to employment and find jobs. Monthly grants are adjusted according to the size of the CalWORKs assistance unit (AU), which is the number of people in the household who are eligible for CalWORKs. According to the Legislative Analyst’s Office, at least one family member is ineligible for cash assistance in about 55% of CalWORKs cases. In these cases, the AU size is smaller than the family size. A family member may be ineligible if they have exceeded the 48-month time limit, have not met work requirements, or due to their immigration status.
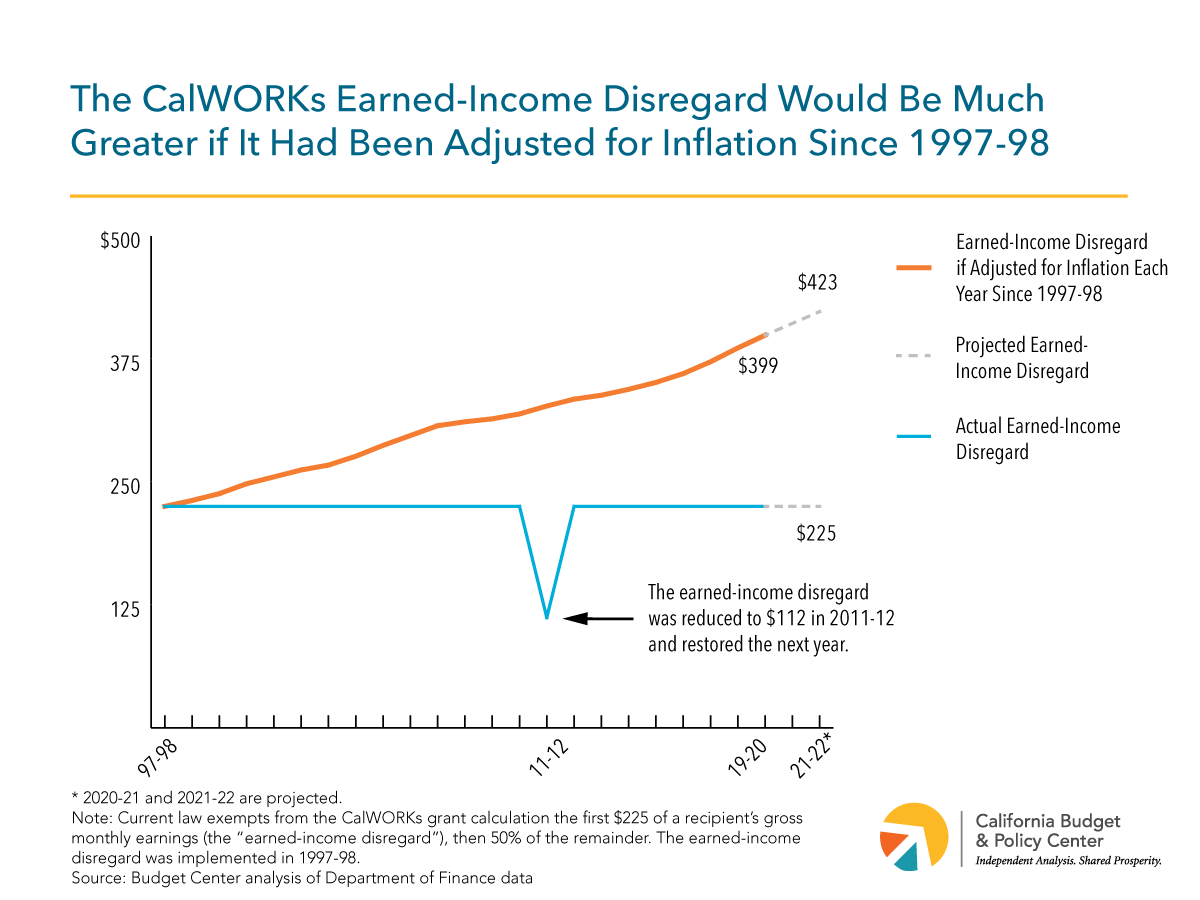
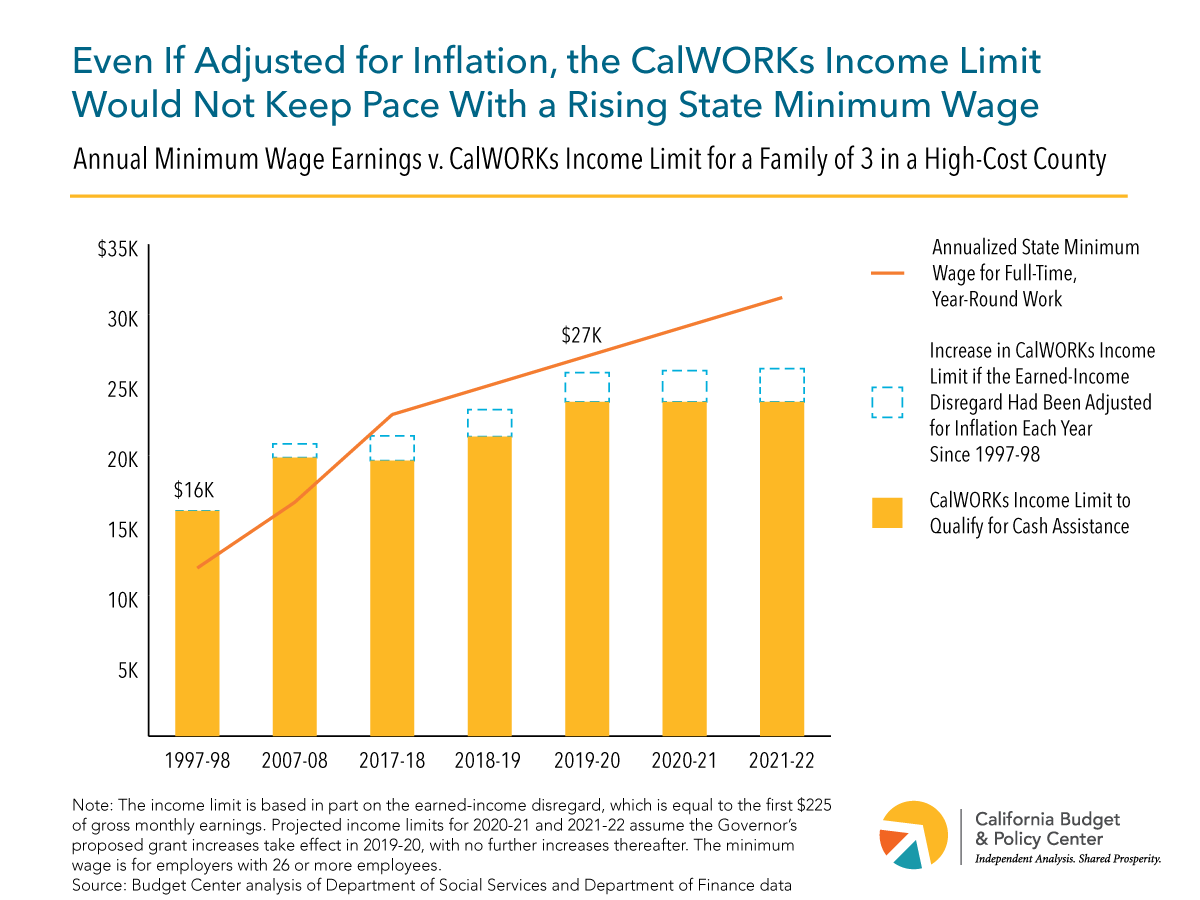
The annualized maximum CalWORKs grant for a family of three has been well below the deep poverty threshold (50% of the federal poverty line) for over a decade. To better serve CalWORKs families, the state took the first of three proposed steps in the 2018-19 budget package to raise the maximum grant to the deep poverty threshold. The first step was an across-the-board 10% increase that began April 1, 2019. The proposed second and third steps (subject to annual appropriations in 2019-20 and 2020-21) would seek to close the gap between the new maximum grants and the deep poverty threshold for all CalWORKs families.
In January, Governor Newsom presented a different plan to raise CalWORKs grants. He proposed allocating $347.6 million General Fund in 2019-20 for an additional 13.1% grant increase for all assistance units, effective October 1, 2019. This increase would immediately raise the maximum grant to 50% of the federal poverty line for a three-person AU where the AU size equals the family size. However, the proposed increase would still leave children in a one-person AU (which represent over a quarter of all CalWORKs cases) at 43% of the federal poverty line. Additionally, because the Administration’s proposed budget does not provide funding for ineligible family members, children in all AUs sharing resources with ineligible members (about 55% of all CalWORKs cases) would still live in deep poverty.
May Revision Extends the Duration of California’s Paid Family Leave Program
Paid family leave has the potential to benefit both children and parents, boosting health and well-being, while also providing savings for both businesses and the state. California leads the nation in paid family leave policy, but the state and the nation lag other wealthy countries in terms of the length of leave and the level of benefits. The California Paid Family Leave (PFL) program is funded entirely by workers’ contributions to the state’s Disability Insurance Program. These contributions are housed in a special fund that provides 60% to 70% of a worker’s weekly earnings based on income when a worker takes family leave. Caregivers can currently take up to six weeks of paid time off to care for a family member or bond with a newborn or adopted child. Birth mothers are generally allowed another six weeks to recover from the birth, for a total of 12 weeks.
In January, the Governor expressed a commitment to expand the PFL program to six months in future years. The May Revision takes the first step towards this goal by extending the duration of the PFL program from six weeks to eight weeks, effective July 1, 2020. In order to ensure that the special fund that pays PFL claims can provide additional benefits, the state would reduce the minimum reserve balance to a lower level, which the Administration states will be adequate. Finally, the May Revision affirms the plan to convene a PFL task force in the near future in order to provide recommendations on how to expand the program. The task force recommendations would be due in November and could be included in the 2020-21 budget.
May Revision Maintains Funding for Child Care “Infrastructure” While Expanding Access to Care for Older Children
Subsidized child care allows parents with low and moderate incomes to find jobs and remain employed, but the high cost of care across California often forces parents to make difficult choices about who cares for their child while they go to work. Due to a lack of state and federal funding, in 2017 just 1 in 9 children eligible for subsidized child care and development programs in California were enrolled in a program that could accommodate families for more than a couple hours per day and throughout the entire year.
The Governor’s May Revision maintains provisions included in the January proposal to invest $490 million General Fund in child care “infrastructure,” split equally between a facilities grant program and a workforce development program, as well as $10 million General Fund for a comprehensive plan to increase access to the subsidized child care and development system. The May Revision expands upon the January proposal by proposing new investments that would increase access to subsidized child care for certain children. Specifically, the Administration:
Provides $80.5 million from the Cannabis Tax Fund to add spaces for school-age children. After certain administrative, regulatory, and research activities have been funded, remaining resources in the Cannabis Tax fund are to be directed to a number of programs and services, including youth-related drug education, prevention, and treatment. The Governor proposes using $80.5 million from the estimated $198.8 million available in the Cannabis Tax Fund to increase access to subsidized child care for income-eligible families with school-age kids to “keep these children occupied and engaged in a safe environment, thus discouraging potential use of cannabis.” In a phone call with the Administration, it was noted that this level of funding would serve about 8,700 children.
Provides $40.7 million General Fund to implement a 12-month eligibility period for certain CalWORKs families. Currently, upon initial determination of eligibility, most families participating in the state’s subsidized child care and development system establish a 12-month period of eligibility. However, CalWORKs Stage 1 child care, which is available to families newly enrolling in the welfare-to-work program, do not have this same benefit. The May Revision would extend 12-month eligibility to families participating in CalWORKs Stage 1 child care, which is intended to stabilize childcare for these welfare-to-work families. The ongoing cost is estimated to increase to $54.2 million General Fund in future years.
Provides $12.8 million in federal funds for a pilot emergency child care program. The May Revision creates a pilot program that would provide subsidized child care for families in crisis that are currently waiting for subsidized care in the Alternative Payment Program. The Speaker of the Assembly’s Blue Ribbon Commission on Early Childhood Education proposed a similar program in their recent comprehensive report.
The Administration has made it clear that they intend to invest in the state’s subsidized child care and development system. The May Revision reinforces this intention by maintaining funding for child care infrastructure and a comprehensive plan to increase access to the system, while also providing additional slots for certain children. Yet, the May Revision does not provide more low- and moderate-income families with young children with access to subsidized child care, despite years-long waiting lists and a high level of unmet need.
Governor Maintains Investment in Child Savings Accounts for Kindergarteners
A Child Savings Account (CSA) is an account established for children as early as birth that builds assets over time. CSAs are generally seeded with an initial deposit from a government agency or another sponsoring organization, then built with contributions from family, friends, or the child. Once the child reaches adulthood, the savings are typically used for higher education, though they can also support homeownership or other asset-building investments.
The May Revision maintains a one-time investment of $50 million General Fund for Child Savings Account pilot programs and identifies the California Student Aid Commission, with consultation from First 5 California, as the administrator of the pilot programs.
May Revision Maintains Housing Production Expenditures, Adds Funds for Legal Aid for Renters
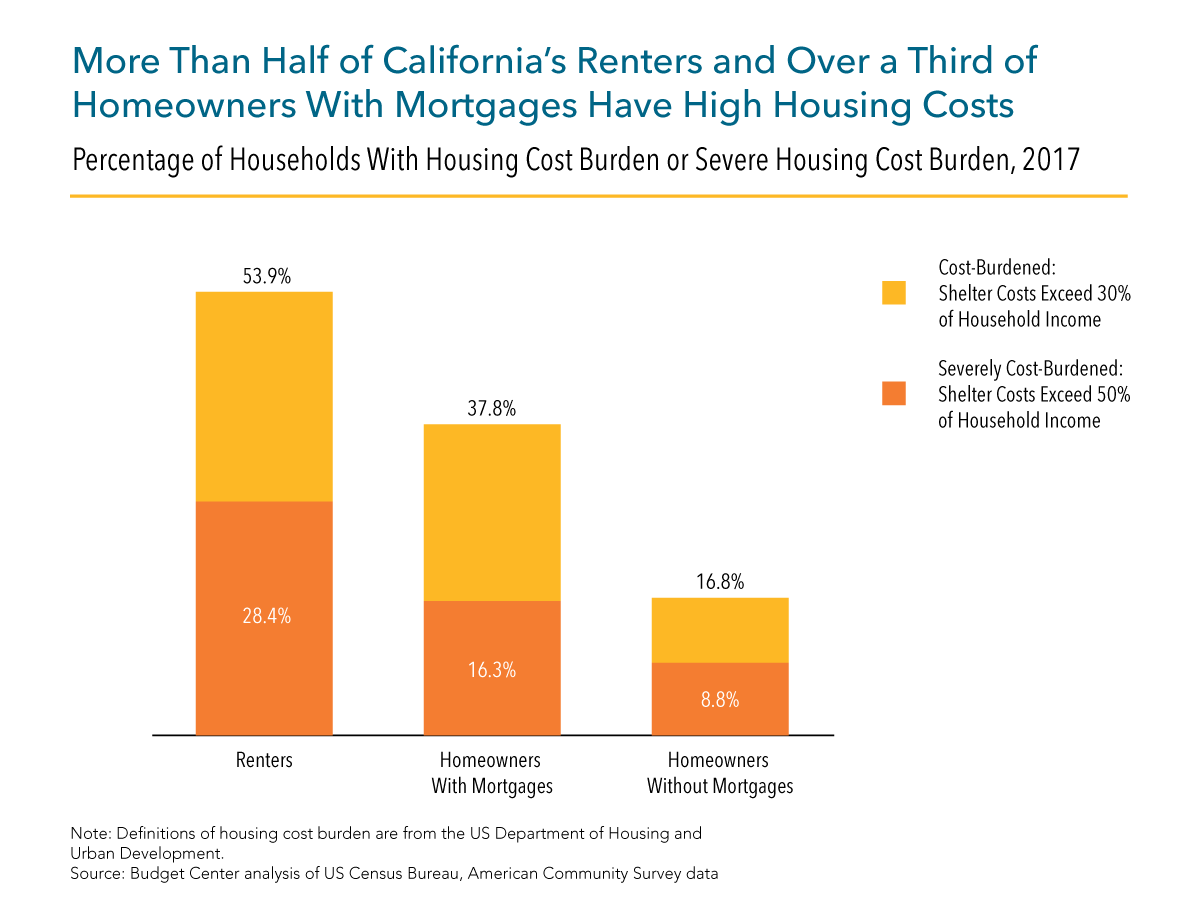
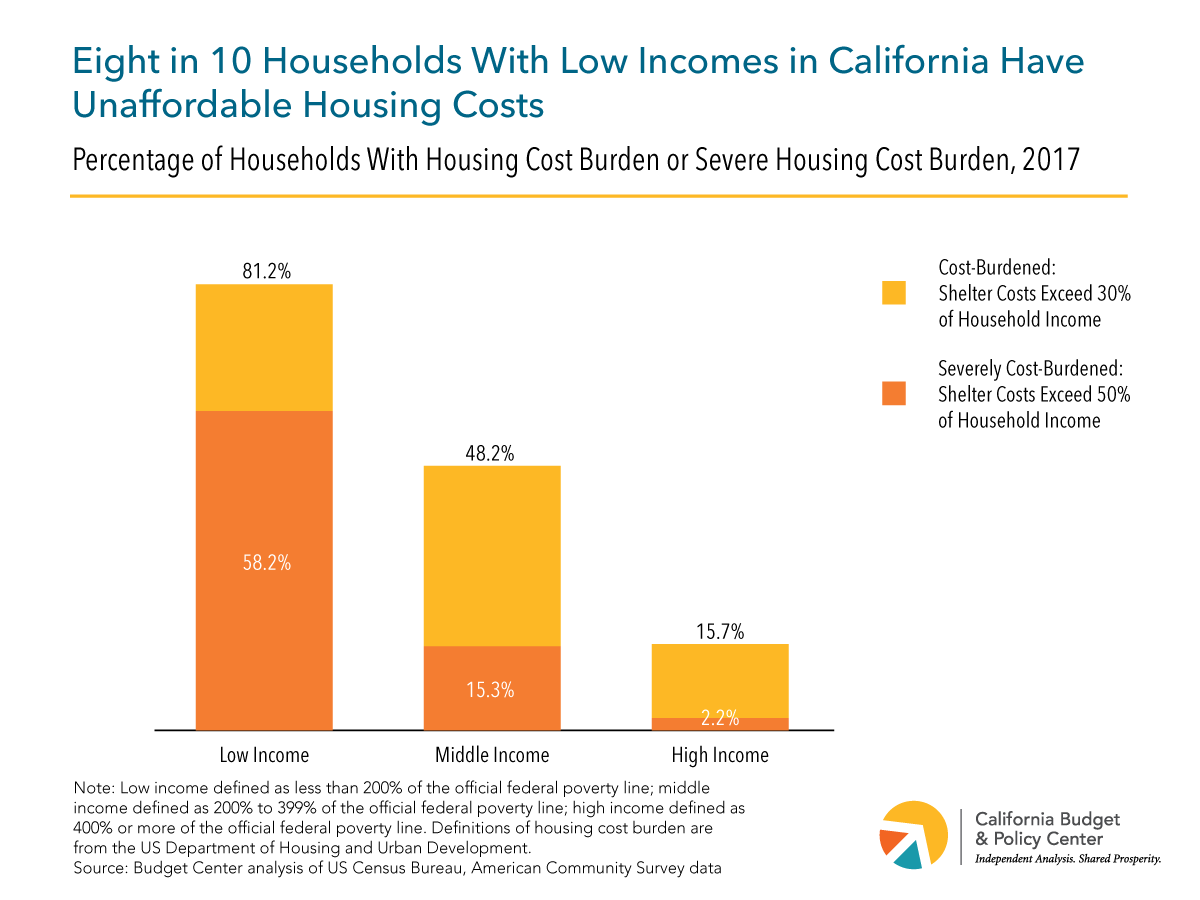
More than half of California renter households pay more than 30% of their income toward rent. The state’s lowest-income households are most likely to struggle with housing affordability, and high housing costs are a key driver of California’s high poverty rate. The Governor’s May Revision generally maintains the state investment in housing production proposed in January, with some modification of funding allocation and some minor increases in spending.
Several proposals relate to local housing production goals and accountability. Specifically, the May Revision:
Reallocates $500 million in local incentive funds for housing production. In January, the Administration proposed $750 million one-time General Fund to support local planning and incentives for housing production, including $500 million to be awarded for “general purposes” as local jurisdictions meet housing production milestones. The May Revision reallocates this $500 million to the Infill Infrastructure Grant Program administered by the Department of Housing and Community Development, which funds infrastructure needed to support development of higher-density and mixed-income housing in infill locations. For the $250 million proposed in the January budget for planning, the Administration also adds school districts and county offices of education to the jurisdictions eligible for support (e.g., for planning for teacher housing).
Maintains the Governor’s January proposal to link local transportation funding to housing production goals. Specifically, the Administration proposes that transportation funds available through Senate Bill 1, the Road Repair and Accountability Act of 2017 (the “gas tax”), be distributed to local jurisdictions “upon compliance with housing element law and zoning and entitling to meet updated housing goals.”
Retains the January plan to “revamp” the Regional Housing Needs Allocation (RHNA) process through which local housing production goals are set, but proposes maintaining the current RHNA process for the short-term. The Department of Housing and Community Development would work toward developing long-term housing production targets through a new RHNA process by 2022.
The Governor proposes no additional state tax expenditures in the May Revision for affordable housing production through the state Low Income Housing Tax Credit (LIHTC), maintaining the boost of $500 million proposed in January as well as the January budget’s increased commitment to supporting mixed-income housing with both tax credits and loans. To support preservation and rehabilitation of existing affordable housing units, the May Revision includes a new proposal to modify the existing LIHTC program to allow for “deeper subsidies for specified preservation projects,” but no increase in overall LIHTC expenditures for this purpose is proposed.
Additional proposals relate to use of excess state property and cap and trade proceeds. Building on the January proposal to make excess state property available for affordable and mixed-income housing demonstration projects, the May Revision adds $2.5 million one-time General Fund, as well as $780,000 ongoing and four staff positions, to enable the Department of Housing and Community Development to facilitate and monitor the use of state land for these housing projects. Funding from cap and trade auction proceeds is available to support housing production and other neighborhood projects through the Transformative Climate Communities program. The Governor’s January budget proposed $40 million for this program, and the May Revision allocates an additional $92 million one-time from higher-than-anticipated cap and trade revenues, bringing the total to $132 million.
As a new proposal, the May Revision proposes allocating $20 million one-time to support legal aid for renters to resolve landlord-tenant disputes. Funds would be distributed as grants to nonprofit legal aid organizations through the Judicial Branch’s Equal Access Fund.
May Revision Proposes Some Additional Funding to Address Homelessness
California has nearly 25% of the nation’s population of homeless individuals, with an estimated 134,000 homeless residents as of January 2017. In the May Revision, the Administration continues to highlight homelessness as a key challenge facing California. The revised budget includes increases in funding for some specific proposals that address the needs of individuals who are homeless or at risk of homelessness:
The January proposal’s allocation of $500 million in one-time General Fund dollars for local jurisdictions to support homeless emergency aid would be increased by $150 million, for a new total of $650 million. The January proposal divided these funds between $300 million for activities directly related to shelter or navigation center development and $200 million as incentive funds available “for general purposes,” but the May Revision does not make this distinction. The May Revision also specifies how these funds would be allocated among jurisdictions, with $275 million for the state’s 13 most populous cities, $275 million for counties, and $100 million for Continuums of Care. Eligible uses for the funds would also be expanded to include hotel/motel conversions, permanent supportive housing, rapid re-housing, and jobs programs.
A $20 million one-time augmentation from the Mental Health Services Fund is proposed for counties that do not currently operate Whole Person Care Pilot Programs, adding to the $100 million for Whole Person Care Pilots included in the January budget. The increase in funding in the May Revision would allow these additional counties to coordinate health, behavioral health, and social services, including housing, for targeted individuals, with priority for individuals with mental illness who are homeless or at risk of homelessness (see also the Mental Health section).
To support college students who are homeless or housing insecure, the May Revision proposes $10 million in new ongoing General Fund for the state’s public four-year universities ($6.5 million for the California State University and $3.5 million for the University of California). This proposal builds on the $30 million dedicated to addressing student food and housing insecurity in the January budget (see also the CSU and UC section).
The Administration notes that with these additions, overall state funding to address homelessness will total $1 billion more than the amount dedicated to homelessness in the current state budget. This $1 billion increase includes all funding for housing and mental health services for homeless individuals proposed in Governor Newsom’s January budget, the new funding described above, and additional spending proposed in the May Revision to address staffing shortfalls in the public mental health system and to provide legal aid for renters.
The May Revision also proposes that after the closure of the state’s Fairview Developmental Center in Orange County (expected by the end of 2019), the state repurpose the site by leasing a building or buildings to a local jurisdiction to provide permanent supportive housing for individuals who are homeless or at risk of homelessness.
May Revision Makes Modest Adjustments to Immigration Proposals
California has the largest share of immigrant residents of any state, and half of all California workers are immigrants or children of immigrants. Given the prominence of immigrants in California’s population and the state’s economy, recent and ongoing federal actions that limit immigration, aggressively enforce immigration laws, and seek to exclude immigrant communities have significant negative implications for California. The May Revision creates two new pilot programs but otherwise maintains the proposals included in the January budget with minor adjustments. Specifically, the updated spending plan:
Creates two pilot projects to support unaccompanied minors and Temporary Protected Status beneficiaries. The January budget proposal allocated $10 million out of the $58 million total for immigrant legal services to the Department of Social Services to unaccompanied undocumented minors and Temporary Protected Status beneficiaries. The Governor proposes to use up to $5 million of these funds for two pilot projects. The first pilot project would provide “mental health evaluations related to legal defense” and the second pilot project would develop a family reunification navigator to connect undocumented minors and their families with services in the community.
Maintains expansion of eligibility for comprehensive Medi-Cal coverage to undocumented young adults ages 19 through 25. This proposal remains unchanged from January but reflects a decrease in state funding as a result of a later start date and revised estimates of the number of people eligible. The revised budget delays the implementation date to January 1, 2020, six months later than the initial proposed start date. The May Revision estimates that 90,000 undocumented young adults would enroll in full-scope Medi-Cal coverage during the first year, a decrease from the Governor’s 138,000 projection in January.
Provides a modest increase in funding for legal services for undocumented immigrant students and their families at the UC beginning in 2022-23. The May Revision increased funding for legal services at the UC to $1.7 million, a modest increase from $1.3 million initially allocated in the Governor’s January budget proposal. The Administration noted in January that the 2018-19 budget allocated sufficient funding to sustain legal services through 2021-22.
The Governor remains adamant that the State “be a part of a multi-lateral solution” to address immigration issues nationally and in California. Still, the revised budget proposal omits key priorities advocates and legislators have pushed for in the recent months. Proposals not included in the May Revision include extending the CalEITC to immigrant workers who file taxes with an Individual Taxpayer Identification Number (ITIN) and expanding full scope Medi-Cal coverage to immigrants 26 years and older. While California continues to make strides to provide support and create safe communities for immigrants, ensuring that all Californians are protected and can access economic opportunity requires enacting policies that extend vital state supports to immigrants and their families.
May Revision Maintains Proposals to Improve Health Insurance Affordability and Move Toward Universal Coverage
Building on the federal Affordable Care Act (ACA), California has substantially expanded access to health coverage in recent years. For example, more than 13 million Californians with modest incomes receive free or low-cost health care through Medi-Cal (California’s Medicaid program) — several million more than before the ACA took effect. Another 1.2 million Californians with incomes up to 400% of the federal poverty line — $48,560 for an individual in 2019 — receive federal premium subsidies to reduce the cost of coverage purchased through Covered California, our state’s health insurance marketplace. Despite these gains, around 3 million Californians remain uninsured, health care costs continue to rise, and many people face both high monthly premiums and excessive out-of-pocket costs — such as copays and deductibles — when they use health care services.
The May Revision maintains, with some changes, key proposals that the Governor introduced in January to help move California toward universal health coverage. Specifically, the revised budget:
Maintains the Governor’s proposal to create state subsidies to reduce the cost of health insurance purchased on the individual market. The Governor’s original proposal allowed Californians with incomes between 250% and 600% of the federal poverty line to receive these new subsidies. The May Revision would extend these subsidies to Californians with incomes between 200% and 250% of the poverty line as well. Overall, these new state subsidies would cost an estimated $295 million in 2019-20, rising to $380 million by 2021-22, and would be paid for with revenues from a new state penalty on residents who do not obtain comprehensive health coverage (see next bullet). The May Revision assumes that about three-quarters of subsidy expenditures would benefit Californians with incomes between 400% and 600% of the poverty line, with an average subsidy of around $100 per month. Subsidies would average around $10 per month for residents with incomes between 200% and 400% of the poverty line. (Californians in this income range would continue to be eligible for federal ACA subsidies if they purchase health insurance through Covered California.) Finally, the May Revision assumes the subsidies would take effect on January 1, 2020, and expire in three years.
Continues to assume the state will impose a new requirement for Californians to carry health insurance or pay a penalty. The ACA included an “individual mandate” to encourage young and healthy people to buy health insurance. The goal was to create healthier “risk pools” and keep premiums lower than they otherwise would be if only older and sicker people signed up for coverage. With limited exceptions, people who failed to comply with this requirement had to pay a penalty to the federal government. However, Congress and President Trump eliminated the individual mandate penalty effective January 1, 2019. The Governor proposes to establish an individual mandate at the state level, which would require Californians to obtain comprehensive health care coverage or pay a penalty. The May Revision assumes this penalty would take effect on January 1, 2020, and would raise an estimated $317 million in 2020-21, rising to $353 million in 2022-23. As described above, these revenues would be used to fund the proposed state subsidies.
Maintains the Governor’s proposal to expand eligibility for comprehensive Medi-Cal coverage to undocumented young adults who otherwise meet the program’s requirements, but changes the implementation date. States are prohibited from using federal dollars to provide comprehensive, or “full-scope,” Medicaid coverage to undocumented immigrants. States, however, may use their own funds to provide such coverage. In 2016, California expanded full-scope Medi-Cal coverage to undocumented children and youth through age 18 who meet all other eligibility requirements, including income limits. In January, the Governor proposed to extend this policy to undocumented Californians ages 19 through 25, effective no sooner than July 1, 2019. At the time, it was estimated that 138,000 undocumented young adults would sign up for full-scope Medi-Cal under this policy. In contrast, the May Revision assumes that this change would take effect no sooner than January 1, 2020, with about 90,000 young adults signing up during the first year.
May Revision Allocates an Additional $263 Million in Proposition 56 Revenues to Support the Medi-Cal Program
Approved by California voters in 2016, Proposition 56 raised the state’s excise tax on cigarettes by $2 per pack and triggered an equivalent increase in the state excise tax on other tobacco products. These increases took effect on April 1, 2017. Prop. 56 requires most of the revenues raised by the measure to go to Medi-Cal, which provides health care services to more than 13 million Californians with low or moderate incomes.
In January, the Administration projected that Medi-Cal will receive around $1 billion in Prop. 56 revenues in 2019-20. The Governor proposed to use these funds to increase payments to doctors, dentists, and other providers as well as to support other services, including early developmental screenings for children, screenings for trauma for children and adults, and family planning services.
The May Revision indicates that Medi-Cal will receive an additional $263 million in Prop. 56 revenues “due to a one-time fund reallocation.” The revised budget allocates these funds to several purposes, including $120 million for a loan repayment program for doctors and dentists who commit to serve Medi-Cal beneficiaries and $60 million to train providers to conduct trauma screenings. In addition, the Governor proposes to use $11.3 million of these Prop. 56 funds to restore optician and optical lab services for adults enrolled in Medi-Cal, effective no sooner than January 1, 2020. This optional Medi-Cal benefit was cut during the Great Recession to help close a state budget shortfall. Finally, the May Revision assumes that “the package of Proposition 56 investments” will expire on December 31, 2021.
Revised Budget Increases Funding for Home Visiting and Black Infant Health Programs
A new home visiting initiative in the California Work Opportunity and Responsibility to Kids (CalWORKs) program was instituted in the 2018-19 budget and began on January 1, 2019. The program provides up to 24 months of evidence-based home visiting for CalWORKs parents who are either pregnant or parenting a child under age 2, with a priority for first-time parents. A total of $158.4 million in federal TANF and state General Fund dollars was set aside to fund home visiting through calendar year 2021, after which the initiative will be subject to annual appropriation. In January, Governor Newsom proposed allocating $78.9 million for the 2019-20 budget year. His revised budget includes an additional $10.7 million to reflect updated caseload projections for a total of $89.6 million in 2019-20. The home visiting program is expected to serve 18,500 CalWORKs cases.
The Governor’s January proposal also called for $30.5 million General Fund to the Department of Public Health to support the Black Infant Health program ($7.5 million) and to expand home visiting outside of CalWORKs ($23 million). The proposed $23 million represented the state’s first financial investment in home visiting for non-CalWORKs families. In the revised proposal, the Administration includes an additional $34.8 million in reimbursements from the Department of Health Care Services to support Medicaid-eligible activities. Of the $34.8 million, $12 million ($11.95 million unrounded) will support Black Infant Health and $22.9 million ($22.87 million unrounded) will support the California Home Visiting program. With these reimbursements, the total proposed investment to these programs is $65.3 million in 2019-20.
May Revision Builds on Investments in Mental Health Services
Mental health services in California are primarily provided by counties, with funding from the state and federal government. The mental health system confronts many challenges, such as rising homelessness (a substantial share of individuals who are homeless struggle with mental illness) and the need for crisis services. To help address these challenges, the revised budget includes additional funding and new proposals to improve mental health outcomes. Specifically, the May Revision:
Includes a one-time investment of $20 million Mental Health Services Fund over five years for counties that currently do not operate Whole Person Care Pilot Programs — which provide additional supportive housing services for people who are homeless or at risk of becoming homeless, with a focus on mental health. This is in addition to the $100 million one-time General Fund proposed in the Governor’s budget for counties that currently operate pilots.
Allocates $3.6 million Mental Health Services Fund annually for three years to the Department of Health Care Services to establish a Peer-Run Mental Health Crisis Line. This crisis line would be a resource for those “on the brink of a mental health crisis,” according to the Governor’s budget summary.
The Governor’s Revised Budget Includes Additional Funding for State Hospitals
The Governor’s revised budget proposes additional funding to the Department of State Hospitals (DSH), which manages the state mental health hospital system. Specifically, the May Revision:
Provides $5.7 million General Fund for DSH to contract for a 78-bed community step-down program to serve individuals with a mental illness — both “Mentally Disordered Offenders and Not Guilty by Reason of Insanity commitments” — who are preparing for conditional release from state hospitals within 18 to 24 months. This funding also includes increasing an existing contract by four beds for a total of 24 beds.
Provides $2.2 million General Fund for DSH to expand the use of telepsychiatry to treat patients remotely via video-conferencing.
May Revision Includes Additional Investments in the Health Care Workforce
In order to address increasing demand for health care providers, the Governor’s revised budget:
Maintains $50 million one-time General Fund to increase support for mental health workforce programs. This funding would be administered by the Office of Statewide Health Planning and Development.
Includes $38.7 million Proposition 56 funds to develop residency programs at hospitals throughout the state. These programs would be administered and operated by the University of California in partnership with Physicians for a Healthy California.(see Prop. 56 section)
Includes $33.3 million ongoing General Fund to the Song-Brown Health Care Workforce program, which provides grants to support primary care residency training programs in California.
Invests $100 million from the Mental Health Services Fund in the new Workforce Education and Training (WET) 5-year plan. The program aims to address the shortage of mental health practitioners in the public mental health system.
The May Revision Scales Back Early Learning Investments
State policymakers have taken steps in recent years to expand access to full-day early learning opportunities for preschool-age children. The Governor’s January budget proposal continued this trend by providing 30,000 full-day California State Preschool Program (CSPP) slots over a three-year period and investing $750 million one-time General Fund in grants for kindergarten facilities. The May Revision scales back on these proposals. Specifically, the Administration:
Provides $600 million one-time General Fund for grants for full-day kindergarten. The May Revision reduces the proposed one-time funding for the grant program by $150 million. The $600 million is to be used over a three-year period, but grants administered during the first two years would be restricted to schools that will be transitioning from part-day to full-day kindergarten programs. The state is also proposing to increase the state share of the grant from 50% to 75% for programs moving to a full day to incentivize participation.
Provides $31.4 million General Fund to increase the number of full-day slots in the CSPP. This is down from the proposed $124.9 million included in the January proposal — a difference of $93.5 million. The January proposal signaled the intent to continue expanding the CSPP over the next two fiscal years, but in the May Revision the Governor notes that additional spaces for children will be subject to available revenues in future years, given lower projected revenues.
The May Revision maintains other CSPP provisions included in the January proposal, such as shifting a share of CSPP funding to the General Fund to free up funding for non-profit providers, and eliminating the parental work or school requirement for the full-day CSPP. The May Revision also maintains $10 million one-time General Fund for a comprehensive plan to increase access to the subsidized child care and development system, including the CSPP.
Increased Revenues Boost the Minimum Funding Level for Schools and Community Colleges, May Revision Includes First-Ever K-14 Education Rainy Day Fund Deposit
Approved by voters in 1988, Proposition 98 constitutionally guarantees a minimum level of funding for K-12 schools, community colleges, and the state preschool program. Changes in state General Fund revenues tend to affect the Proposition 98 guarantee, and the May Revision’s estimates of 2018-19 and 2019-20 revenues are up compared to those made in January’s budget proposal. As a result, the May Revision assumes a 2019-20 Prop. 98 funding level of $81.1 billion, $389.3 million above the level assumed in the Governor’s proposed budget. The May Revision also assumes Prop. 98 funding levels of $78.1 billion in 2018-19 and $75.6 billion in 2017-18, up $278.8 million and $78.4 million, respectively, from the levels assumed in January. The revised spending plan reflects a 2017-18 Prop. 98 funding level that is approximately $117 million above that year’s minimum funding guarantee.
The revised budget projects that a deposit of $389.3 million into the Public School System Stabilization Account (PSSSA) will be required in 2019-20, which would reflect the entire increase in 2019-20 Prop. 98 funding above the level assumed in the January budget proposal. The deposit to the PSSSA would be the first made into this state budget reserve for K-12 schools and community colleges. The PSSSA was established by Proposition 2, a ballot measure voters approved in November 2014 that amended the state constitution. In a fiscal year immediately after the balance of the PSSSA is equal to or greater than 3% of the total share of the Prop. 98 minimum funding guarantee allocated to K-12 school districts, current law limits the amount that local school districts may keep in their budget reserves. However, because the $389.3 million deposit to the PSSSA in 2019-20 would be significantly below the 3% threshold (approximately $2.1 billion), limits on school district reserves would not be required in 2020-21.
The May Revision also maintains a January budget proposal that would change how the final funding level guaranteed under Prop. 98 is certified, a process established by the 2018-19 budget agreement. The overall effect of the Governor’s January proposal would shift the risk associated with the uncertainty in the annual Prop. 98 guarantee from K-12 school and community college districts to the state.
The largest share of Prop. 98 funding goes to California’s school districts, charter schools, and county offices of education (COEs), which provide instruction to approximately 6.2 million students in grades kindergarten through 12. The May Revision proposes to increase support for special education services and to further reduce school districts’ spending obligations for retirement costs. Specifically, the May Revision:
Increases funding by $119.2 million to support special education services, for a total of $696.2 million in ongoing funding. The Governor’s January budget proposed $577 million to provide grants to school districts with large shares of students with disabilities and other disadvantaged students — English learners, students from low-income families, and foster youth — to supplement services for students in special education programs and for preventative services. The May Revision references concerns about coordination between local general education and special education programs, but does not provide information about how the proposed increase in funding would be used.
Provides $44.8 million in one-time funding to support classroom educators. The revised budget proposes to use this funding to provide training and resources to build capacity around a variety of subjects including social emotional learning and computer science.
Increases funding for the Local Control Funding Formula (LCFF) by $70 million in 2018-19 and reduces LCFF funding by $63.9 million in 2019-20. The LCFF provides school districts, charter schools, and COEs a base grant per student, adjusted to reflect the number of students at various grade levels, as well as additional grants for the costs of educating English learners, students from low-income families, and foster youth. The proposal for LCFF funding under the revised spending plan reflects changes in average daily attendance for both 2018-19 and 2019-20 and the cost-of-living adjustment (COLA) for 2019-20.
Slightly increases funding for non-LCFF programs in 2019-20. The revised budget reflects an increase of approximately $200,000 for several categorical programs that remain outside of the LCFF. The proposed increase in funding reflects an additional $7.6 million based on updated average daily attendance estimates and a decrease of $7.4 million that reflects a 3.26% COLA, revised down from the 3.46% COLA included in the January budget.
The May Revision also includes several proposals related to charter schools intended to prevent families from “being wrongfully turned away from the public school of their choice.” These proposals include prohibitions that would prevent charter schools from discouraging enrollment based on student characteristics, such as special education status, and requiring that a student’s academic records be submitted to the charter school before enrollment.
Governor Maintains Increased Funding for Community Colleges
A portion of Proposition 98funding provides support for California’s community colleges (CCCs), which help prepare over 2 million students to transfer to four-year institutions as well as obtain training and employment skills. The May Revision maintains commitments made in the January proposal, with minor adjustments to the proposed expansion of the community college’s Promise Program and funding formula plans. Specifically, the revised budget:
Increases cost estimates for expanding Promise Program. The Governor’s January budget proposal increased funding for the Promise Program by $40 million — the amount needed to extend the California College Promise to a second year of tuition-free college for first-time, full-time students. The May Revision provides an additional $5.2 million, which reflects revised estimates of eligible students for the program.
Maintains commitment to Student Centered Funding Formula, extends hold harmless provision. The 2018-19 budget created a new funding formula for CCC general-purpose apportionments. The May Revision notes that the Governor remains committed to the goals of the new formula and will work with the Chancellor’s Office and stakeholders to continue to explore revisions that further the goals of the formula. The revised spending plan extends the hold harmless provision by an additional year — ensuring that no district will receive less funding than they did in 2017-18 with cost-of-living adjustments every year until 2021-22.
Proposes a $39.6 million increase in one-time Prop 98 General Fund for deferred maintenance, instructional equipment, and water conservation projects.
Does not include funding to support rapid rehousing for homeless and housing insecure students.
Revised Budget Maintains Increases for CSU and UC, Includes Additional Support for Homeless, Incarcerated, and Foster Youth Students
California supports two public four-year higher education institutions: the California State University (CSU) and the University of California (UC). The CSU provides undergraduate and graduate education to roughly 481,000 students on 23 campuses, and the UC provides undergraduate, graduate, and professional education to about 273,000 students on 10 campuses.
In January, the Governor proposed increasing funding for the CSU and UC with the expectation that the institutions would not raise tuition. The revised spending plan maintains these proposed funding increases, as both institutions voted earlier this year to not raise tuition.
Updates for the CSU include the following:
Maintains the Governor’s January proposal to increase CSU funding by $300 million. The CSU is requesting a $554 million increase — $254 million higher than the Governor’s proposal.
Maintains $15 million one-time funding for the Basic Needs initiative and proposes $6.5 million ongoing General Fund to support rapid rehousing for homeless and housing insecure students.
Significantly boosts funding for Project Rebound, which supports formerly incarcerated individuals. The May Revision increases Project Rebound funding from $250,000 per year ongoing General Fund to $1 million per year.
Provides $740,000 one-time General Fund for First Star Foster Youth program at CSU Sacramento. First Star programs support foster youth with academic and life skills needed to successfully transition to higher education.
At the UC, the revised budget:
Maintains the Governor’s January proposal to increase UC funding by $240 million. The UC is requesting a $378 million increase — $138 million higher than the Governor’s proposal.
Maintains $15 million ongoing funding to address food and housing insecurity and provides an additional $3.5 million ongoing General Fund to support rapid rehousing for homeless and housing insecure students.
Allocates $25 million one-time General Fund to support the UC Retirement program.
May Revision Maintains Increases in Cal Grant Program
Cal Grants are the foundation of California’s financial aid program for low- and middle-income students pursuing higher education in the state. Cal Grants provide aid for tuition and living expenses that do not have to be paid back. The revised spending plan maintains increased support for nontraditional students and students with dependent children and updates the cost estimates for these programs. Specifically, the revised budget:
Maintains increased Cal Grant awards for students with dependent children. The Governor’s January proposal allocated $121.6 million to increase Cal Grant Awards for UC, CSU, and CCC students with dependent children. The May Revision maintains the increased award amounts and decreases the total program cost by $24.9 million to reflect revised estimates.
Maintains increased number of Competitive Cal Grant awards. Competitive Cal Grants support students who attend college more than a year after high school graduation and meet certain income and GPA requirements. The number of awards is limited to 25,750 students, though more than 340,000 qualified for them in 2017-18. The revised spending plan maintains the Governor’s January proposal to expand the number of available grants to 30,000 and increases the program funding by $2 million to reflect revised cost estimates.
Provides $89.8 million in one-time funding for teacher loan forgiveness grants. The May Revision allocates these dollars to the California Student Aid Commission to administer a loan forgiveness grant program for teachers that obtain credentials in high-need subjects such as special education and bilingual education. The revised budget indicates the program will prioritize applicants who agree to teach in schools that have a high percentage of teachers with emergency permits.
Revises timeline to meet Associate Degree for Transfers (ADT) goals. In order for students attending private nonprofit institutions to receive the maximum Cal Grant tuition award of $9,084, the institutions must meet certain goals determined by the state. The May Revision provides an additional year for institutions to increase the number of ADTs provided. Under the revised schedule, institutions will need to admit 2,000 ADT students in 2019-20, 3,000 students in 2020-21, and 3,500 students in 2021-22 and subsequent years.
Does not include funding to address students’ total cost of attendance — which includes food and housing.
May Revision Maintains Funding for the Cradle-to-Career Data Insights Act
The May Revision maintains $10 million in one-time General Fund for a statewide longitudinal “cradle-to-career” data system. Of the $10 million, $6.7 million would support the development of the data system with the goal of integrating data from a number of state entities. The remaining funds would support a workgroup with representatives from a variety of stakeholders in the Administration including the State Board of Education, California Department of Education, University of California, California State University, California Community Colleges, California Student Aid Commission, Commission on Teacher Credentialing, Employment Development Department, Labor and Workforce Development Agency, and the California Health and Human Services Agency. The “Cradle-to-Career Data Insights Workgroup” would be tasked with developing two reports. The first would provide recommendations on the structure of the new data system and the second would provide recommendations on expanding the functionality of the data system. These reports would be due to the Department of Finance and the Legislature on March 1, 2020 and September 1, 2020, respectively.
May Revision Calls for Improved Addiction Treatment and Health Care Staffing in State Prisons, Proposes New Reentry Facilities
Currently, more than 126,500 adults who have been convicted of a felony offense are serving their sentences at the state level ─ down from a peak of around 173,600 in 2007. Most of these individuals ─ nearly 114,500 ─ are housed in state prisons designed to hold slightly more than 85,000 people. This level of overcrowding is equal to 134.5% of the prison system’s “design capacity,” which is below the prison population cap ─ 137.5 % of design capacity ─ established by a 2009 federal court order. (In other words, the state is in compliance with the court order.) In addition, California houses nearly 12,100 people in facilities that are not subject to the court-ordered cap, including fire camps, in-state “contract beds,” out-of-state prisons, and community-based facilities that provide rehabilitative services. The sizeable drop in incarceration has resulted largely from a series of policy changes adopted by state policymakers and California voters in the wake of the federal court order.
The May Revision indicates that the Administration “will map out a plan to further transform” California’s correctional system “over the coming year.” In the meantime, the Governor’s revised budget:
Calls for implementing an integrated substance use disorder treatment program throughout the state prison system in order “to combat alcohol and opioid addiction-related issues” among incarcerated adults. This proposal consists of 1) the use of medication-assisted treatment; 2) a redesigned curriculum for cognitive behavioral treatment; and 3) the development of treatment plans and appropriate pre-release transition planning for program participants. This proposal is estimated to cost $71.3 million General Fund in 2019-20, growing to an annual cost of $161.9 million General Fund in 2020-21 and subsequent years.
Includes $27.9 million to increase health care staffing levels in state prisons. The May Revision notes that the prison population “has grown older and sicker and is experiencing an increase in trauma-related incidents,” and also states that “current staffing ratios are insufficient to meet these needs.”
Proposes to establish two 60-bed reentry facilities for women in Los Angeles and Riverside and to expand a male reentry facility in Los Angeles by 10 beds. The revised budget provides annual General Fund support of $8.8 million ongoing for these facilities.
Provides a 5% rate increase for service providers in the Male Community Reentry Program, for an ongoing annual General Fund cost of $1.5 million.
Projects that all Californians who are housed in out-of-state correctional facilities ─ currently numbering over 600 ─ will be returned to California by June 2019. California first began sending incarcerated adults out of state in late 2006 in order to help reduce state prison overcrowding.
May Revision Maintains Proposal to Shift Responsibility for Justice-Involved Youth to Health and Human Services Agency
The May Revision maintains the Governor’s January proposal to shift responsibility for youth correctional facilities from the California Department of Corrections and Rehabilitation to a new department under the state Health and Human Services Agency. The “Department of Youth and Community Restoration” would begin operations on July 1, 2020. The May Revision argues that this new approach would better allow California to provide “trauma-informed and developmentally appropriate services” to justice-involved youth.
May Revision Misses Opportunity to Make the California EITC More Inclusive
The Governor’s May Revision misses an opportunity to make the California Earned Income Tax Credit (EITC) more inclusive by extending it to low-earning immigrants who are currently ineligible for the credit. Hundreds of thousands of additional workers and their children, many of whom are US-born citizens, would become eligible for the California EITC ─ at relatively little additional cost to the state ─ if California permitted tax filers to claim the credit using a federally assigned Individual Taxpayer Identification Number (ITIN) or any federally assigned Social Security Number.
May Revision Assumes Expiration of “MCO Tax,” Foregoing an Annual State General Fund Benefit of More Than $1 Billion
California imposes a tax on health insurance plans ─ known as “managed care organizations” (MCOs) ─ and uses the proceeds to leverage federal funding for Medi-Cal, our state’s Medicaid program. Through a complex financing arrangement, the full MCO tax package ─ which includes offsetting state tax cuts for the health insurance industry ─ provides a net annual General Fund benefit of around $1.5 billion. These freed-up dollars support an array of public services and systems, including health care. However, the MCO tax is temporary and will expire on July 1, 2019, if California does not request an extension from the federal government.
The May Revision continues to reflect the Governor’s view that California should let the MCO tax expire. (Extending the tax would require a two-thirds vote of each house of the Legislature and federal approval.) In his May 9 press conference, the Governor repeated his administration’s concern that pursuing an MCO tax extension with the federal government would be “too risky” given other Medi-Cal-related negotiations that will soon be under way with the Trump Administration. In February, the nonpartisan Legislative Analyst’s Office (LAO) evaluated this concern and concluded that the Governor “has not laid out a convincing rationale” for letting the MCO tax package lapse. Moreover, the LAO noted that “California’s prospects of receiving federal approval of a reauthorized MCO tax are strong.”
If the MCO tax is allowed to expire, state General Fund costs for Medi-Cal would ultimately increase by more than $1 billion per year, but without any additional benefit to Medi-Cal. This is because state policymakers would have to replace the lost MCO tax revenues with General Fund dollars in order to maintain current federal Medicaid matching funds and keep the Medi-Cal program whole. In fact, the May Revision assumes that the General Fund would “backfill” the foregone MCO tax revenues, thus reducing the capacity of the state budget to support public services and systems, including efforts to improve and expand Medi-Cal.
May Revision Lacks a State Increase for SSI/SSP Grants
Supplemental Security Income/State Supplementary Payment (SSI/SSP) grants help well over 1 million low-income seniors and people with disabilities to pay for housing, food, and other basic necessities. Grants are funded with both federal (SSI) and state (SSP) dollars. State policymakers made deep cuts to the SSP portion of these grants in order to help close budget shortfalls that emerged following the onset of the Great Recession in 2007. The SSP portions for couples and for individuals were reduced to federal minimums in 2009 and 2011, respectively. Moreover, the annual statutory state cost-of-living adjustment (COLA) for SSI/SSP grants was eliminated beginning in 2010-11. Since then, state policymakers have provided only one discretionary COLA for the state’s SSP portion of the grant — a 2.76% boost that took effect in January 2017, resulting in monthly state SSP grant levels of $160.72 for individuals and $407.14 for couples, which remain in effect today.
The May Revision does not propose a state increase for the SSP portion of SSI/SSP grants in 2019-20. However, the Administration does project that the federal government will boost the SSI portion of the grant by 2.8% effective January 1, 2020. As a result of this projected federal increase:
The maximum monthly combined SSI/SSP grant for individuals who live independently would increase from the current level of $931.72 to $953.72 on January 1, 2020. This projected 2020 grant level equals about 92% of the current (2019) federal poverty guideline for an individual ($1,041 per month).
The maximum monthly combined SSI/SSP grant for couples who live independently would increase from the current level of $1,564.14 to $1,596.14 on January 1, 2020. This projected 2020 grant level equals about 113% of the current (2019) federal poverty guideline for a couple ($1,409 per month).
Revised Budget Includes Some Additional Investments in Disaster Preparedness, Response, and Recovery
In the January budget proposal, the Administration called for a series of new investments in disaster preparedness, response, and recovery. The May Revision would dedicate additional funding to enhance the state’s ability to prepare for and respond to disasters, such as wildfires. The revised budget includes $39.9 million ($38.6 million General Fund) to support these activities. This includes $20 million one-time General Fund for a “state mission tasking appropriation” in the Office of Emergency Services budget that will fund state entities for costs incurred when they are mission tasked, and $711,000 in ongoing General Fund to develop a statewide “Disaster Reserve Corps.” Most of the remainder of the $39.9 million would be allocated to various departments for planning and preparedness efforts, including the Office of Emergency Services, the Department of Housing and Community Development, the State Water Resources Control Board, the Department of Resources Recycling and Recovery, the Emergency Medical Services Authority, the Department of Public Health, the Department of State Hospitals, and the Department of Social Services. Another $15.7 million investment of one-time General Fund dollars would be added to the Department of Forestry and Fire Protection budget, primarily to “procure innovative solutions to combat the state’s wildfire crisis.”
The May Revision also includes $75 million in one-time General Fund to facilitate state responses to investor-owned utility Public Safety Power Shutdown (PSPS) actions (power shutdowns initiated to prevent wildfires during high wind or other severe weather events), and $41 million for the Public Utilities Commission for inspections and review of utility wildfire mitigation plans and PSPS reports.
Finally, the revised budget includes $10 million in one-time General Fund for local communities recovering from the 2018 Camp Fire in Butte County.
May Revision Includes Additional Support to Improve 2020 Census Outreach Efforts
The upcoming 2020 Census is critical to California. Census data guide the distribution of federal funds to state and local governments. It also determines the number of seats each state has in the US House of Representatives. California faces significant challenges to ensure an accurate count. First of all, many Californians are considered “hard to count,” including foreign-born residents, renters, and young children. Second, the US Census Bureau changed the way in which it plans to administer the 2020 survey, and the agency reduced the number of local census offices and field workers. Third, the Trump Administration plans to add a citizenship question to the Census, which could depress response rates.
In 2017-18, the California Complete Count Committee was launched to oversee Census outreach, awareness, and coordination efforts. The committee was created after the undercount of the state’s population in the 1990 Census, which likely resulted in California losing a seat in the US House of Representatives as well as about $2 billion in federal funding over a 10-year period.
In January, the Governor’s proposed budget included an additional $50 million to support statewide efforts to increase participation in the 2020 Census, bringing total state support for this effort to $140.3 million. The May Revision reflects an additional $2.9 million General Fund and $1 million in reimbursements to support additional outreach efforts for the 2020 Census. These new funds will be used for Native American outreach, translation services, and state agency outreach. The May Revision also includes a proposal to allow the Department of Finance to spend up to an additional $22.5 million to boost participation in the Census.
There was a problem processing your signup. Please try again. Or contact us
Please check your email to confirm your signup.
Today marks World Maternal Mental Health Day and the start of Mental Health Awareness Month. Maternal mental health (MMH) is vital to the health and well-being of children and families. When mothers feel emotionally healthy and well supported, they are better able to develop strong bonds with their children, which promote children’s physical, mental, and emotional development. Conversely, when mothers experience mental health conditions during pregnancy or after giving birth and do not receive treatment, their health and that of their children, families, and communities are negatively impacted. This blog post discusses the impacts of untreated MMH conditions and highlights strategies to improve outcomes in California.
Untreated Anxiety and/or Depression During Pregnancy and After Childbirth Can Negatively Impact Mothers and Their Children
In California, 1 in 5 women experience pregnancy-related depression — the most common MMH disorder — during pregnancy or the first year following childbirth. That’s about 100,000 women every year. MMH disorders encompass a range of mental health conditions, including depression, anxiety, and postpartum psychosis, although many studies related to MMH disorders focus on depression. Substance use is not included in the definition of MMH disorders, but they sometimes occur together. Research suggests that depression during pregnancy is associated with substance use and that new mothers with postpartum depression may be at a higher risk for substance use. Given this overlap and the limited research on MMH disorders more broadly, this blog post focuses on maternal depression and substance use.
Untreated MMH disorders negatively impact the short- and long-term health outcomes of women and their children and often lead to:
adverse birth outcomes;
impaired maternal-infant bonding;
poor infant growth; and
childhood emotional and behavioral problems.
In addition, untreated MMH disorders have significant medical and economic costs. The cost of untreated maternal depression is estimated to be $22,500 per mother in lost income and productivity along with associated health costs. With 100,000 California mothers experiencing a MMH disorder every year, “the annual cost of untreated maternal depression in California is estimated at $2.25 billion,” according to the California Task Force on the Status of Maternal Mental Health Care.
All women are at risk of MMH disorders, but the risk is higher for some women. Socioeconomic status, race and ethnicity, neighborhood, and access to quality health care can impact the likelihood of both experiencing MMH disorders and seeking treatment. One study in California found that women who are black or Latinx and women with low incomes are more likely to have depressive symptoms before and after giving birth. Women who have experienced childhood adversity and stressors during pregnancy are more likely to have depressive symptoms as well. Addressing these factors would help to improve MMH outcomes. Strategies include increasing and improving home visiting services, bolstering income support programs, and improving mental health services and treatment.
Home Visiting Programs Can Help to Improve Maternal Mental Health Outcomes, But There Are Opportunities to Improve the Model
Home visiting programs involve regular visits to expecting parents and parents of young children, typically by a nurse or social worker. These professionals offer training and other assistance aimed at improving maternal and child health and helping parents achieve their education and employment goals. Home visiting programs help to reduce parental stress as well as encourage positive parenting and help to improve child development. Research suggests that home visiting programs have positive effects on MMH and substance use. A study of one home visiting program showed a positive impact on participants’ mental health and coping. An evaluation of a nurse home visitation program showed a decrease in prenatal and postpartum cigarette smoking.
Home visiting programs could do even more to improve MMH. One approach is to integrate mental health supports into home visiting programs. A recent systematic review revealed that 29% to 61% percent of mothers enrolled in home visiting programs across the US experienced depression. Yet, many home visitors do not have adequate training to identify and address the mental health issues experienced by the families they serve. Integrating mental health specialists into the home visiting process would help to address this gap. An evaluation of one home visiting program that incorporated a cognitive-behavioral intervention found that participating mothers showed significantly lower depressive symptoms than those in a control group. Where mental health integration is not possible, community linkages and referral systems could be strengthened to ensure that families receive timely community-based mental health services.
Anti-Poverty Strategies Can Improve Maternal Mental Health Outcomes
Given that poverty is strongly associated with higher levels of depression, one of the most effective anti-depression strategies is an anti-poverty strategy. Poverty is known to heighten exposure to negative life events, job loss, poor housing, dangerous neighborhoods, and conflict with partners, all of which contribute to depressive symptoms. Furthermore, depression is the most common mental health condition among mothers living in poverty, and depression may, in fact, be a result of the hardships mothers experience trying to make ends meet with few resources.
Research on the impact of income support programs on MMH and substance use is limited, but promising. For instance, one study found that working mothers with two or more children whose incomes increased due to the federal Earned Income Tax Credit (EITC) reported better overall physical and mental health compared with similar mothers with only one child, who received lower EITC payments. Another study of the 1990 expansion of the federal EITC suggests increasing the EITC may improve mental health for mothers, particularly for married mothers. Results from a more recent analysis using the Behavioral Risk Factor Surveillance System also suggest that the EITC expansion improved self-reported mental health for mothers. Researchers have also found that mothers who received the largest EITC under the 1993 expansion were less likely to drink and smoke during pregnancy.
Anti-poverty strategies such as bolstering the federal EITC and the Child Tax Credit (CTC) help to lift families out of poverty and thereby address the psychological distress that is associated with poverty. In California, these two credits lifted nearly 1.3 million people — including 643,000 children — out of poverty each year, on average, between 2015 and 2017, according to a Center on Budget and Policy Priorities analysis based on the Supplemental Poverty Measure. Increasing the scope and the size of these income support programs could help to mitigate and prevent MMH disorders. Expanding immigrant mothers’ access to these programs would further improve MMH outcomes, particularly because these mothers may be at an increased risk of experiencing MMH disorders due to fear and stress related to heightened immigration enforcement activities.
Current State Budget and Policy Proposals May Also Improve Maternal Mental Health Outcomes
Last year, Governor Brown signed bills into law that aim to increase MMH screenings, which are not routine across health systems, and clinical training to improve MMH treatment. This year, there are new proposals to further improve detection, assessment, and treatment of MMH disorders as well as to reduce racial and ethnic disparities in MMH outcomes, including:
AB 577 (Eggman) — Medi-Cal: Maternal Mental Health. This bill would extend the duration of Medi-Cal eligibility for postpartum care for an individual who is diagnosed with a MMH condition to one year after giving birth. Currently, Medi-Cal provides coverage for a 60-day period beginning on the last day of pregnancy.
SB 464 (Mitchell) — California Dignity in Pregnancy and Childbirth Act. This bill would require hospitals and birth centers to implement an implicit bias program for all health care providers who care for expectant and new mothers and their children. By addressing implicit bias among providers, this bill aims to prepare providers to better care for mothers and reduce preventable pregnancy-related deaths. It would also require the Department of Public Health to track and publish data on maternal death and diseases or illnesses.
AB 1676 (Maienschein) — Tele-Psychiatry. This bill would require health plans and insurers to establish a telehealth consultation program. Telehealth is the use of electronic information and telecommunication technologies to support the delivery of care at a distance. This program would allow providers who treat expectant and new mothers and their children to consult a psychiatrist in real-time regarding the diagnosis and treatment of mental illnesses.
In addition, Governor Newsom’s proposed budget includes expansive proposals that would benefit the health and well-being of mothers and their families. The Governor’s budget proposes to:
Expand home visiting programs;
Extend the California Earned Income Tax Credit (CalEITC) to an estimated 1 million additional tax filers (bringing the total to an estimated 3 million);
Increase the size of the CalEITC credit for many filers who currently qualify for small credits;
Boost California Work Opportunity and Responsibility to Kids grants (CalWORKs provides modest cash assistance to about 755,000 low-income children while helping parents overcome barriers to employment and find jobs); and
Increase participation in the Black Infant Health Program, which aims to improve African-American infant and maternal health through group support services and case management.
California Thrives When Mothers Thrive
Addressing the upstream factors that prevent the development of maternal mental health disorders, as well as improving early detection and treatment of these disorders, are critical to improving the health and well-being of mothers and children throughout the state. Improving mental health outcomes is the shared responsibility of multiple stakeholders — health insurers, hospitals, home visitors, community health workers, policymakers, and others. The health of California depends on the health of communities, which thrive when mothers thrive.
Support for this resource was provided by First 5 California.
There was a problem processing your signup. Please try again. Or contact us
Please check your email to confirm your signup.
Introduction
Unaffordable housing costs are one of California’s most pressing challenges. The high cost of housing is one of the primary drivers of California’s high poverty rate — ranked first among the 50 states — under the Supplemental Poverty Measure, which accounts for differences in the local cost of living.[1] The lack of affordable housing increases economic insecurity among California families and also creates challenges for California employers striving to retain and recruit workers. Housing affordability is a problem throughout the state when housing costs are compared to incomes, and the Californians who are most affected by the housing affordability crisis are renters and households with the lowest incomes. Policy solutions that particularly target these households represent a promising approach to tackling the state’s housing crisis strategically, with a focus on those most deeply affected.
Renters Are Especially Likely to Have Unaffordable Housing Costs, While Homeowners Without Mortgages Are Least Affected
Determining whether housing is affordable requires considering both housing costs and household incomes. For renters, housing costs include monthly rent payments, plus the cost of utilities if not included in the rent. Housing costs for homeowners include monthly mortgage principal and interest payments, plus property tax, property insurance, utilities, and condo or mobile home fees (if applicable). To understand California’s housing affordability challenges, it is important to consider these housing costs relative to incomes. If high housing costs are matched by high incomes, then expensive housing may be affordable to many households. At the same time, even relatively low housing costs may be unaffordable if local incomes are also low.
For housing costs to be considered affordable, a household’s total housing costs should not exceed 30 percent of household income, according to the US Department of Housing and Urban Development. Households paying more than 30% of income toward housing are considered housing “cost-burdened,” and those with housing costs that exceed half of their income are considered “severely cost-burdened.” By these standards, more than 4 in 10 households statewide had unaffordable housing costs in 2017. Furthermore, 1 in 5 households across California faced severe housing cost burdens, spending more than half of their income toward housing expenses.
California’s renters are substantially more likely to struggle with housing affordability than homeowners in California. More than half of renter households paid over 30% of income toward housing in 2017, and more than a quarter were severely cost-burdened, paying more than half of household income toward housing costs. California homeowners generally struggle less to afford their housing, though more than a third of homeowners with mortgages were housing cost-burdened in 2017. Owners without mortgages are least likely to face high housing burdens in California. Besides not having the monthly expense of a mortgage, many of these homeowners have been in their homes for decades and therefore benefit from relatively low property taxes due to Proposition 13’s limitation on property tax increases.
Low-Income Households Are Particularly Affected by Unaffordable Housing
Households with the lowest incomes are by far the most likely to have housing costs that are unaffordable. Eight in 10 households with low incomes (those with incomes of less than 200% of the federal poverty line) were housing cost-burdened in 2017, and more than half of these households spent more than half their income on housing. At the same time, only about 16% of high-income households (with incomes of 400% or more of the federal poverty line) were housing cost-burdened in 2017, and less than 3% were severely cost-burdened.
Housing Affordability Is a Problem in All Regions of California, and Many of Those Affected Are People of Color
Housing costs vary substantially throughout California, with the highest costs in coastal urban areas and the lowest costs in inland rural areas. But incomes also vary regionally, and areas with relatively lower housing costs also tend to have lower typical incomes. The result is that housing affordability is clearly a problem throughout the state when housing costs are compared to incomes. Across every region of California, from the high-cost San Francisco Bay Area and Los Angeles and South Coast to the lower-cost Central Valley and Far North, at least a third of households spent more than 30% of their incomes toward housing in 2017, and more than 1 in 6 spent more than half of their incomes on housing costs.
Throughout the state, many of the individuals affected by unaffordable housing costs are people of color. Among all Californians living in households paying more than 30% of income toward housing costs in 2017, more than two-thirds were people of color, and about 45% were Latinx.
High Housing Cost Burdens Call for Policies Designed to Help Those Who Are Most Affected
What problems arise when households struggle to afford housing? Unaffordable housing costs can force families to spend less on other basic necessities like health care or food, to cut costs by seeking lower-quality child care, and to under-invest in important long-term assets like education or retirement savings. Unaffordable housing costs can also force families and individuals to accept substandard housing or live in neighborhoods that lack basic safety and offer limited opportunities. In the most serious cases, unaffordable housing can push households into homelessness. All of these consequences can have cascading effects on health and can shape both short-term well-being and long-term outcomes for affected individuals.
Given the challenges of housing affordability across all regions of California — especially for renters, households with the lowest incomes, and people of color — strategies to increase affordability are urgently needed, particularly for the most-affected Californians. Housing affordability policy solutions can focus on protection of affordability for current residents, preservation of existing affordable housing, and production of more housing, particularly homes targeted to the households that struggle most to find and retain affordable housing, including renters and those with the lowest incomes. Specific policy solutions that can make a difference include tenant protections against excessive rent increases, funding to support affordable housing construction and preservation, and policies that increase local incentives and local accountability for accommodating more housing development, particularly for housing affordable to low-income households. Moreover, policies outside of the housing arena that help families make ends meet — by reducing costs for child care, food, health care, or other necessities, or by supplementing incomes — represent another important approach to helping Californians who are struggling to afford the cost of housing.
As state leaders craft budget and policy proposals, it is important to acknowledge that a mix of policies is needed to address California’s housing affordability challenges and that doing so is particularly important for California’s renters, low-income households, and people of color.
There was a problem processing your signup. Please try again. Or contact us
Please check your email to confirm your signup.
Introduction
The 2017 federal Tax Cuts and Jobs Act (TCJA) included a provision creating a new program designed to encourage private investments in economically distressed communities. The Opportunity Zones program provides federal tax incentives for investments in areas that meet certain criteria and have been designated as Opportunity Zones (OZs). Additionally, Governor Gavin Newsom’s 2019-20 budget proposal would provide state-level tax incentives for investments in OZs. There are 879 designated OZs in California, located in nearly all of the state’s counties. More than 4 million Californians live in these areas and will be potentially impacted by new investments eligible for Opportunity Zones tax incentives. The Opportunity Zones program has the potential to encourage new investments in eligible communities that improve the lives of residents with low incomes. However, the vast majority of the tax benefits will be realized by wealthy investors, and the program may accelerate gentrification in some areas or subsidize investments that offer little or no benefit to community residents.
This Issue Brief, the first in a series of Budget Center publications exploring the Opportunity Zones program, explains the structure of the program, its tax incentives, and how California’s communities may be affected.
The Basics: Opportunity Zones, Qualified Opportunity Funds, and Qualified Opportunity Zone Businesses
The TCJA allowed governors to nominate census tracts for OZ designation following certain federal criteria.[1] To qualify, census tracts must generally be low-income communities, defined as having a poverty rate of at least 20% or a median family income of 80% or less of the metropolitan area or state median family income.[2] States were also permitted to select a limited number of “contiguous tracts” that are not low-income communities but border a qualified low-income community and have a median family income that does not exceed 125% of that of the adjacent qualified low-income tract. Contiguous tracts may not comprise more than 5% of a state’s total selected OZs. Each state was permitted to nominate a total number of OZs not exceeding one-quarter of all eligible low-income tracts. In California, Governor Jerry Brown’s administration nominated 879 census tracts to become OZs, and the US Treasury Department certified all of them. One-tenth of California’s population (10.7%), nearly 4.2 million residents, live in OZ census tracts.[3] These designations will remain in effect for 10 years.
Individuals and corporations that invest in a Qualified Opportunity Fund (QOF) — an entity that in turn makes investments in OZs — are eligible for several tax benefits, discussed below. To be a QOF, at least 90% of the fund’s assets must be invested in “Qualified Opportunity Zone Property,” which may include either a stock or partnership interest in a “Qualified Opportunity Zone Business” that holds tangible property — such as buildings and equipment — in an OZ (known as “Qualified Opportunity Zone Business Property”) or direct holdings of such business property (Figure 1). A QOF, which may be a corporation or partnership, does not need to apply for QOF designation and may self-certify with the Internal Revenue Service (IRS).
Figure 1
The TCJA statute is vague about how much of a QOF’s or Qualified Opportunity Zone Business’ property must be located in an OZ, but the IRS has issued proposed regulations that seek to clarify this issue. If these proposed regulations go into effect, a QOF could have less than half of its assets in use within an OZ and its investors would still be eligible for the full tax benefit.[4]
The law also specifies that, if the original use of the Qualified Opportunity Zone Business Property does not start with the QOF investment, the property must be “substantially improved” — requiring the QOF to spend at least as much to improve the property as it spent to acquire it. Ostensibly, this requirement aims to prevent investors from getting tax benefits by simply buying property in an OZ without adding any value for the community. The IRS’ proposed regulations would make this requirement more flexible, which could increase the likelihood that tax subsidies will go to investments that provide few community benefits.[5]
The broad definitions in the law and the flexibility offered in the proposed regulations mean there will likely be few limitations on the types of investments that will qualify for preferred tax treatment. For example, investments in startup businesses, expansions of existing businesses, construction or substantial rehabilitation of residential or commercial properties, and infrastructure improvements are all likely to qualify. The only businesses explicitly prohibited from receiving Opportunity Zone tax benefits are so-called “sin businesses” including liquor stores, gambling facilities, golf courses, country clubs, tanning facilities, and massage parlors.
The regulations for the Opportunity Zones program have not been finalized at the time of this publication, and the IRS will issue further proposed regulations to clarify other aspects of the law in the coming months. The final regulations will impact the degree to which tax-privileged investments substantively benefit OZ residents and the generosity of the tax benefits for investors.
Tax Incentives for Investors Can Be Lucrative
The Opportunity Zones program attempts to promote investments in OZ census tracts by providing several tax breaks on capital gains that are reinvested into a QOF. A capital gain results when a taxpayer sells or exchanges an asset — such as corporate stock shares or real estate — at a price higher than its purchase price.[6] For federal tax purposes, the short-term capital gains tax rate, which applies to gains on assets held for one year or less, is equal to the taxpayer’s ordinary income tax rate, with a maximum rate of 37%. Lower federal rates apply to long-term capital gains on assets held for more than one year. The maximum rate for long-term capital gains is 20% plus a 3.8% surtax related to the Affordable Care Act.[7] Under the Opportunity Zones program, taxpayers reinvesting capital gains into a QOF within 180 days of the sale or exchange of the original investment are eligible for three federal tax benefits:
Deferral of tax on the capital gain on the original investment until 2026 (or the time the QOF investment is disposed of, if earlier) — allowing the reinvestment of the entire capital gain into a QOF with the potential benefit of a higher return.
Reduction of tax on the capital gain on the original investment if the QOF investment is held long enough (the taxable value of the capital gain — and thus the tax liability — is reduced by 10% if the QOF investment is held for five years and by 15% if the QOF investment is held for seven years).
Elimination of tax on the capital gain on the QOF investment if it is held for 10 years.
There is no upper limit on the tax benefits any QOF investor can receive, nor on the overall cost to the federal government in foregone tax revenues. (See text box for an example of the potential tax benefits from investing in a QOF.)
Wealthiest Investors Will Reap Greatest Share of Tax Savings While Community Benefits Are Uncertain
Taxpayers with holdings of appreciated assets will be the direct beneficiaries of Opportunity Zones tax incentives. Most of these benefits will accrue to very well-off investors, who hold a disproportionate share of such assets. Only 9.2% of all taxpayers report realizing any long-term capital gains, according to estimates from the Urban-Brookings Tax Policy Center.[8] In addition, capital gains are highly concentrated at the top of the income distribution. The top 20% receive 90.2% of all reported long-term capital gains, with the top 1% collecting 68.7% of these gains (Figure 2). Thus, very few low- or middle-income families will receive any tax benefits from the Opportunity Zones incentives.
Figure 2
While the benefits to wealthy investors are clear, there is no guarantee that the subsidized investments will positively impact current residents of designated OZs. The Opportunity Zones program is not the first attempt to bring investment and employment into areas that lack financial resources and jobs. A variety of federal and state programs have provided tax incentives and other benefits to attract business and capital investment and to increase employment in such areas, including Empowerment Zones, Enterprise Communities, Renewal Communities, New Market Tax Credits, and state-level enterprise zones. Research on the community impacts of these programs has reached mixed conclusions. Some studies have found increases in employment and wages and reductions in poverty in designated zones relative to similar communities where these incentives were unavailable, while others have found little evidence that the incentives led to statistically significant community improvements.[9] The inconclusiveness of the research exploring the connection between economic development tax incentives and community outcomes suggests that the costs of such incentives may outweigh the benefits.
A primary concern is investors may be drawn to projects or businesses in areas already in the process of gentrification, as these investments will likely yield the highest returns.[10] If investors do prioritize projects in gentrifying areas, a large portion of the tax-preferred investments could flow into communities that have fewer challenges attracting capital, meaning US taxpayers would be unnecessarily subsidizing investments that likely would have occurred without the incentives. The extent to which this occurs will partially depend on which census tracts states designated as OZs. (The next publication in this series will examine California’s selection of OZs, including the share of selected areas showing signs of gentrification.)
Since the professed goal of the Opportunity Zones program is to improve economically distressed communities, and not to give tax breaks to wealthy investors, the primary question should be whether the inflow of funds meaningfully improves the circumstances of residents in those communities. For instance, if the incentive results in more affordable housing or local businesses that create job opportunities for low-income residents, this would be considered a successful outcome — even if wealthy investors become wealthier in the process. However, given the few restrictions placed on the investments that can be made, and the laxness of some of the regulations proposed by the IRS, there is a real possibility that some of these new investments will contribute to the gentrification of communities. For example, QOFs may invest in luxury condominiums or companies that mostly employ high-skilled workers from outside the community. In fact, these types of investments may be more attractive than “social impact” investments due to potentially higher returns. This could put low-income residents at risk of facing increased costs of living or being displaced, harming the very people the incentive is intended to help. And since OZ census tracts have higher concentrations of black and Latinx residents than other communities, this could exacerbate existing racial and ethnic inequities.[11]
Some of the most disadvantaged communities may not see any new investment at all. These communities have a scarcity of assets to attract investors, present higher risks, and offer potentially lower returns. Therefore, investors are more likely to choose projects in areas that are already more advantaged or showing signs of revitalization over neighborhoods that have the greatest need for new resources.
Another consideration is the overall cost of the Opportunity Zones incentives in the form of foregone federal revenues from capital gains taxes. These lost revenues — mostly benefiting high-income investors — could instead help pay for other services that may have a greater impact on vulnerable communities in California and across the nation. The official cost estimate for the tax incentives is small relative to total cost of the TCJA — $1.6 billion over 10 years in a package of nearly $2 trillion in tax cuts.[12] However, the long-run costs could be much greater given that this estimate does not include revenue losses from the complete exclusion of gains on QOF investments held for 10 years, which fall outside the 10-year period for which budget estimates were made.
The high levels of flexibility for investors and uncertainty regarding the potential benefits and harms to OZ residents elevate the need for strong reporting and data collection requirements. The law does not include such requirements, but the US Treasury Department has the discretion to issue them in forthcoming regulations. Thus, until the final regulations are released, it is unknown whether there will be sufficient and transparent information available to determine how the tax incentives are being used and how subsidized investments are affecting the communities in which they are made.
What’s Next for California’s Opportunity Zones?
Now that the selection of OZ census tracts in California has been finalized, state and local leaders are contemplating how to encourage meaningful investments that will improve the lives of people in struggling communities. Policymakers are considering whether to provide state-level tax incentives to make QOF investments even more attractive, how to align existing state and local resources with those investments, and how to ensure transparency and accountability. Given that the federal tax benefits are heavily skewed toward wealthy investors (as would be state-level capital gains tax breaks) and that residents of affected communities may face affordability pressures and displacement risks, any state-level Opportunity Zones incentives should be structured to 1) provide greater opportunities for lower-income community members, 2) safeguard residents against displacement, and 3) avoid providing a windfall for the wealthy at the expense of the state’s finances. Finally, if state and local governments provide additional incentives to encourage investments in OZs, such incentives should be more narrowly targeted to investments likely to benefit current residents, and data collection and evaluation requirements should be established to enable an assessment of whether the incentives are achieving their intended purpose.
[1] The statute governing Opportunity Zones is found in the new Section 1400Z of the US Internal Revenue Code (26 US Code Section 1400Z).
[2] The definition of “low-income community” for the Opportunity Zones program comes from the statute governing the New Markets Tax Credit (26 US Code Section 45D(e)). For a census tract located in a metropolitan area to qualify, it must have a poverty rate of at least 20% or a median family income not exceeding 80% of the greater of the statewide median family income or the metropolitan area median family income. For a census tract not located in a metropolitan area to qualify, it must have a poverty rate of at least 20% or a median family income not exceeding 80% of the statewide median family income.
[4] The TCJA requires that “substantially all” of a business’ tangible property be Qualified Opportunity Zone Business Property, “substantially all” of which is in use in an OZ. The law does not define “substantially all,” but the IRS’ proposed regulations would define it as 70% in both cases. This means a business would only need to have 49% of its tangible property in an OZ (70% times 70%). Since the law requires only 90% of a QOF’s assets to be Qualified Opportunity Zone Property, a QOF holding property through an operating business could have as little as 44.1% of its assets being used in an OZ. US Department of the Treasury, Internal Revenue Service, REG-120186-18: Investing in Qualified Opportunity Funds (April 17, 2019), pp. 77-78.
[5] The proposed regulations released in October 2018 specify that only the value of buildings, excluding the value of the underlying land, would be considered in the calculation to determine whether a property has been substantially improved, which would allow more real estate investments to meet this test. Brett Theodos, Steven M. Rosenthal, and Brady Meixell, The IRS Proposes Generous Rules for Opportunity Zone Investors but What Will They Mean for Communities? (Urban-Brookings Tax Policy Center: October 23, 2018). Additionally, proposed regulations released in April 2019 clarify that unimproved land does not need to be substantially improved, but that such land must be used in a trade or business and would not be considered Qualified Opportunity Zone Business Property if it were being held for investment. The IRS is seeking comments on whether additional rules are needed to prevent QOFs from acquiring land in an OZ without adding any value or economic activity. US Department of the Treasury, Internal Revenue Service, REG-120186-18: Investing in Qualified Opportunity Funds (April 17, 2019), pp. 12-14.
[6] Technically, a capital gain is the difference between an asset’s sale price and its “basis,” which equals the asset’s purchase price with some adjustments, such as the cost of commissions for stocks or the cost of improvements minus depreciation for real property.
[7] Thus, the maximum federal tax rate on long-term capital gains is 23.8%. This includes the top long-term capital gains rate of 20%, which for the 2019 tax year applies to taxpayers with incomes above $434,550 ($488,850 for married taxpayers filing jointly). An additional 3.8% surtax on net investment income, including capital gains, helps fund Affordable Care Act benefits. This surtax applies to single taxpayers with incomes over $200,000 ($250,000 for married taxpayers filing jointly). In contrast to federal law, California taxes all capital gains as ordinary income, at a maximum rate of 13.3%.
[10] As described by the Urban Displacement Project, gentrification is “a process of neighborhood change that includes economic change in a historically disinvested neighborhood — by means of real estate investment and new higher-income residents moving in — as well as demographic change — not only in terms of income level, but also in terms of changes in the education level or racial make-up of residents.” Gentrification can lead to displacement, meaning long-term community residents are no longer able to live in gentrified communities. See Miriam Zuk and Karen Chapple, “Gentrification Explained” (Urban Displacement Project: 2015).
There was a problem processing your signup. Please try again. Or contact us
Please check your email to confirm your signup.
Introduction
The California Work Opportunity and Responsibility to Kids (CalWORKs) program provides modest cash assistance to about 755,000 low-income children and their parents. It also helps parents overcome barriers to work and find jobs through key support services such as subsidized child care and transportation reimbursement.[1] As this Brief outlines, although Governor Newsom proposed new funding for CalWORKs grants in his 2019-20 budget proposal, the declining value of the earned-income disregard (EID) would reduce the economic impact of these investments, especially in the face of a rising state minimum wage.
A Fixed Earned-Income Disregard Does Not Serve CalWORKs Families
As parents who are participating in CalWORKs enter the workforce, the earned-income disregard allows families to continue to receive benefits while earning a paycheck — up to a certain limit. Specifically, the EID is the amount of a recipient’s gross monthly earnings that is overlooked when their grant levels are calculated. Since CalWORKs’ implementation in 1997-98, state law has exempted the first $225 of monthly earnings, then 50% of the remainder.[2] As a family’s earnings increase, their grant amount decreases until they reach the CalWORKs income limit. The income limit, which is partly based on the maximum monthly grant and the earned-income disregard, determines when a family is no longer eligible for CalWORKs cash assistance. The greater the value of the disregard, the smaller the reduction in the monthly grant and the more parents can earn before losing eligibility. This allows for a smoother transition out of the CalWORKs program.
Unfortunately, the value of the EID has not changed in more than 20 years, leaving families with fewer resources (Figure 1). With the current $225 disregard, the annualized income limit in 2019-20 will be $23,772 (or $1,981 a month) for a family of three in a high-cost county. If policymakers had increased the disregard each year to account for inflation, the EID would have been $399 in 2019-20. Families would have had up to $25,858 in annual income (or $2,155 a month) before reaching the income limit. For working families who face rising rents and find it harder each year to keep a roof over their heads, that extra $174 a month is substantial.[3] In other words, policymakers’ failure to increase the disregard to keep up with the rising cost of goods and services has left already struggling families with even fewer resources to make ends meet in our state.
Figure 1
The Earned-Income Disregard Has Fallen Behind the State Minimum Wage
However, with a rising state minimum wage, policymakers would need to do more than adjust the EID for inflation if CalWORKs is to better support families pursuing employment (Figure 2). When CalWORKs was first implemented in 1997-98, a parent working a minimum wage job full-time and year-round earned $11,960 a year (or $5.75 an hour), well-below the annualized income limit of $16,020 (or $7.70 an hour). In 2019-20, that same parent would be ineligible for assistance because the annualized income limit of $23,772 (or $11.43 an hour) would be below minimum wage earnings of $27,040 (or $13.00 an hour). Even if the disregard had been adjusted for inflation, the annualized income limit would still fall short.[4] The gap between minimum wage earnings and the CalWORKs income limit is only projected to grow in the coming years. By 2021-22, when the minimum wage hits $15.00 an hour, working more than the required 30 hours a week at minimum wage could mean a single-parent family automatically loses support.[5]
Figure 2
State Policymakers Should Raise the CalWORKs Income Limit by Increasing the Earned-Income Disregard and Tying the Disregard to Inflation
During and after the Great Recession, state leaders made cuts to the CalWORKs program that undermined economic security for families with very low incomes. In recent years, policymakers have begun to reinvest in the program by boosting the value of CalWORKs grants. California’s leaders should continue to invest in CalWORKs by also increasing the earned-income disregard to better reflect changes made to the state minimum wage. An increase to the disregard would raise the income limit without penalizing parents for working more hours, especially for minimum-wage earners. Furthermore, to keep the disregard from losing value in the future, policymakers should ensure that the EID is increased annually to keep pace with inflation.
Esi Hutchful prepared this Issue Brief. The Budget Center was established in 1995 to provide Californians with a source of timely, objective, and accessible expertise on state fiscal and economic policy issues. The Budget Center engages in independent fiscal and policy analysis and public education with the goal of improving public policies affecting the economic and social well-being of low- and middle-income Californians. General operating support for the Budget Center is provided by foundation grants, subscriptions, and individual contributions. Support for this Issue Brief was provided by First 5 California.
[2] For example, if a single mother with two children earns $500 a month, the first $225 she earned that month would not count towards the calculation of her grant, leaving $275. Then, half of that ($137.5) would be subtracted from the grant. The $225 disregard was reduced to $112 in 2011-12 but restored the year after. See Legislative Analyst’s Office, Review of CalWORKs Changes in the 2012-13 Budget (March 13, 2013), p. 7.
[4] If the earned-income disregard had been adjusted for inflation each year since 1997-98, the annualized CalWORKs income limit would be $25,858 in 2019-20. The hourly wage equivalent would be $12.43 an hour.
[5] Unless otherwise exempt, single parents must spend on average 30 hours a week each month engaged in welfare-to-work activities if they have a child over age 6 or 20 hours per week each month if the child is under age 6. Welfare-to-work activities include unsubsidized and subsidized employment, job training, and other activities to help participants with employment. See California Department of Social Services, CalWORKs Annual Summary: February 2018 (February 2018), p. xv.
There was a problem processing your signup. Please try again. Or contact us
Please check your email to confirm your signup.
This website uses cookies to analyze site traffic and to allow users to complete forms on the site. The California Budget & Policy Center does not share, trade, sell, or otherwise disclose personal information. By using our website you agree to our Privacy Policy.