The Department of Community Services and Development (CSD) joined the State Franchise Tax Board, CalEITC4Me, and United Ways of California in hosting a stakeholder event to promote awareness of the California Earned Income Tax Credit (CalEITC). As part of this event, California Budget & Policy Center Senior Policy Analyst Alissa Anderson presented on the importance of the CalEITC and the federal EITC.
You may also be interested in the following resources:
-
Fact Sheet
Young Californians Face Alarmingly High Rates of Poverty and Deep Poverty
key takeaway Young adults across California face higher-than-average poverty and deep poverty rates as they transition into adulthood, underscoring the need to strengthen core basic needs programs and investments that help young Californians achieve economic stability and meet their basic needs. Young adulthood is a crucial time to establish independence and start to build financial … ContinuedCalFreshMedi-CalPoverty & Inequality -
Report
Federal and State Budget Decisions Threaten AANHPI Women in California
key takeaway AANHPI women’s experiences vary widely across ethnicities, making disaggregated data essential to understanding the impacts of recent federal and state decisions. By examining the Women’s Well-Being Index indicators across multiple AANHPI ethnicities, this report highlights distinct challenges facing AANHPI women in California and identifies key steps state and local leaders can take to … ContinuedPoverty & Inequality
Stay in the know.
Join our email list!

Endnotes are available in the PDF version of this Fact Sheet.
As the 115th Congress convenes this month, the US economy is in its seventh year of recovery from the Great Recession. Yet many communities in California have not shared in the nation’s recent economic gains. Statewide, nearly 6 million people, including almost 2 million children, are living in families with incomes below the US Census Bureau’s official poverty line, which is about $19,000 in annual income for a family of three.
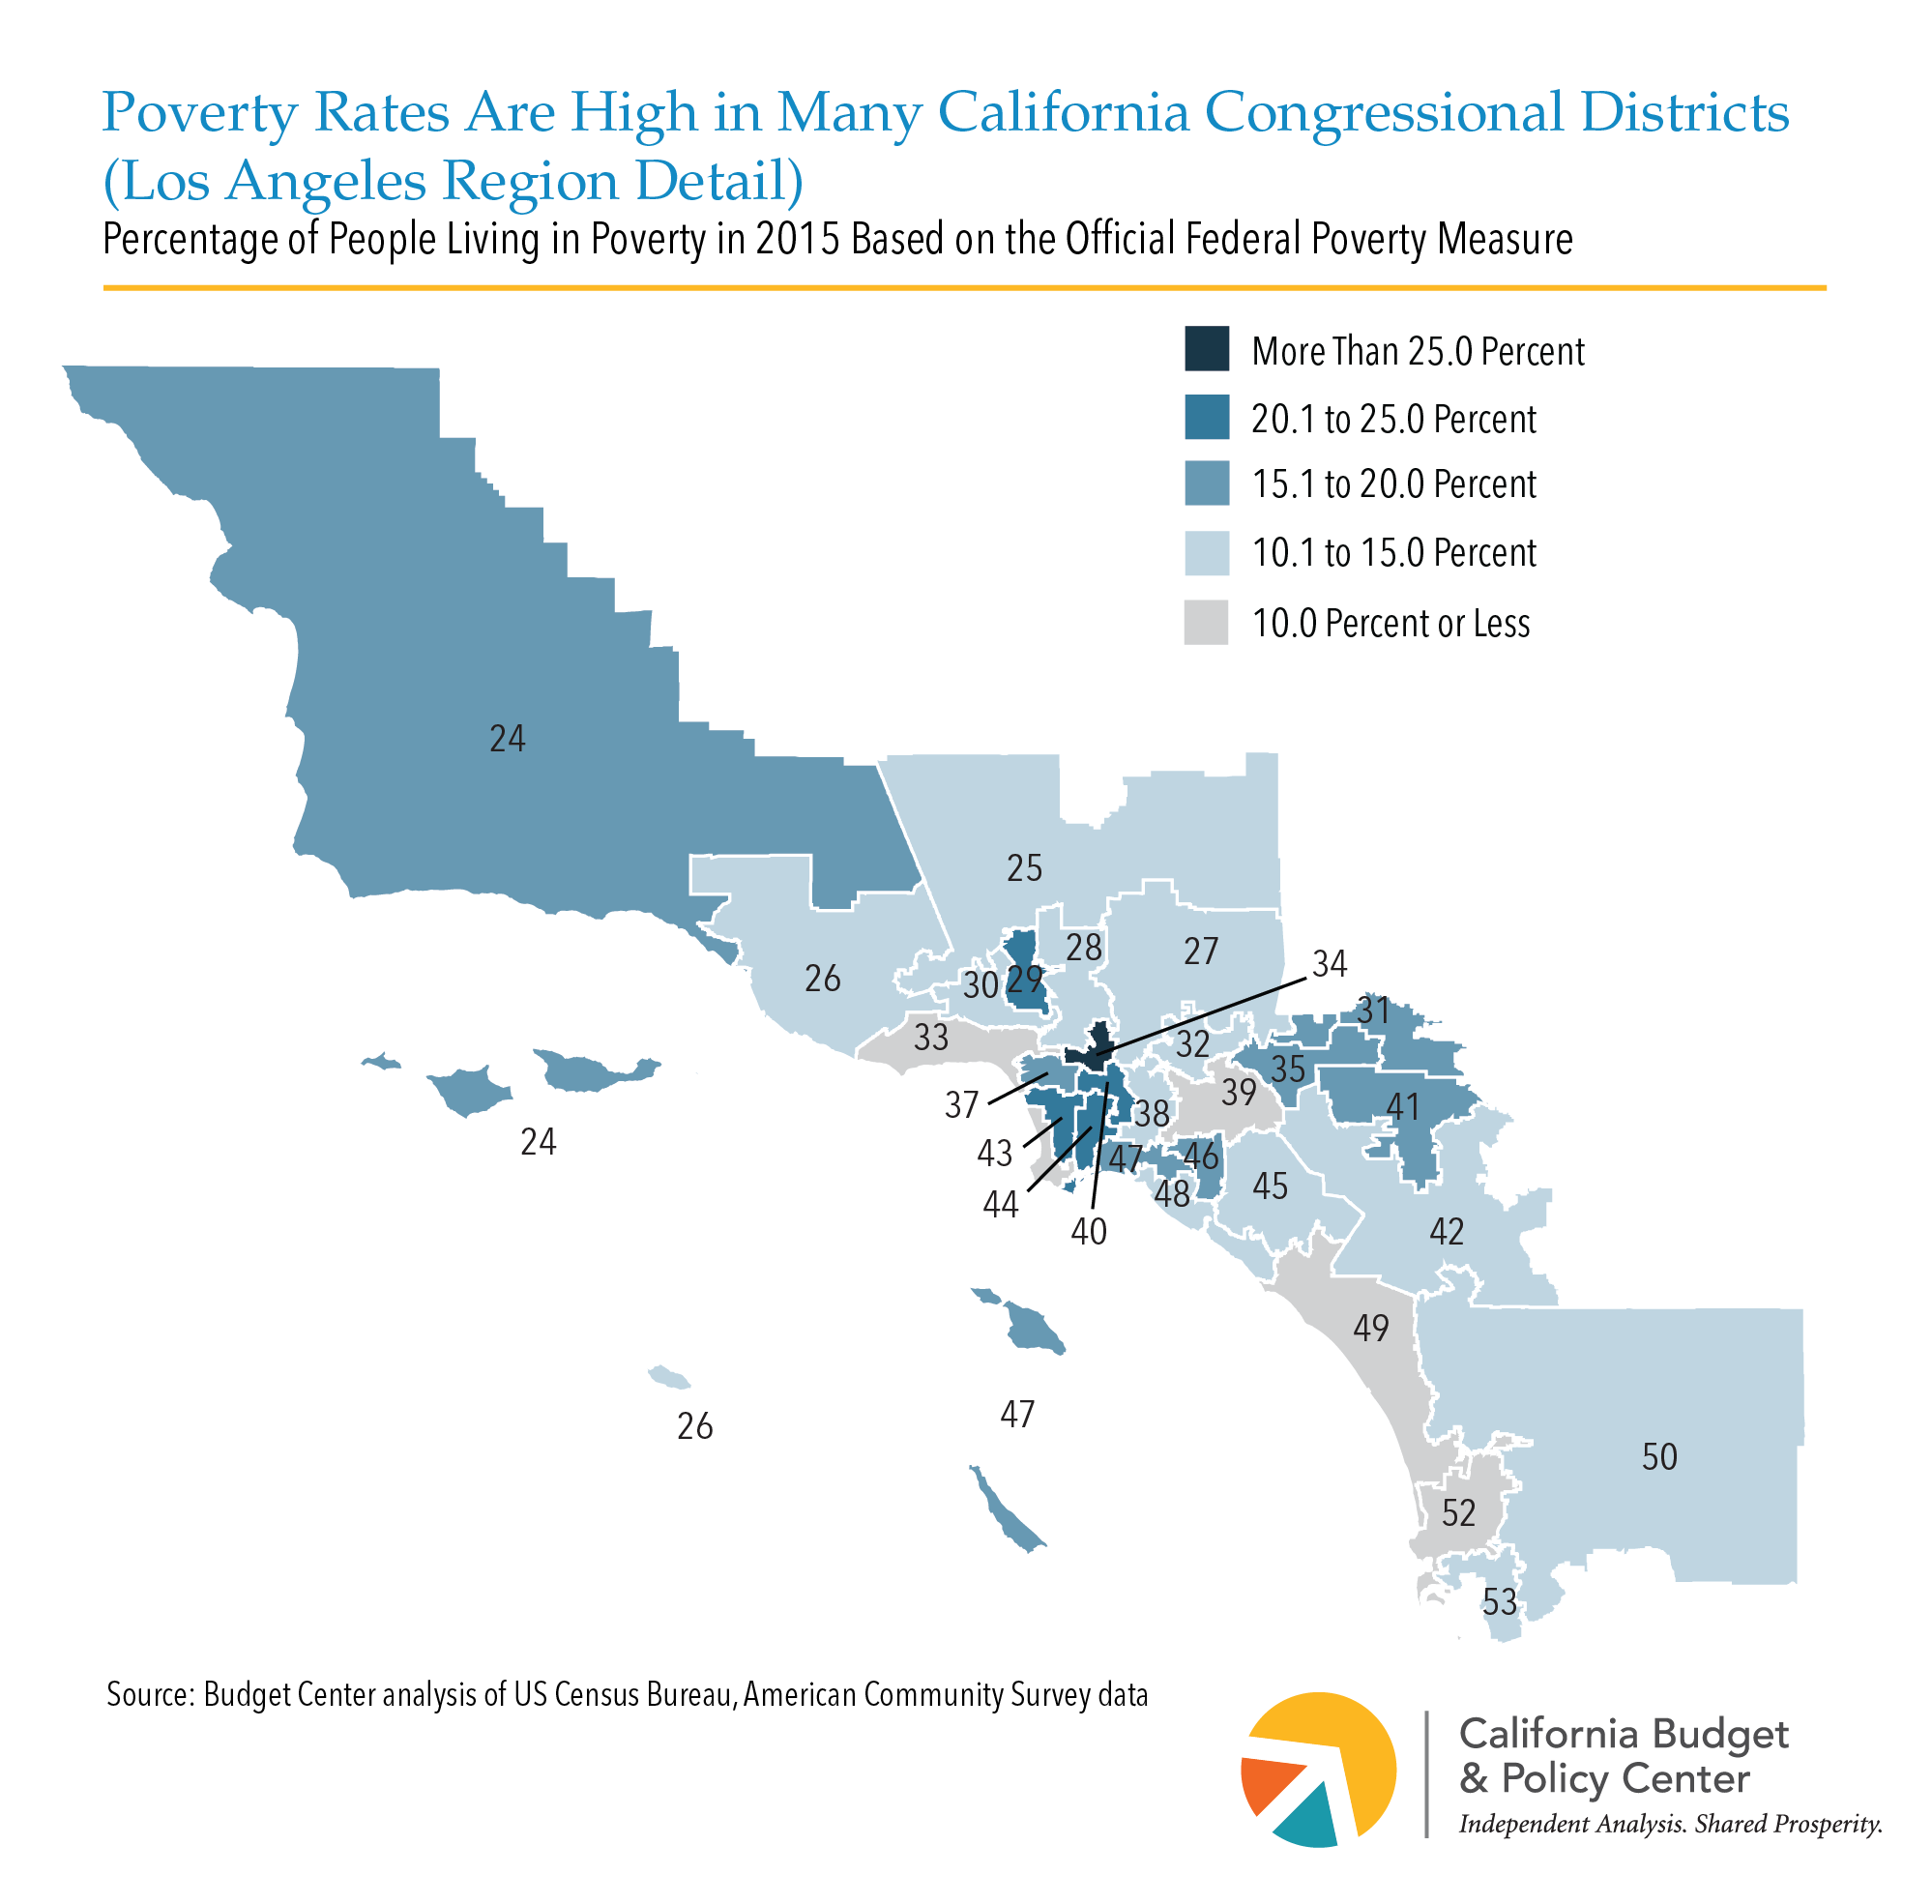
Poverty affects communities in every one of California’s 53 congressional districts, but there are stark differences in the level of economic hardship across districts. The latest Census figures show that the official 2015 poverty rate ranged from a low of 6.8% in District 17 (D-Khanna) in the San Jose area to a high of 30.8% in District 16 (D-Costa) in the San Joaquin Valley. Also, poverty has increased in nearly every district since 2000, and the largest increases are concentrated in inland, suburban communities, reflecting a broader national trend. These findings highlight the urgent need for the new Congress to prioritize policies that give all people the opportunity to thrive and move up the economic ladder.
The latest Census data (see Maps below) show that:
- Three congressional districts are extremely distressed, with more than one-quarter of all residents living in poverty. These districts — 16 (D-Costa), 21 (R-Valadao), and 34 (D-Becerra) — include communities in the San Joaquin Valley and in Los Angeles.
- In eight districts, between one-fifth and one-quarter of all residents live in poverty. These districts — 6 (D-Matsui), 8 (R-Cook), 29 (D-Cárdenas), 36 (D-Ruiz), 40 (D-Roybal-Allard), 43 (D-Waters), 44 (D-Barragán), and 51 (D-Vargas) — include communities along the US-Mexico border as well as in Los Angeles, the Inland Empire, the San Fernando Valley, and the Sacramento region.
- Only 10 districts have fewer than 1 in 10 residents living in poverty. These districts — 4 (R-McClintock), 14 (D-Speier), 15 (D-Swalwell), 17 (D-Khanna), 18 (D-Eshoo), 19 (D-Lofgren), 33 (D-Lieu), 39 (R-Royce), 49 (R-Issa), 52 (D-Peters) — largely include communities in the Bay Area and along the southern California coast.
In addition, a recent Brookings Institution analysis shows that nearly every California congressional district was more economically distressed in recent years than in 2000, due largely to the impact of the Great Recession. The communities that have been hit the hardest tend to be those in inland, suburban areas (see Table below). Specifically:
- Poverty rates rose in 45 of California’s 53 congressional districts between 2000 and 2010-14. For example, the poverty rate increased by more than 4.0 percentage points between 2000 and 2010-14 in four districts: 5 (D-Thompson), 7 (D-Bera), 8 (R-Cook), and 41 (D-Takano), which include communities in the Inland Empire, the eastern Sierra, the Bay Area, and the Sacramento vicinity. In contrast, poverty rates declined in just two districts, while there was no statistically significant change in the remaining six districts.
- Growth in the number of people living in poverty far outpaced overall population gains in most districts. For example:
- Between 2000 and 2010-14, the number of people facing severe economic hardship more than doubled, rising by 112%, in District 42 (R-Calvert), which includes suburban communities in Riverside County. Although District 42 experienced the greatest population gains in California during this period (the number of district residents rose by about three-quarters), the increase in the number of residents living in poverty still far exceeded the growth in the overall population.
- In District 7 (D-Bera), which includes suburban communities east and south of Sacramento, the number of residents facing severe economic hardship increased by about 84% between 2000 and 2010-14, far outpacing the 25% increase in the district’s total population.
- Three other districts saw the number of economically distressed residents rise by more than 70% between 2000 and 2010-14, far exceeding overall population growth. These districts — 8 (R-Cook), 25 (R-Knight), and 45 (R-Walters) — include communities in the Inland Empire and Death Valley region, northern Los Angeles County, and Orange County. The vast majority of people living in poverty in these districts reside in suburban areas.


You may also be interested in the following resources:
-
Fact Sheet
Young Californians Face Alarmingly High Rates of Poverty and Deep Poverty
key takeaway Young adults across California face higher-than-average poverty and deep poverty rates as they transition into adulthood, underscoring the need to strengthen core basic needs programs and investments that help young Californians achieve economic stability and meet their basic needs. Young adulthood is a crucial time to establish independence and start to build financial … ContinuedCalFreshMedi-CalPoverty & Inequality -
Report
Federal and State Budget Decisions Threaten AANHPI Women in California
key takeaway AANHPI women’s experiences vary widely across ethnicities, making disaggregated data essential to understanding the impacts of recent federal and state decisions. By examining the Women’s Well-Being Index indicators across multiple AANHPI ethnicities, this report highlights distinct challenges facing AANHPI women in California and identifies key steps state and local leaders can take to … ContinuedPoverty & Inequality
Stay in the know.
Join our email list!
You can view the PDF version of this Fact Sheet.
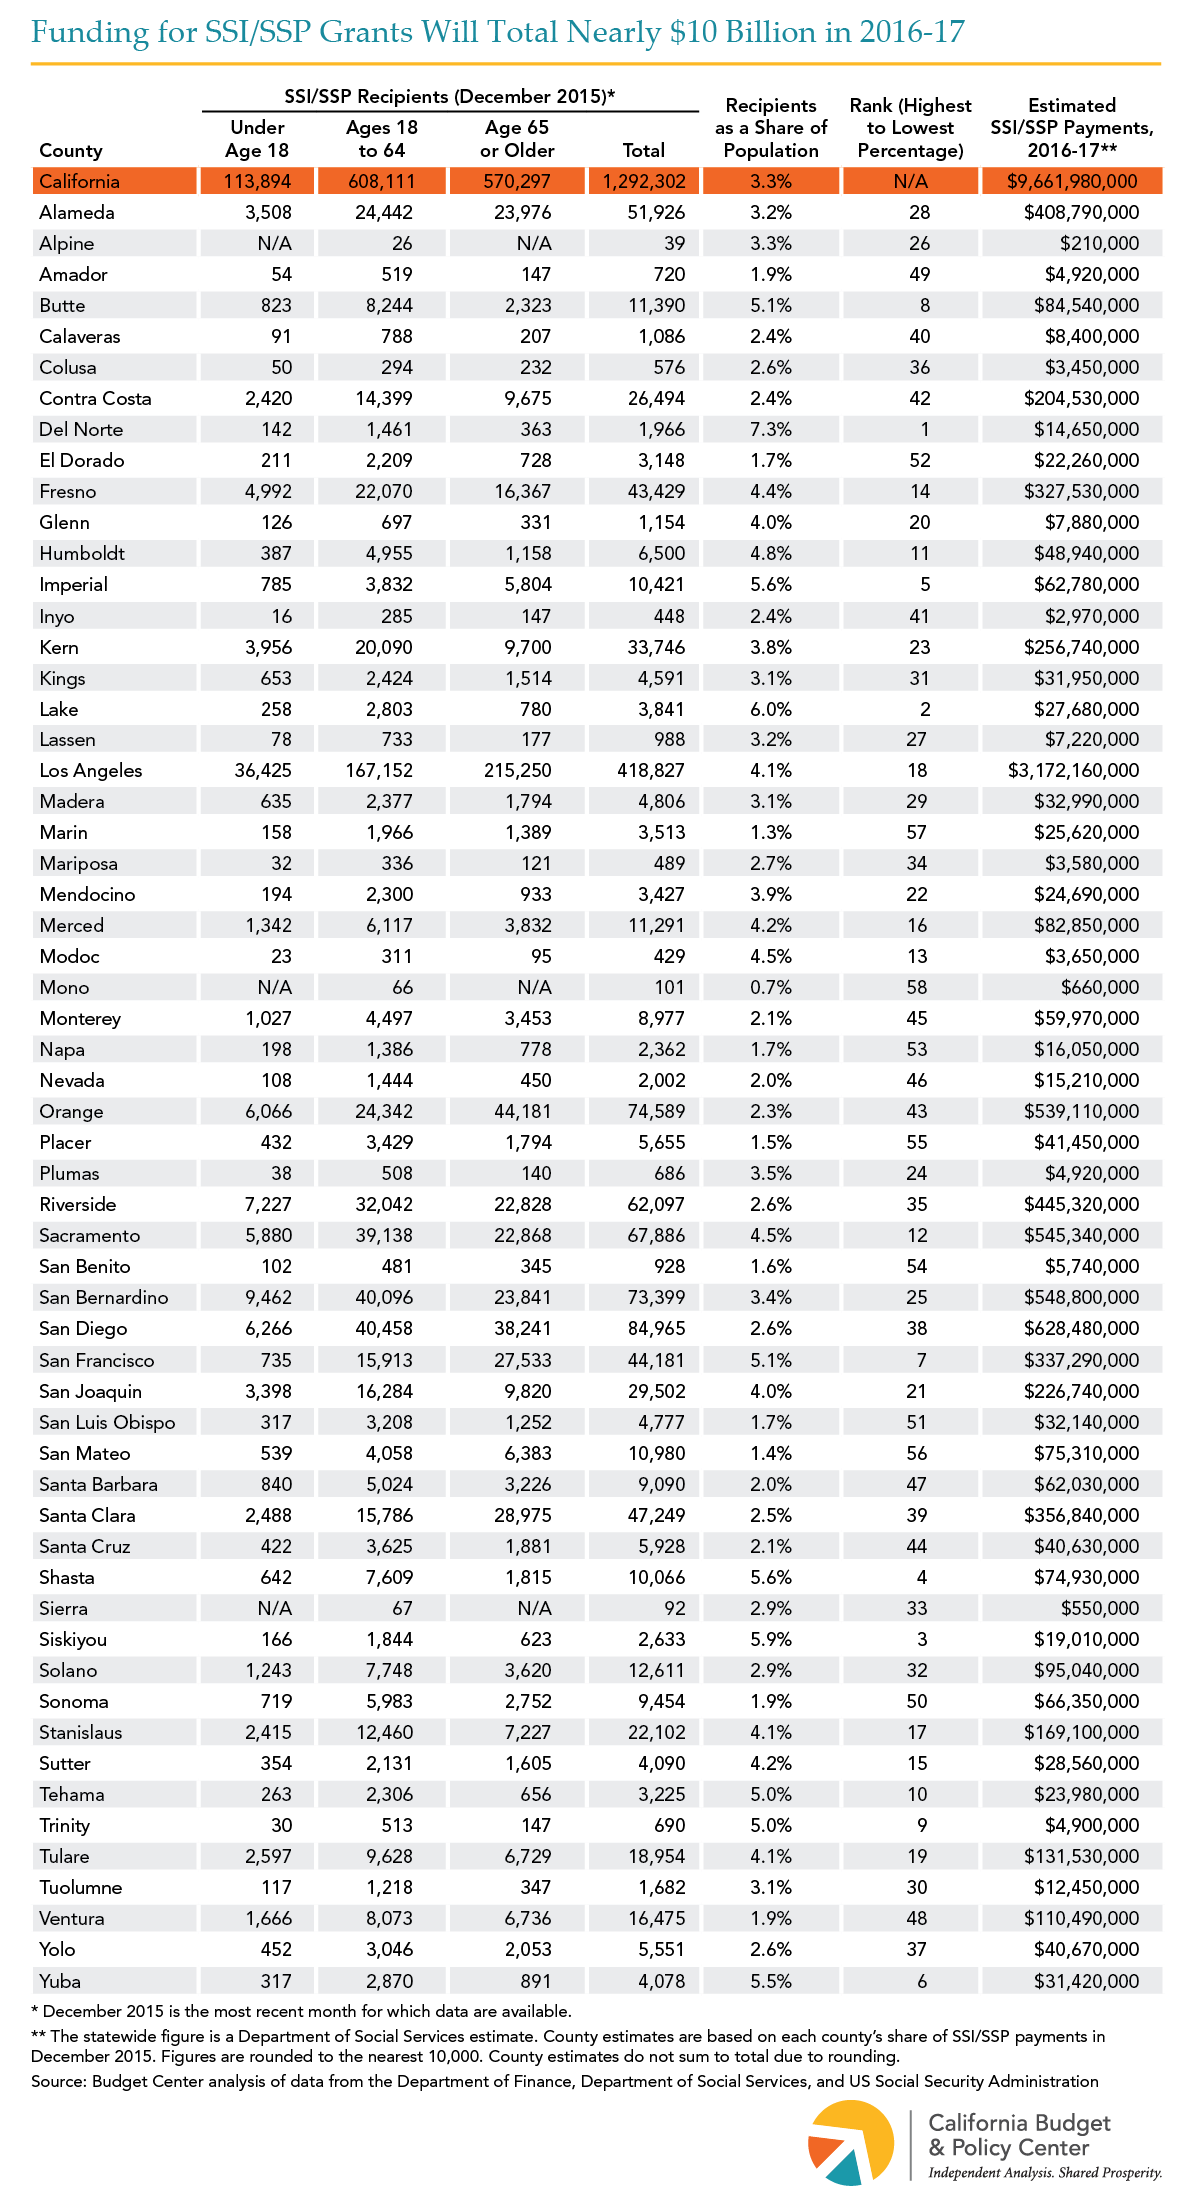
Supplemental Security Income (SSI) provides federally funded cash assistance to help low-income seniors and people with disabilities pay for housing, food, and other necessities. The maximum monthly SSI grant for most recipients in California is currently $735 per month — less than 75% of the federal poverty line for an individual. Also, California funds a State Supplementary Payment (SSP), which provides up to an additional $160.72 per month for most recipients. Yet, the combined maximum SSI/SSP grant for an individual — $895.72 per month — is still equal to only about 90% of the poverty line. Total funding for SSI/SSP will reach nearly $10 billion in 2016-17, with the federal government providing $7.2 billion and the state, $2.5 billion. Of the 10 California counties with the highest shares of residents enrolled in SSI/SSP, most — including the top three of Del Norte (7.3%), Lake (6.0%), and Siskiyou (5.9%) — are in rural areas. The efforts of Republican leaders in Washington to scale back federal support for the safety net could include reductions to SSI. Any such cuts would be a further blow to SSI/SSP recipients who already struggle with California’s high cost of living.
You may also be interested in the following resources:
-
Fact Sheet
Young Californians Face Alarmingly High Rates of Poverty and Deep Poverty
key takeaway Young adults across California face higher-than-average poverty and deep poverty rates as they transition into adulthood, underscoring the need to strengthen core basic needs programs and investments that help young Californians achieve economic stability and meet their basic needs. Young adulthood is a crucial time to establish independence and start to build financial … ContinuedCalFreshMedi-CalPoverty & Inequality -
Report
Federal and State Budget Decisions Threaten AANHPI Women in California
key takeaway AANHPI women’s experiences vary widely across ethnicities, making disaggregated data essential to understanding the impacts of recent federal and state decisions. By examining the Women’s Well-Being Index indicators across multiple AANHPI ethnicities, this report highlights distinct challenges facing AANHPI women in California and identifies key steps state and local leaders can take to … ContinuedPoverty & Inequality
Stay in the know.
Join our email list!
Supplemental Security Income (SSI) provides federally funded cash assistance to help low-income seniors and people with disabilities pay for housing, food, and other necessities. The maximum monthly SSI grant for most recipients in California is currently $735 per month — less than 75% of the federal poverty line for an individual. Also, California funds a State Supplementary Payment (SSP), which provides up to an additional $160.72 per month for most recipients. Yet, the combined maximum SSI/SSP grant for an individual — $895.72 per month — is still equal to only about 90% of the poverty line. Total funding for SSI/SSP will reach nearly $10 billion in 2016-17, with the federal government providing $7.2 billion and the state, $2.5 billion. SSI/SSP recipients live in all 53 of California’s congressional districts. For example, in the 23rd District, represented by House Majority Leader Kevin McCarthy (R-Bakersfield), 3.6% of residents rely on SSI/SSP to help make ends meet. In the 12th District, represented by House Minority Leader Nancy Pelosi (D-San Francisco), 5.2% of residents are enrolled in SSI/SSP. The efforts of Republican leaders in Washington to scale back federal support for the safety net could include reductions to SSI. Any such cuts would be a further blow to SSI/SSP recipients who already struggle with California’s high cost of living.

You may also be interested in the following resources:
-
Case Study
How Santa Barbara County Made Strides in Addressing the Unmet Need for Child Care
jump to: Across California, the demand for publicly funded child care far exceeds the supply. In 2024, only 16% of children eligible for publicly funded child care were enrolled. While state spending for publicly funded child care still falls short of the need, access to child care has improved over time, largely due to the … ContinuedChild Care & Preschool -
Fact Sheet
Cronología de los Recortes de Financiamiento a Medi-Cal y CalFresh en California
Puntos clave Muchas disposiciones incluidas en el perjudicial megaproyecto de ley republicano, H.R. 1, y en el presupuesto estatal de California para 2025-2026 reducirán directamente el financiamiento federal y estatal destinado a Medi-Cal y CalFresh, poniendo a millones de californianos en riesgo de perder su cobertura de salud y asistencia alimentaria. Read this publication in … ContinuedCalFreshFederal PolicyMedi-Cal
Stay in the know.
Join our email list!
Endnotes are available in the PDF version of this Fact Sheet.
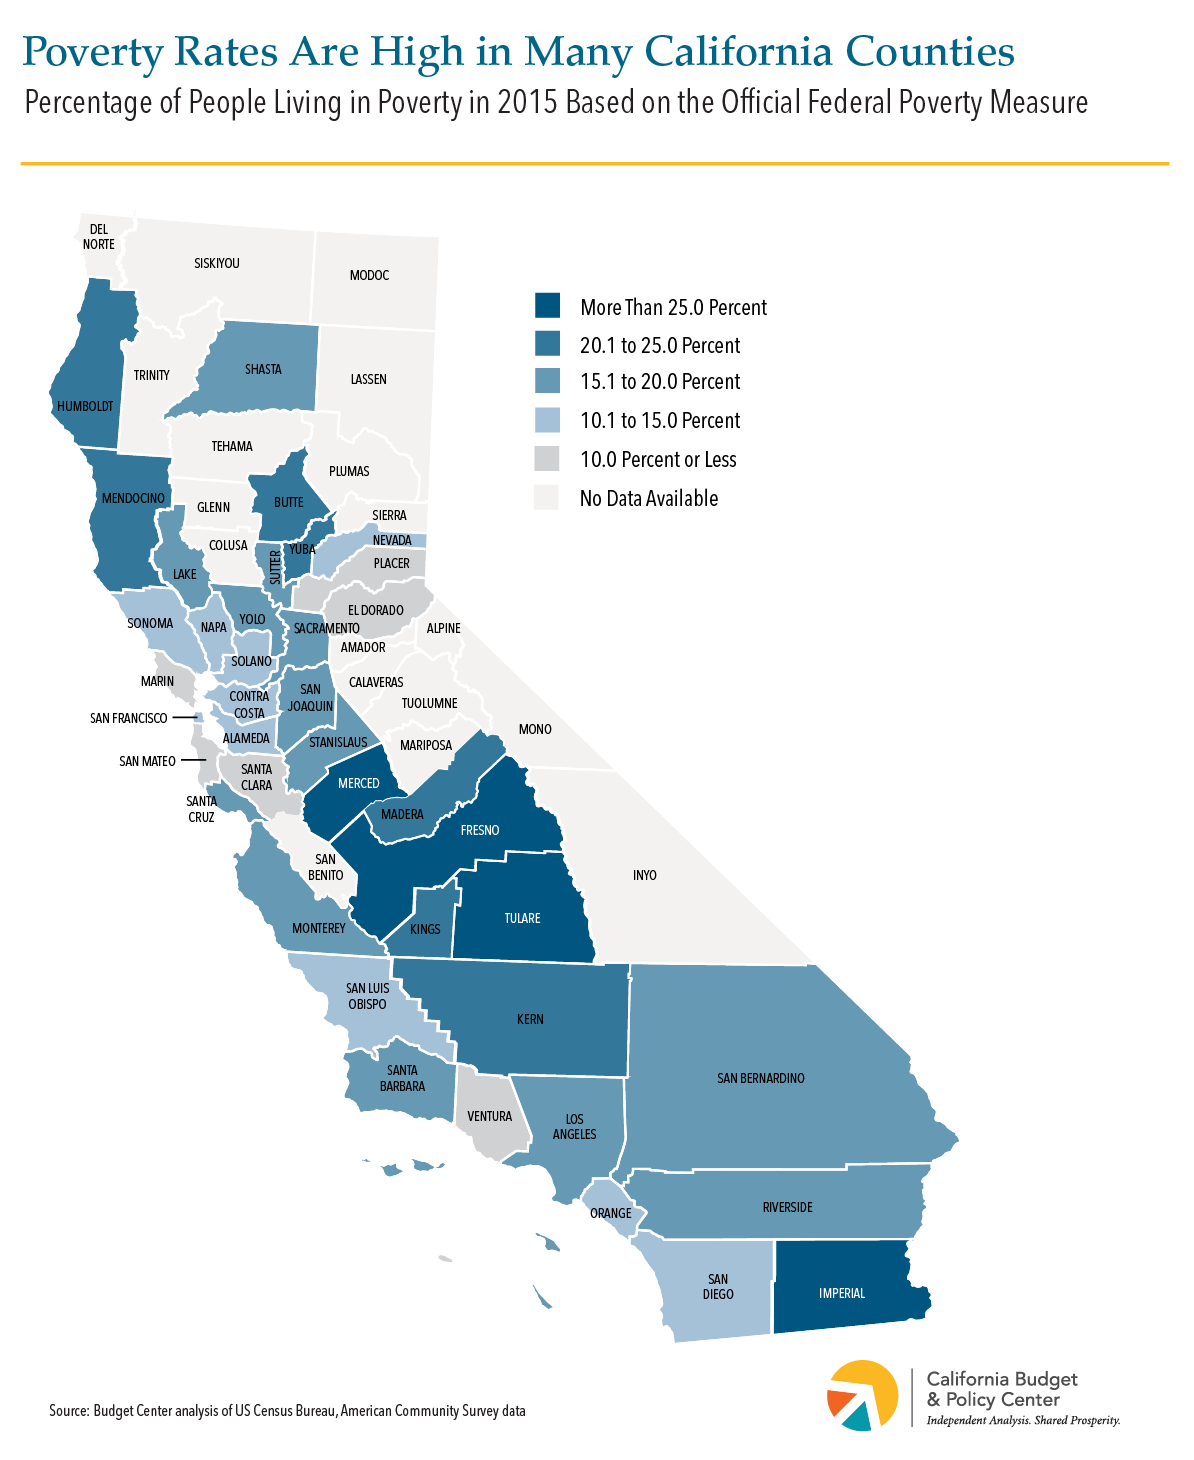
People in many communities across the state are not sharing in California’s recent economic gains. Statewide, nearly 6 million people (15.3 percent), including almost 2 million children (21.2 percent), lived in poverty in 2015, based on the US Census Bureau’s official poverty line, which is about $19,000 in annual income for a family of three. Among California’s counties, there are stark differences in people’s economic well-being. The latest Census figures show that:
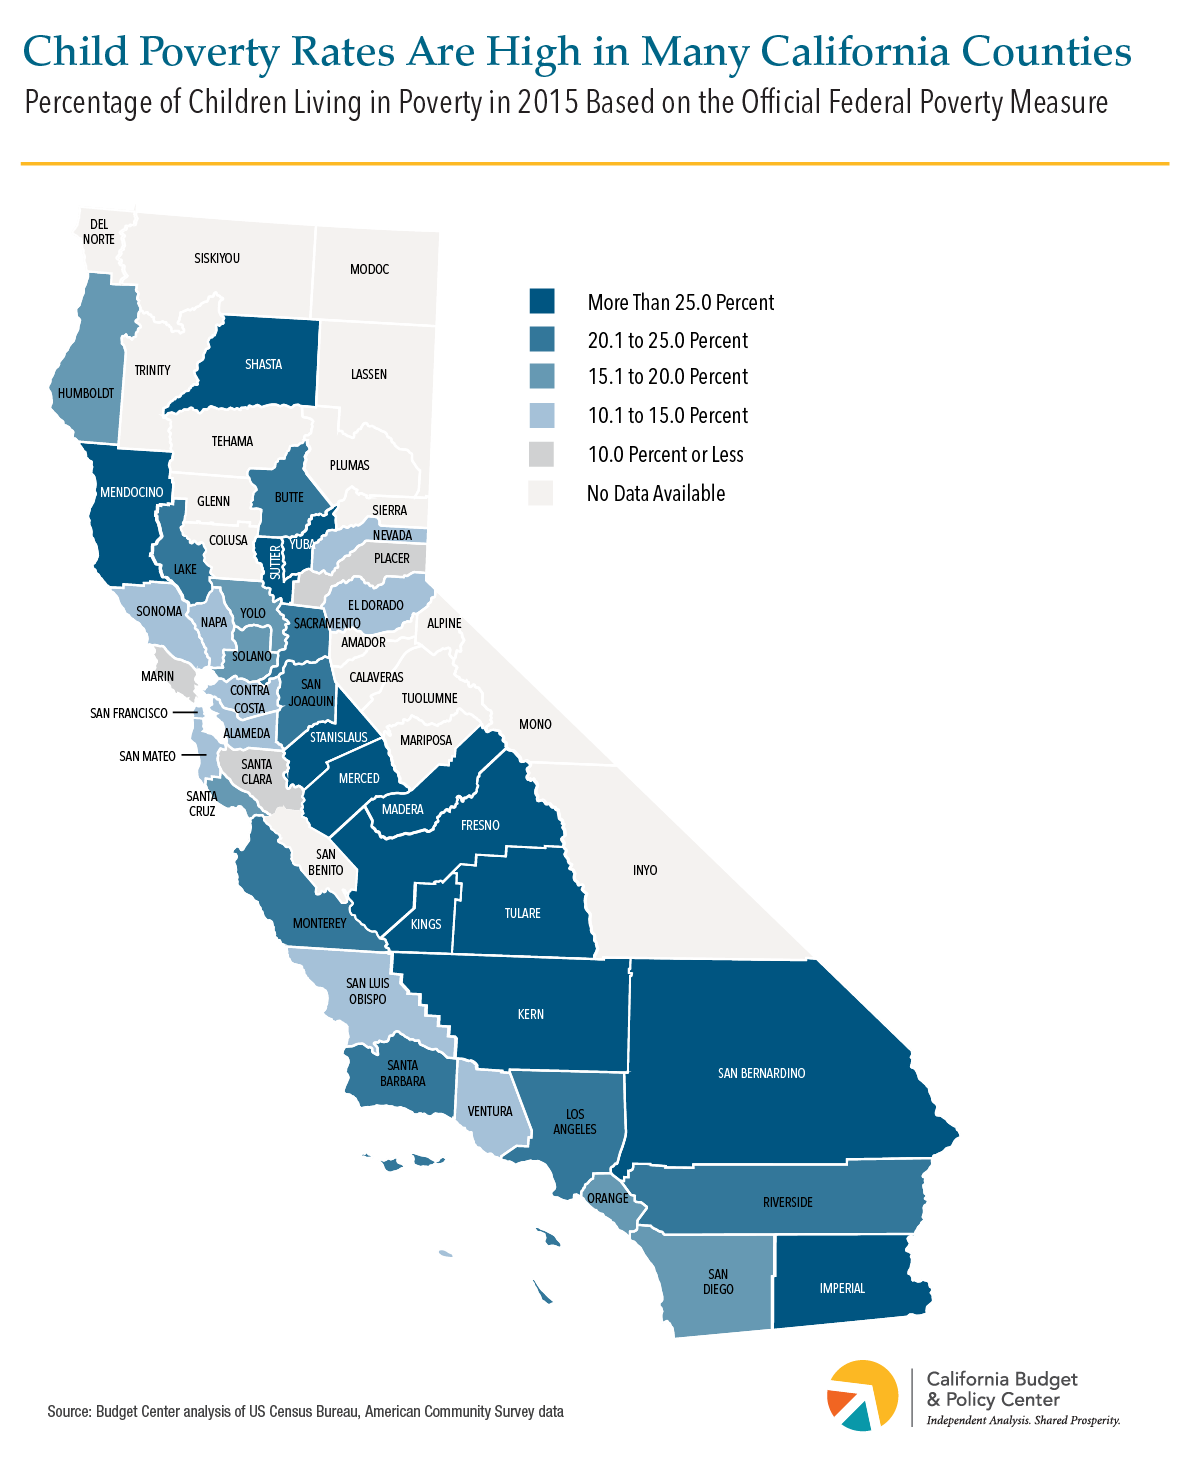
- The share of people struggling to make ends meet varies widely throughout the state. The official 2015 poverty rates ranged from a low of 7.1 percent to a high of 27.6 percent, while the 2015 child poverty rates ranged from a low of 7.4 percent to a high of 38.5 percent. (See tables in this companion Fact Sheet for poverty rates and child poverty rates in each county).
- In 11 counties, more than 1 in 5 people lived in poverty in 2015 (see Map 1, below). This includes four counties — Fresno, Imperial, Merced, and Tulare — where more than one-quarter of all residents lived in poverty. Such high poverty rates are particularly striking given that 2015 marked the sixth year of recovery from the Great Recession, which ended nationally in 2009.
- In 21 counties, more than 1 in 5 children lived in poverty in 2015 (see Map 2, below). This includes five counties — Fresno, Madera, Merced, Tulare, and Yuba — where more than one-third of all children lived in poverty and another eight counties where between one-quarter and one-third of all children lived in poverty.
Map 1
Map 2
You may also be interested in the following resources:
-
Fact Sheet
Young Californians Face Alarmingly High Rates of Poverty and Deep Poverty
key takeaway Young adults across California face higher-than-average poverty and deep poverty rates as they transition into adulthood, underscoring the need to strengthen core basic needs programs and investments that help young Californians achieve economic stability and meet their basic needs. Young adulthood is a crucial time to establish independence and start to build financial … ContinuedCalFreshMedi-CalPoverty & Inequality -
Report
Federal and State Budget Decisions Threaten AANHPI Women in California
key takeaway AANHPI women’s experiences vary widely across ethnicities, making disaggregated data essential to understanding the impacts of recent federal and state decisions. By examining the Women’s Well-Being Index indicators across multiple AANHPI ethnicities, this report highlights distinct challenges facing AANHPI women in California and identifies key steps state and local leaders can take to … ContinuedPoverty & Inequality
Stay in the know.
Join our email list!
Endnotes are available in the PDF version of this Fact Sheet.
The share of Californians facing severe economic hardship remains higher than at the onset of the Great Recession, in 2007, in many communities throughout the state. Statewide, 15.3 percent of residents struggled to get by in 2015 — the most recent year for which data are available — based on the US Census Bureau’s official poverty measure. This was 2.9 percentage points higher than in 2007 (12.4 percent), when the state poverty rate fell to a recent low. In addition, 21.2 percent of California children lived in poverty in 2015 — 3.9 percentage points higher than in 2007 (17.3 percent). Specifically, the latest Census figures show that:
- Poverty remained more widespread in 2015 than at the onset of the recession in 30 out of the 40 counties for which data are available (see Map 1, below). This is especially notable given that 2015 marked the sixth year since the end of the national recession. There was no statistically significant difference in poverty rates between 2007 and 2015 in the remaining 10 counties for which data are available.
- Three counties stand out with severely higher poverty rates. In Kings, Madera, and Sutter counties the 2015 poverty rate was more than 8.0 percentage points higher than in 2007.
- Another 11 counties have poverty rates that substantially exceed 2007 levels. These counties, which include both Inland Empire counties and several counties in the Central Valley, had 2015 poverty rates that were between 4.1 and 8.0 percentage points higher than in 2007.
- In 16 counties, poverty rates modestly exceed 2007 levels. These counties had 2015 poverty rates that exceeded 2007 levels by up to 4.0 percentage points. Notably, these include counties, such as San Francisco and San Mateo, where the local job market has been booming for several years.
Also, child poverty rates in 19 counties are significantly higher than in 2007 (see Map 2, below). Specifically:
- Six counties stand out with severely higher child poverty rates. In Kings, Madera, Merced, and Sutter counties the 2015 child poverty rate was more than 12.0 percentage points higher than in 2007, and in San Bernardino and Stanislaus counties the 2015 child poverty rate was between 8.1 and 12.0 percentage points higher than in 2007.
- Another nine counties have child poverty rates that are substantially higher than in 2007. These counties, which include parts of the Central Valley, central coast, and southern California, had 2015 child poverty rates that were between 4.1 and 8.0 percentage points higher than in 2007.
- In four counties, child poverty rates are modestly higher than in 2007. Los Angeles, San Diego, San Mateo, and Sonoma counties had 2015 child poverty rates up to 4.0 percentage points higher than in 2007.
Map 1

Map 2

The following tables provide the underlying data for 2007, 2012, and 2015 that this Fact Sheet is based on.


You may also be interested in the following resources:
-
Fact Sheet
Young Californians Face Alarmingly High Rates of Poverty and Deep Poverty
key takeaway Young adults across California face higher-than-average poverty and deep poverty rates as they transition into adulthood, underscoring the need to strengthen core basic needs programs and investments that help young Californians achieve economic stability and meet their basic needs. Young adulthood is a crucial time to establish independence and start to build financial … ContinuedCalFreshMedi-CalPoverty & Inequality -
Report
Federal and State Budget Decisions Threaten AANHPI Women in California
key takeaway AANHPI women’s experiences vary widely across ethnicities, making disaggregated data essential to understanding the impacts of recent federal and state decisions. By examining the Women’s Well-Being Index indicators across multiple AANHPI ethnicities, this report highlights distinct challenges facing AANHPI women in California and identifies key steps state and local leaders can take to … ContinuedPoverty & Inequality
Stay in the know.
Join our email list!
Budget Center Executive Director Chris Hoene joined the Asset Funders Network for their 6th Annual Asset Building Symposium – Fostering Economic Equity in a Changing Bay Area – to deliver his presentation, “A Snapshot of Poverty in California.”
You may also be interested in the following resources:
-
Case Study
How Santa Barbara County Made Strides in Addressing the Unmet Need for Child Care
jump to: Across California, the demand for publicly funded child care far exceeds the supply. In 2024, only 16% of children eligible for publicly funded child care were enrolled. While state spending for publicly funded child care still falls short of the need, access to child care has improved over time, largely due to the … ContinuedChild Care & Preschool -
Fact Sheet
Cronología de los Recortes de Financiamiento a Medi-Cal y CalFresh en California
Puntos clave Muchas disposiciones incluidas en el perjudicial megaproyecto de ley republicano, H.R. 1, y en el presupuesto estatal de California para 2025-2026 reducirán directamente el financiamiento federal y estatal destinado a Medi-Cal y CalFresh, poniendo a millones de californianos en riesgo de perder su cobertura de salud y asistencia alimentaria. Read this publication in … ContinuedCalFreshFederal PolicyMedi-Cal
Stay in the know.
Join our email list!
Budget Center Executive Director Chris Hoene joined the Asset Funders Network for their 6th Annual Asset Building Symposium – Fostering Economic Equity in a Changing Bay Area – to deliver his presentation, “A Snapshot of Poverty in California.”
You may also be interested in the following resources:
-
Fact Sheet
Young Californians Face Alarmingly High Rates of Poverty and Deep Poverty
key takeaway Young adults across California face higher-than-average poverty and deep poverty rates as they transition into adulthood, underscoring the need to strengthen core basic needs programs and investments that help young Californians achieve economic stability and meet their basic needs. Young adulthood is a crucial time to establish independence and start to build financial … ContinuedCalFreshMedi-CalPoverty & Inequality -
Report
Federal and State Budget Decisions Threaten AANHPI Women in California
key takeaway AANHPI women’s experiences vary widely across ethnicities, making disaggregated data essential to understanding the impacts of recent federal and state decisions. By examining the Women’s Well-Being Index indicators across multiple AANHPI ethnicities, this report highlights distinct challenges facing AANHPI women in California and identifies key steps state and local leaders can take to … ContinuedPoverty & Inequality
Stay in the know.
Join our email list!