Millions of Californians who cope with behavioral health conditions — mental illness or substance use disorders — rely on services and supports that are primarily provided by California’s 58 counties. Improving California’s behavioral health system is critical to ensure access to these services for all Californians, regardless of race, age, gender identity, sexual orientation, or county of residence.
In recent years, state policymakers have launched various initiatives to transform California’s behavioral health system with the goal of improving access for Californians. The most recent of these initiatives is Prop. 1. Last year, state policymakers passed, with strong support from Governor Gavin Newsom, Senate Bill 326 and Assembly Bill 531. Together, these bills placed Prop. 1 on the March 2024 ballot.
On March 5, 2024, California voters will vote on Prop. 1, a two-part measure that would 1) amend California’s Mental Health Services Act and 2) create a $6.38 billion general obligation bond. The bond would fund:
- Behavioral health treatment and residential facilities,
- Supportive housing for veterans and individuals at risk of or experiencing homelessness with behavioral health challenges.
This initiative presents beneficial aspects as well as potentially adverse consequences for Californians. This Q&A provides a high-level overview of Prop. 1, including how Californians with behavioral health conditions might be impacted by its passage as well as implications for the state budget.
Key Terms
- Behavioral health services
- Full Service Partnerships
- Permanent supportive housing
- Serious mental illness
- Substance use disorder
Why Does Prop. 1 Matter for Californians?
Prop. 1 would impact how many Californians access mental health services and substance use disorder treatment in their communities. It would restructure a key funding source for county behavioral health services in ways that would increase housing supports but might adversely impact counties’ ability to provide behavioral health services.
The Mental Health Services Act (MHSA), which Prop. 1 would amend, accounts for about one-third of funding for county behavioral health services. The MHSA is essential in supporting services for Californians across different ages, addressing a spectrum of mild to severe behavioral health conditions.
Prop. 1 would also authorize a statewide bond to create mental health and substance use treatment beds, and housing with supportive services for unhoused Californians with behavioral health challenges. Increased supportive housing and access to treatment facilities is crucial for Californians. Capital funds accessed through the bond portion of Prop. 1 will slightly impact the state’s ability to make budgetary decisions year-to-year. However, the capacity of the state to issue future voter-approved bonds will decrease because California has a limited ability to finance bond measures.
Changes to the MHSA will impact a system that currently supports all Californians with behavioral health conditions. In contrast, the bond focuses on individuals with behavioral conditions who are at risk of or experiencing homelessness, which is a smaller portion of the unhoused population.
As thousands of Californians across the state experience the devastating effects of homelessness and barriers to behavioral health care, policymakers are asking Californians to consider if redirecting MHSA funds and authorizing a new general obligation bond is the right approach to addressing the state’s behavioral health and homelessness crises.
What Problem Is Prop. 1 Trying to Address?
Prop. 1 aims to support Californians who are most affected by severe behavioral health conditions (mental illness and substance use disorders) and homelessness. This initiative is designed to create designated funding for mental health services and housing or treatment units for people with behavioral health conditions who are or at risk of experiencing homelessness.
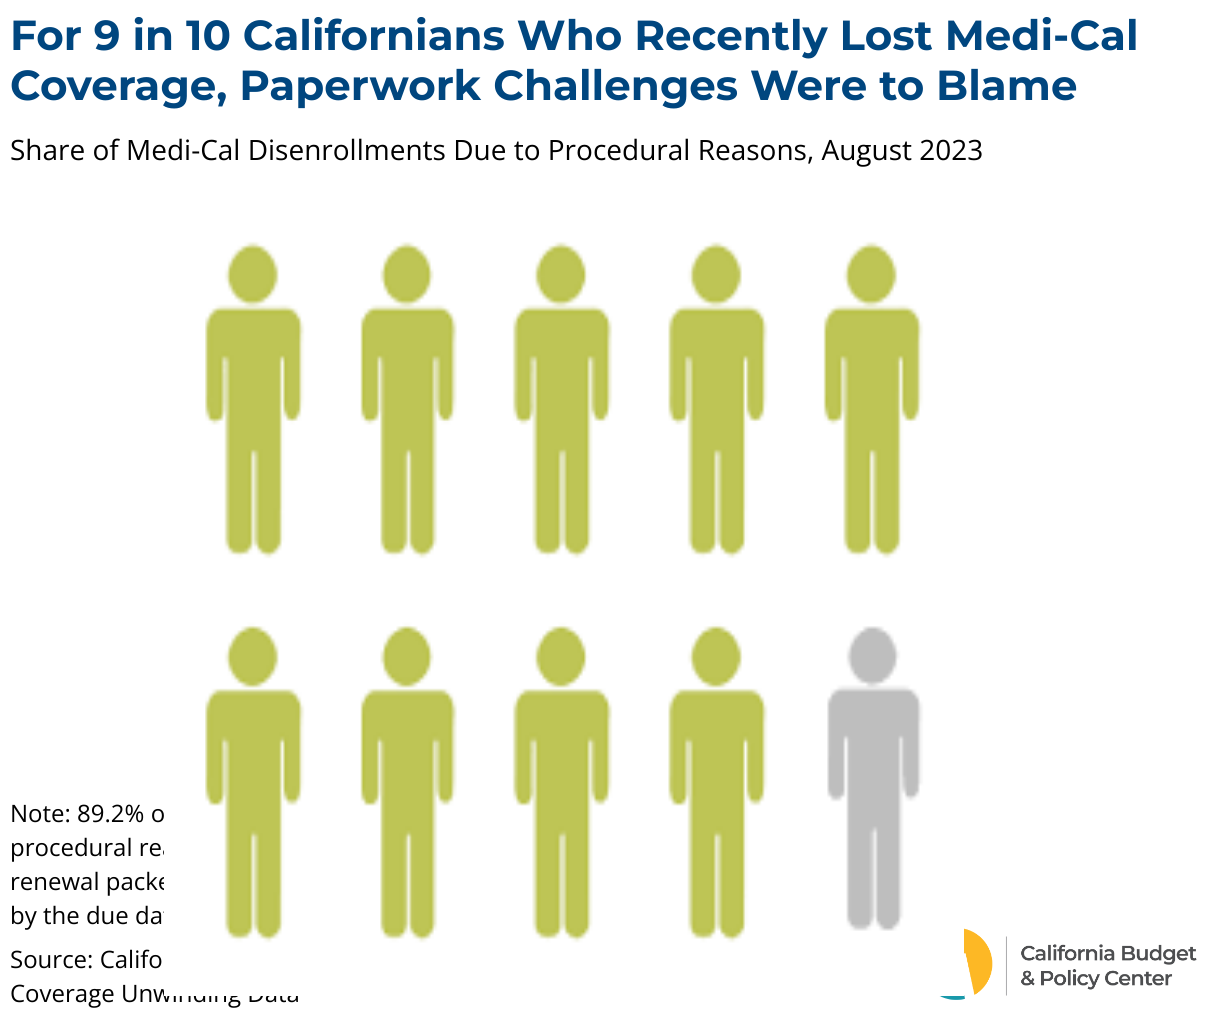
In early 2023, over 181,000 Californians were counted as experiencing homelessness — the traumatic effects of which can seriously harm individuals’ well-being. Research suggests the trauma of experiencing homelessness can cause people to develop mental health problems and worsen existing behavioral health challenges and coping behaviors like substance use.
There are data challenges in quantifying exactly how many unhoused Californians have a mental health condition or substance use disorder. The 2023 homelessness point-in-time count showed 25% of the 181,399 people experiencing homelessness in California had a severe mental illness and 24% had a substance use disorder. However, while there is likely overlap between these individuals, the full extent is not reported.
Access to mental health care and substance use disorder treatment can be challenging for Californians who are unhoused. A recent statewide study found that nearly 4 in 5 unhoused Californians surveyed reported experiencing a serious mental health condition at some point in life, and those with current mental health conditions reported limited access to treatment. Additionally, 1 in 5 unhoused Californians who reported regular substance use and wanted treatment were not able to receive it.
These challenges are compounded by California’s shortage of adult psychiatric and community residential beds, which prevents Californians with serious behavioral health conditions from accessing critical behavioral health services.
What Is the Mental Health Services Act?
In 2004, California voters approved the Mental Health Services Act (Prop. 63), which created a 1% surtax on personal incomes above $1 million to provide increased funding for mental health services. Its passage signified a commitment to improving mental health outcomes for Californians, with a focus on prevention, early intervention, and community-based care. This tax supports about one-third of the state’s public mental health system.
The Mental Health Services Act has five main goals:
- Community Services and Supports
- Prevention and Early Intervention
- Innovation
- Capital Facilities and Technological Needs
- Workforce Education and Training
How Are Mental Health Services Act Funds Used Today?
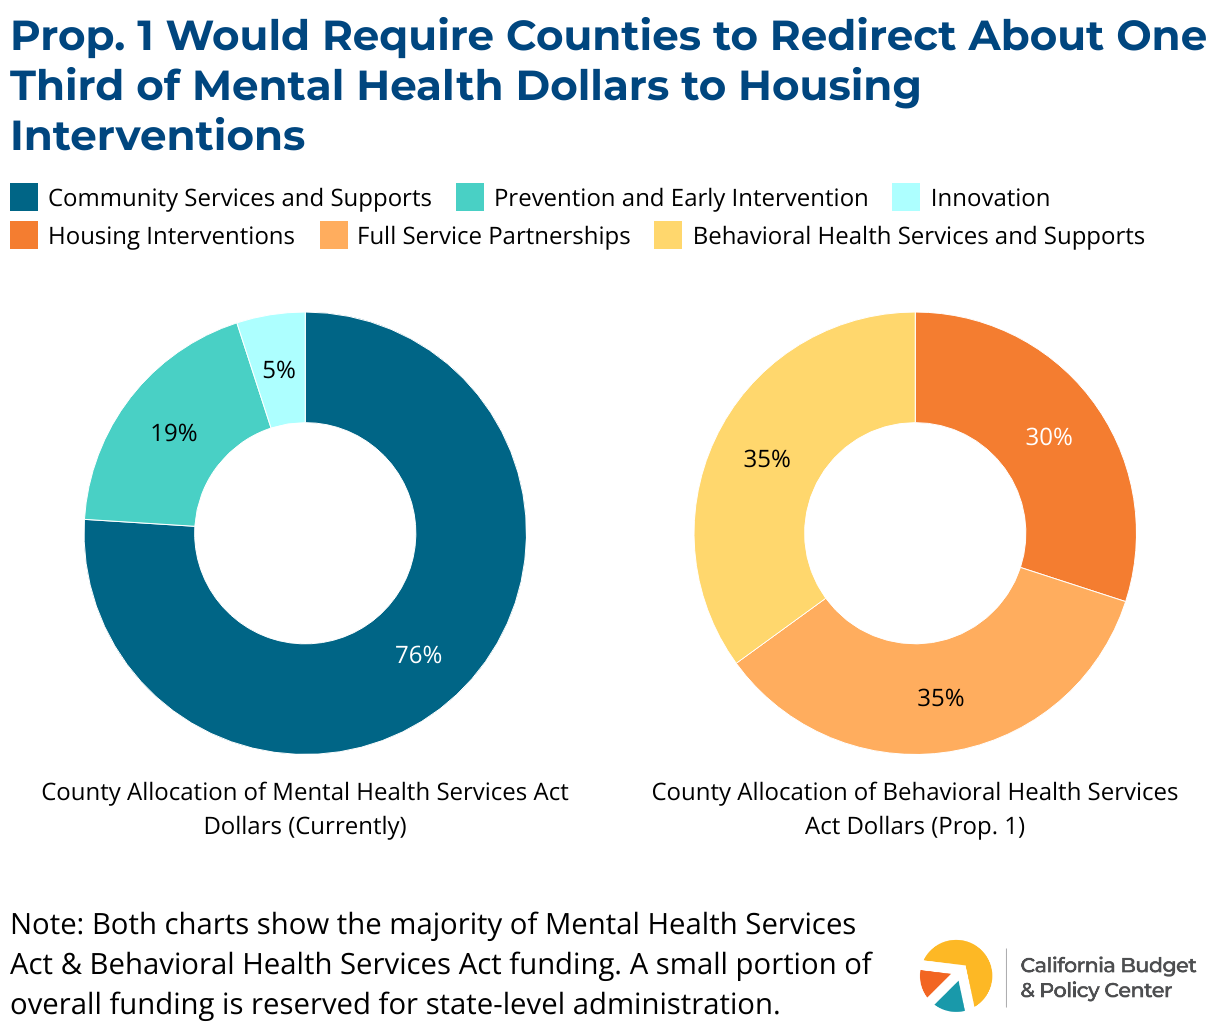
The majority of MHSA funding (95%) goes directly to counties, which have some flexibility in how to use these funds.
Under current law, a small percentage of MHSA dollars (5%) is reserved for state-level administration.
How Would Prop. 1 Change Mental Health Services Act Spending?
Prop. 1 proposes significant revisions to the Mental Health Services Act (MHSA). These include:
- Changing its name to the Behavioral Health Services Act (BHSA),
- Expanding its scope to encompass treatment for substance use disorders.
Additionally, it would modify how MHSA funds are allocated, and introduce changes related to oversight, accountability, and the community planning process. This overview will focus on outlining the new funding structure under Prop. 1.
Under Prop. 1, counties would continue to receive the bulk of BHSA funds (90%). However, the allocation across different spending categories would change, without an increase in revenues. Counties would allocate their BHSA funds as follows:
- 30% for housing interventions
- 35% for Full Service Partnerships programs
- 35% for behavioral health services and supports
Prop. 1 could provide some exemptions for counties with a population of less than 200,000. In addition, during the first two years of implementation, counties might have the flexibility to transfer up to 14% of their funding between these categories, with a limit of 7% per category. However, this flexibility is still pending state approval and has not been confirmed.
Another notable change is that Prop. 1 would shift a small percentage of dollars from counties to the state (from about 5% of total MHSA funding to about 10%). This would result in about $140 million annually redirected to the state budget. However, this amount could be higher or lower depending on the total amount of revenue collected from the tax.
Prop. 1 would also revise the allocation of state-level funds:
- At least 3% to the Department of Health Care Access and Information to implement a statewide behavioral health workforce initiative.
- At least 4% to the California Department of Public Health for population-based mental health and substance use disorder prevention programs. A minimum of 51% of these funds must be used for programs serving Californians who are 25 years or younger.
It’s worth noting that Prop. 1 would not change the tax on people with incomes over $1 million per year. This means counties would be expected to expand their scope of services without an increase in revenue. In fact, county leaders have repeatedly raised concerns about the disruption that Prop. 1 could cause. Specifically, the MHSA restructuring could result in significantly less funding for core services, which could lead to counties:
- Canceling contracts with community-based organizations.
- Closing programs that are currently serving Californians.
- Reducing county staffing.
If passed, the exact impact of Prop. 1 will vary by county and depend on how much revenue is collected in any given year. It’s important to keep in mind that the MHSA funds services for Californians of all ages for a range of conditions — mild to moderate to severe. The restructuring of MHSA funding would target a subset of this population. Therefore, programs and services for prevention and early intervention in some counties, for instance, could experience disruptions due to the new prioritization of funding.
What Can We Expect from the Behavioral Health Infrastructure Bond?
The Behavioral Health Infrastructure Bond would create a $6.38 billion general obligation bond for:
- Infrastructure development of treatment and residential care facilities,
- Supportive housing units for veterans and other Californians with serious mental health conditions and substance use disorders.
These funds are estimated to create up to 4,350 housing units, with 2,350 set aside for veterans, and 6,800 mental health and substance use treatment places for an approximate total of 11,150 new behavioral health and supportive housing units statewide. An estimated 26,700 outpatient treatment slots will also be created that may serve thousands of Californians annually.
Projects funded by the Behavioral Health Infrastructure Bond will be eligible for local streamlined review processes if they meet select criteria. The bond funds will be allocated as follows:
- $2.893 billion for grants for voluntary and involuntary behavioral health treatment and residential facilities encompassed under the Behavioral Health Continuum Infrastructure Program (BHCIP)
- $1.5 billion for grants specifically for counties, cities, and tribal entities for voluntary and involuntary behavioral health treatment and residential facilities encompassed under BHCIP
- $1.065 billion for loans or grants to develop supportive housing for veterans
- $922 million for loans or grants to develop supportive housing

What Would the Infrastructure Bond Mean for the State Budget?
Under Prop. 1, the state would issue up to $6.38 billion in general obligation (GO) bonds, with the funds going toward:
- Grants or loans for vital treatment and residential care facilities,
- Supportive housing units.
California voters have a record of funding large infrastructure projects through bonds as it does allow the state to access impactful funding amounts that are designed to serve public interests at large over many years.
In issuing bonds, the state must repay the bond debt service (which is the principal bond amount plus interest) through General Fund dollars. The most recent cost estimate assumes a 30-year debt service resulting in projected payments of roughly $310 million per year. Under this estimate, it would cost the state approximately $9.3 billion to repay the total bond debt, not including the cost of inflation. California currently spends roughly 2.5% of the state budget on repaying various bond obligations voters have decided on in the past.
While there are ways to equitably reform the state budget’s revenue streams, policymakers must balance the yearly limited discretionary flexible dollars in the General Fund. GO bonds in essence prioritize increased debt-service payments to be drawn from the General Fund over potential ongoing or one-time funding. Repaying the bond portion of Prop. 1 is a trade-off that will slightly reduce the flexible dollars left for other vital public services that may already serve Californians with behavioral health conditions and those at risk of or experiencing homelessness. It also challenges the state’s capacity to fund future voter-approved bonds since California has limitations on financing bond measures.
Another consideration is the ongoing operating costs that will be needed to adequately sustain the facilities produced through Prop. 1. As explained above, the MHSA restructuring does designate 30% to housing interventions which includes rental and operating subsidies. The funds can presumably help sustain facilities that are projected to be secured through the bond funding. However, it is uncertain whether these funds and those from other sources will be sufficient and accessed efficiently to ensure adequate upkeep, staffing, and proper care for the Californians receiving housing and services through these projects.
The infrastructure projects funded under the bond would build on existing state programs that received one-time funding through previous budget allocations or voter-approved bonds which are close to being depleted.
How Might Californians Be Impacted by Prop. 1?
The proposal presents various promising aspects. First of all, the expansion of services to substance use disorder treatment is positive. This broadened scope recognizes that mental health challenges and substance use disorders sometimes occur together. In fact, more than 1 in 4 adults living with a serious mental illness also have a substance use disorder. This underscores the importance of providing treatment for both conditions.
Another positive aspect of this proposal is the prioritization of treatment facilities and supportive housing infrastructure for Californians at risk of or experiencing homelessness with behavioral health conditions. Due to racism, ableism, and other forms of discrimination, some Californians are more likely to experience the devastating effects of homelessness at some point in their lifetime. This disparity is particularly stark for Black, Indigenous and Pacific Islander Californians, adults without children, older adults, and transgender and other LGBTQ+ individuals.
Notably, the new investments and prioritization of funds under Prop. 1 target a small but important share of the unhoused population. The majority of unhoused Californians face short-term homelessness (61%), for which deeply affordable permanent housing is needed. For those who are chronically homeless (39%) and may have behavioral health challenges, the increased supportive housing units are crucial if they are appropriately sustained with wraparound supportive services.
One concern about Prop. 1 is the restructuring of funding under the Mental Health Services Act (MHSA). While the exact consequences of this change are not entirely clear for each county, it could have adverse effects. The MHSA has been instrumental in providing innovative, community-based services for historically underserved communities, including people of color and LGBTQ+ communities. Given that county leaders have expressed that this initiative could result in less funding for core services, Prop. 1 could negatively impact services for Californians of color and LGBTQ+ communities that are currently supported by MHSA funding.
A key flaw of this initiative is that it expands the scope of the MHSA and prioritizes funding for people who are or at risk of experiencing homelessness without increasing the tax or providing new revenue to support existing county behavioral health programs. This approach is concerning, as it redirects funds originally allocated for a specific purpose to address a different need.
What Are Supporters and Opponents Saying?
supporters
Supporters claim that Prop. 1 would prioritize existing funds and generate new funds for Californians with the most severe behavioral health needs and those living in encampments. Other supporters assert that the proposition is a beneficial component in advancing the variety of interventions needed to address California’s housing and homelessness challenges. Supporters of Prop. 1 include California Big City Mayors as well as some behavioral health and housing advocates.
opponents
Opponents, including disability rights advocates and peer support advocates, argue that Prop. 1 represents a significant regression in the treatment of mental illness and substance use disorders, likening its impact to a 50-year setback. This perspective stems from allowing funding to be used for involuntary or forced treatment facilities. Opponents also claim that Prop. 1 could result in reduced mental health services for Black, Indigenous, and other people of color and LGBTQ+ Californians.