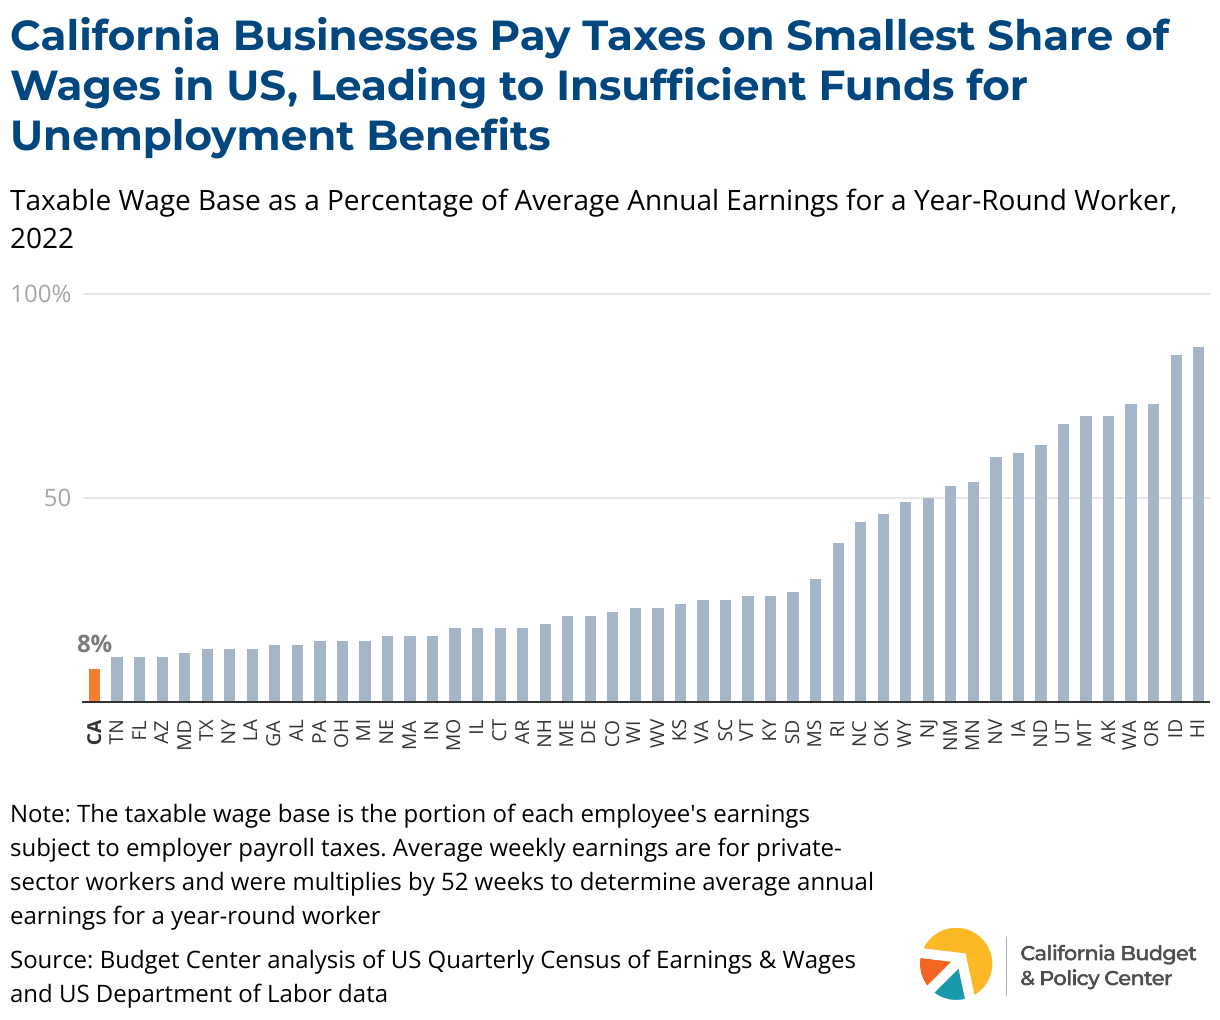
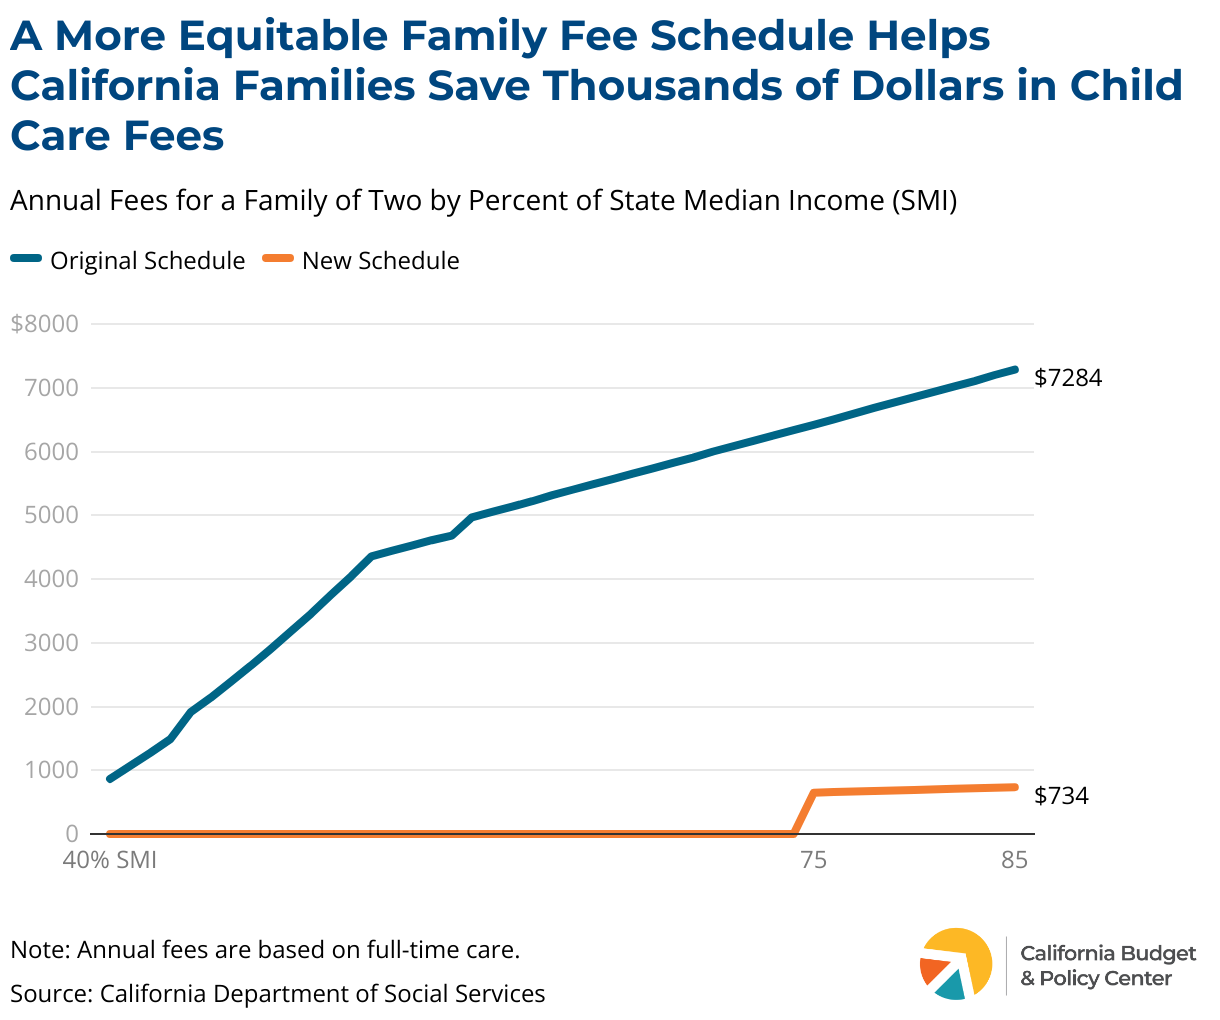
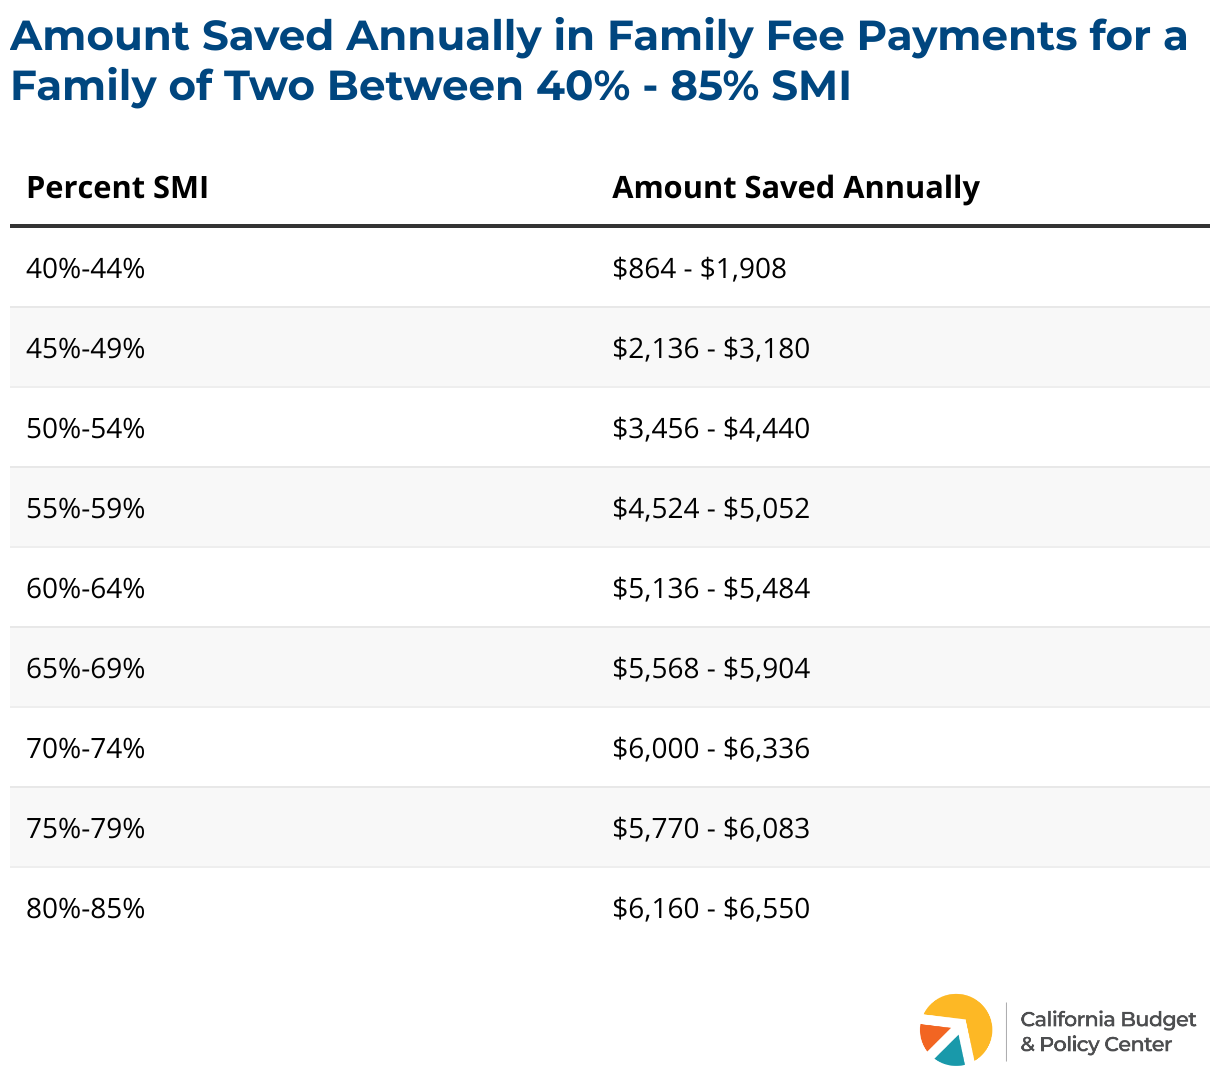
Unemployment benefits provide a critical safety net for many workers who lose their jobs, helping them to support their families while they seek to reenter the workforce. However, state unemployment benefits have not been raised in two decades and currently don’t provide enough money for Californians – particularly those with low incomes – to cover the cost of living. This points to the urgent need for California to increase state unemployment benefits so that workers can make ends meet when they lose work.
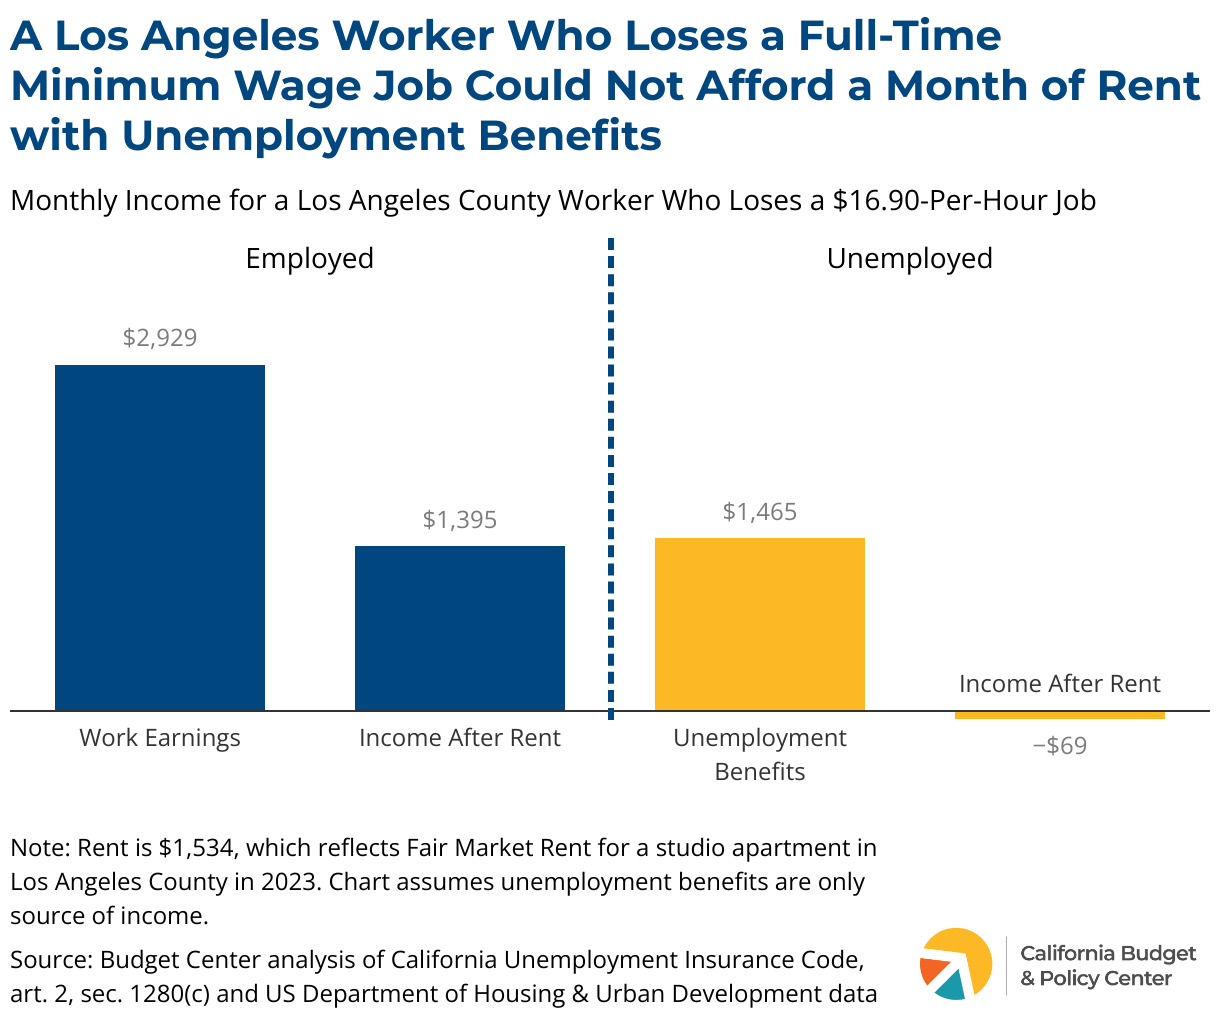
California’s unemployment benefits only replace up to half of a worker’s lost earnings. But many workers struggle to pay for food and rent even while working full-time. Covering the costs of living on half of their earnings is impossible. For the majority of California renters with low incomes who spend at least half of their income on rent, their entire unemployment benefit would go to rent if they don’t have other income sources. Or it might not even cover the full cost of rent, leaving them in debt, at risk of eviction, and with nothing left over to pay for other basic needs. For example, a worker who loses a full-time minimum wage job (at $16.90-per-hour in Los Angeles County) receives just $1,465 in monthly unemployment benefits, which falls $69 short of covering rent for a studio in Los Angeles.
Workers of color, including American Indian, Black, Latinx, and Pacific Islander Californians – and particularly women – are especially at risk of being unable to support their families while out of work because many have been segregated into low-paying jobs where unemployment benefits are too low to cover basic living costs. Insufficient benefits pose a particularly significant threat to the economic security of Black Californians, who consistently face twice the unemployment rate of white workers due to hiring discrimination and other barriers to work created through centuries of structural racism.
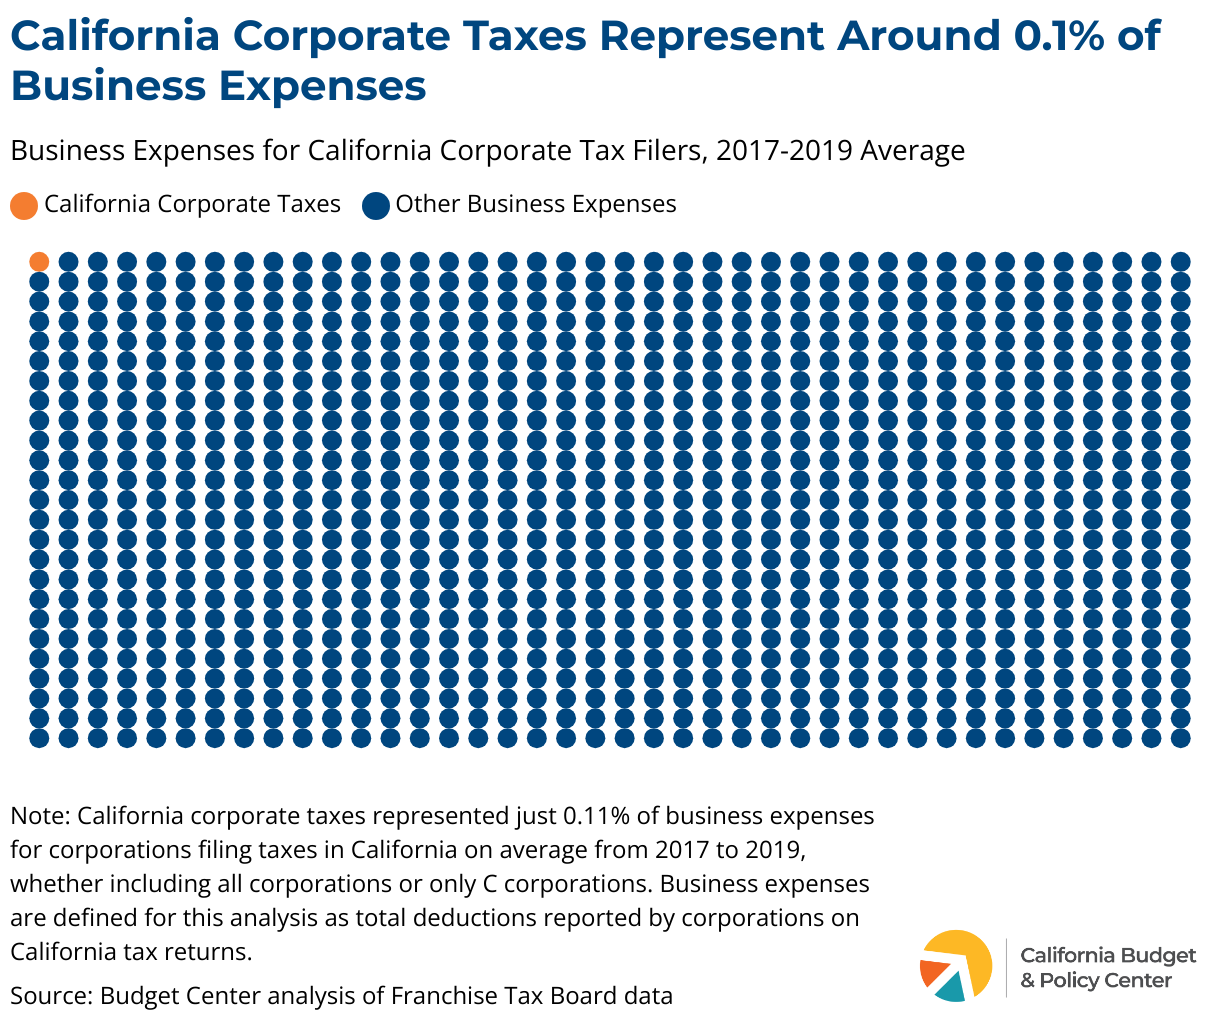
Losing a job would be less devastating if Californians could count on getting unemployment benefits that allow them to cover the costs of rent, food, and other basic needs while they search for work. State lawmakers should increase state unemployment benefits, especially for low-paid workers, and make sure that businesses uphold their responsibility to adequately fund this critical safety net for their workforce.