The California budget process moves quickly after the governor releases the “May Revision” in mid-May. This revised budget proposal opens a crucial window for public engagement, but the tight timeline can make advocating for your priorities challenging.
Here’s a breakdown of the key stages:
May Revision: The governor releases an updated budget proposal on or before May 14. This is your chance to weigh in with, and express, your budget priorities to policymakers.
Budget Negotiations: Policymakers engage in intense negotiations to reconcile the governor’s budget plan with legislative priorities throughout May and June.
Legislative Budget Plan: Roughly 10 to 14 days after the May Revision (timing depends on when the revised budget is released), the Assembly and Senate release their own budget plans. Roughly 2 to 3 weeks after the May Revision, legislative leaders agree on a unified legislative budget plan. This plan forms the basis for the Budget Act. A deal with the governor at this stage is possible but not very likely.
Constitutional Deadline: The Legislature passes the Budget Act by June 15 — the constitutional deadline — and sends it to the governor, even as negotiations continue between legislative leaders and the governor on the full budget package.
Budget Deal Announcement: The “Big 3” — the governor, Assembly Speaker, and Senate President pro Tempore — typically announce a final budget deal by late June.
Budget Package Approval: In late June, all budget-related legislation (including trailer bills) is unveiled, voted on by both houses of the Legislature, and signed by the governor, potentially with line-item vetoes.
The June package isn’t the end of the story. In August, state leaders often revisit the budget, potentially adding to the size and scope of the original budget package enacted earlier in the summer.
Want to Better Understand the State Budget?
The Budget Center’s essential resources for understanding and navigating the California state budget — all in one place.
Explore tools, videos, and expert insights designed to strengthen your advocacy and guide informed decision-making.
There was a problem processing your signup. Please try again. Or contact us
Please check your email to confirm your signup.
key takeaway
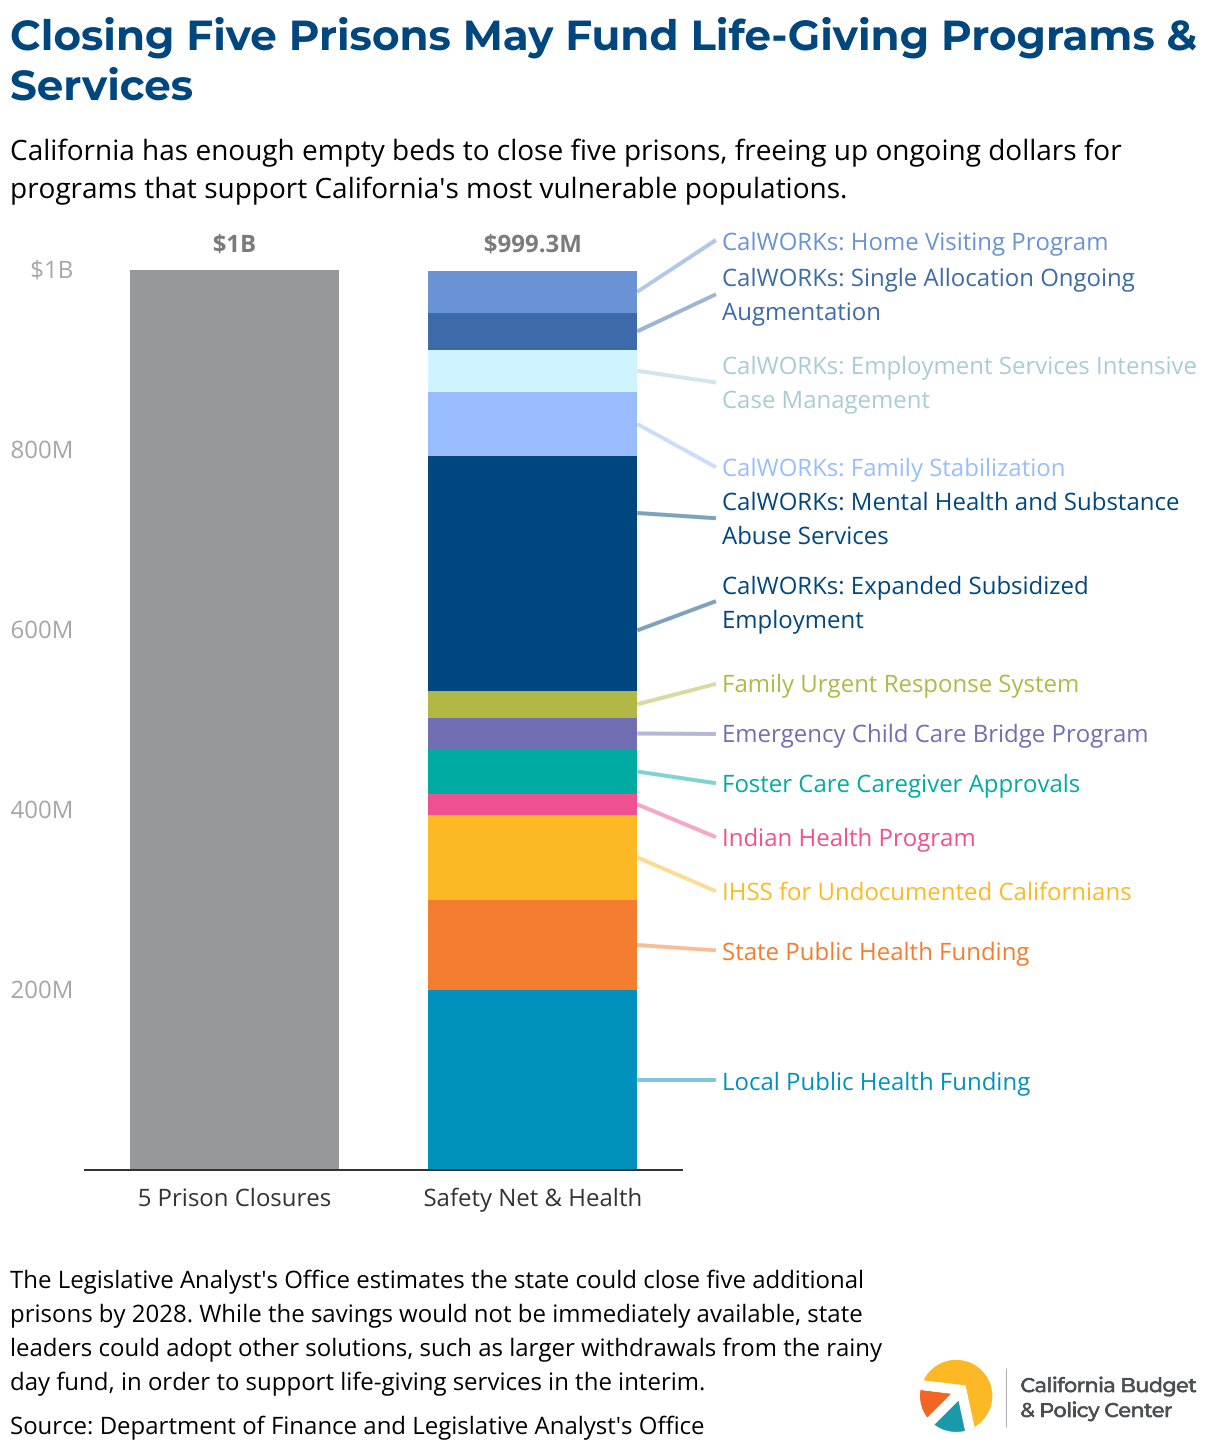
Closing California state prisons is a key underutilized tool that can provide the funds needed to offset cuts to vital safety net and health programs.
The governor’s 2024-25 May Revision includes deep cuts to critical programs and services that support California’s most vulnerable populations. The solutions the administration proposes for closing the May Revision’s projected $27.6 billion shortfall fail to utilize the full set of tools in the state’s toolbelt.
As a result, the governor proposes to dramatically cut safety net and health programs such as the CalWORKs family stabilization program, the Family Urgent Response System, the Indian Health Grant Program, in-home supportive services for undocumented Californians, among others. For CalWORKs alone, cuts amount to nearly three-quarters of a billion dollars — most of which are ongoing and completely eliminate essential programs designed to support families navigating domestic violence, mental health challenges, substance abuse, and other crises.
The proposed cuts, which disproportionately target foster youth, Californians with disabilities, immigrant communities, students, and families with young children, may further push many Californians into poverty, ultimately impacting their lifetime earnings, health outcomes, and more.
Closing California state prisons is a key underutilized tool that can provide the funds needed to offset these cuts. Specifically, the Legislative Analyst’s Office (LAO) estimates that California can safely close up to five prisons, given the enormous number of empty beds in the system (nearly 15,000). Closing five prisons equates to $1 billion in ongoing annual savings. This ongoing $1 billion may fund up to 13 safety net and health programs that the May Revision proposes to cut indefinitely.
While these prison closures would be rolled out across several years (up to 2028, as estimated by the LAO), creating a prison closure plan now would be a first step in imagining alternative solutions to the current cuts to critical programs. For example, state leaders could use the state’s rainy day fund to temporarily support these programs as the annual savings from closing five prisons grows to $1 billion over the next few years.
If the California budget truly reflects the state’s values and priorities, programs that support the health and well-being of Californians should be prioritized over empty prison beds.
There was a problem processing your signup. Please try again. Or contact us
Please check your email to confirm your signup.
key takeaway
California was the first state to offer paid family leave, but workers cannot apply for benefits until after they have already started their leave, causing financial hardship.
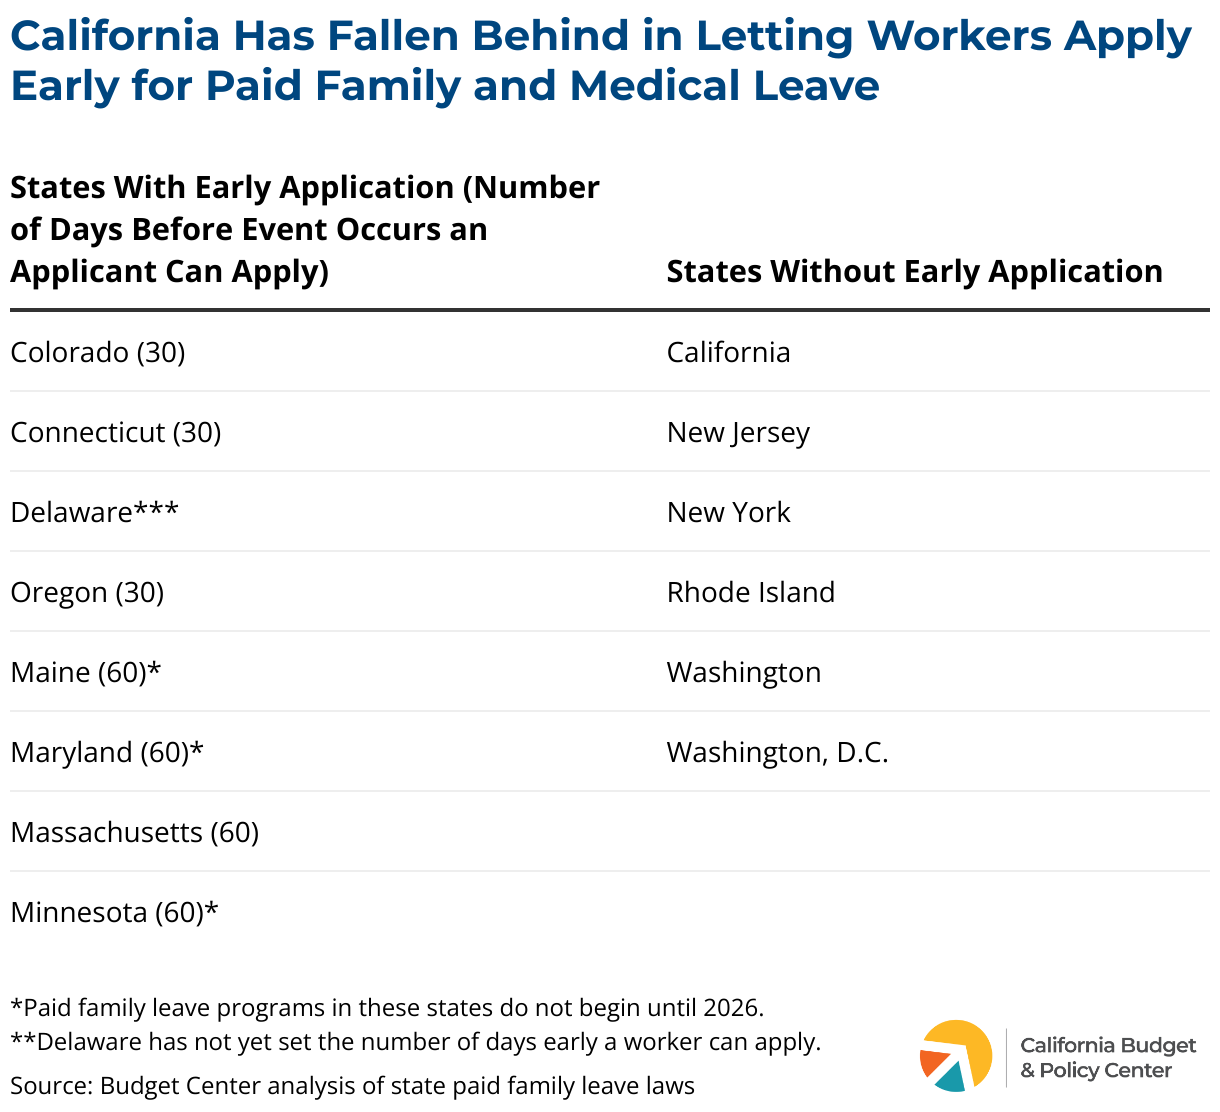
California was the first state in the country to offer paid family leave for its workers, acknowledging the importance of giving workers paid time off to care for their loved ones or bond with a new child. Since then, 12 other states and Washington, D.C. have followed California’s lead. Despite California being the first to pass paid family leave, workers in the state cannot apply for benefits until after they have already started their leave. This may put workers in a distressing financial situation while navigating care for their loved ones. By allowing workers to apply for paid family leave before their leave has begun, policymakers can better serve Californians.
How does paid family leave in California work?
Under California’s paid family leave and state disability insurance programs, workers receive partial wage replacement when they are unable to work for various reasons. Paid family leave is available to workers who are caring for a seriously ill or injured family member, bonding with a new child, or addressing a military exigency. State disability insurance is available to individuals who are unable to work due to an injury or illness. Both benefits are fully worker-funded through a payroll tax. However, a worker cannot apply for their benefits until they have first started unpaid leave and their qualifying life event has already occurred. In other words, a worker has to stop working without confirmation of if they will receive pay and benefits, and without confirmation of how much money they will get.
For example, a worker who qualifies for paid family leave because they have welcomed a new child or who qualifies for state disability insurance to recover from their own serious health condition, including pregnancy, must first take unpaid leave from their job before they can apply for paid family leave or state disability insurance. They will not know if they will get approved, they will not receive pay, and they will need to apply for benefits while at the same time welcoming their new child. This leaves workers in a precarious situation where they must go days and sometimes weeks without pay at a time when they need it most.
This is especially harmful for workers with low incomes, who are disproportionately women and people of color, who face the impossible decision of going days or weeks without pay or taking time off to care for an ill loved one or a new child. For many workers, taking time off of their job without confirmation of benefits is not an option, as workers face expenses that they cannot cover without regular income. This makes workers less likely to take leave, which can have serious consequences to their health.
What are other states doing?
Some states are leading the way in this area and have addressed this gap in policy to ensure that all workers have equal access to paid family and medical leave and no one has to face these impossible choices. Out of the 14 states and D.C. that offer paid family and medical leave, eight allow workers to apply for benefits before their qualifying event happens, meaning they are not forced to take unpaid leave without confirmation of knowing if they will receive any benefits at all. This allows workers to mitigate their risk and reduce their stress during already demanding situations.
What can state leaders do to better support workers in California?
While California was a trailblazer in 2002 when it enacted the first paid family leave law in the country, it has now fallen behind. Workers should not have to take unpaid time off when they pay into and are eligible for benefits. It is time for California to catch up and give workers the security they deserve by letting them apply early for their benefits.
There was a problem processing your signup. Please try again. Or contact us
Please check your email to confirm your signup.
key takeaway
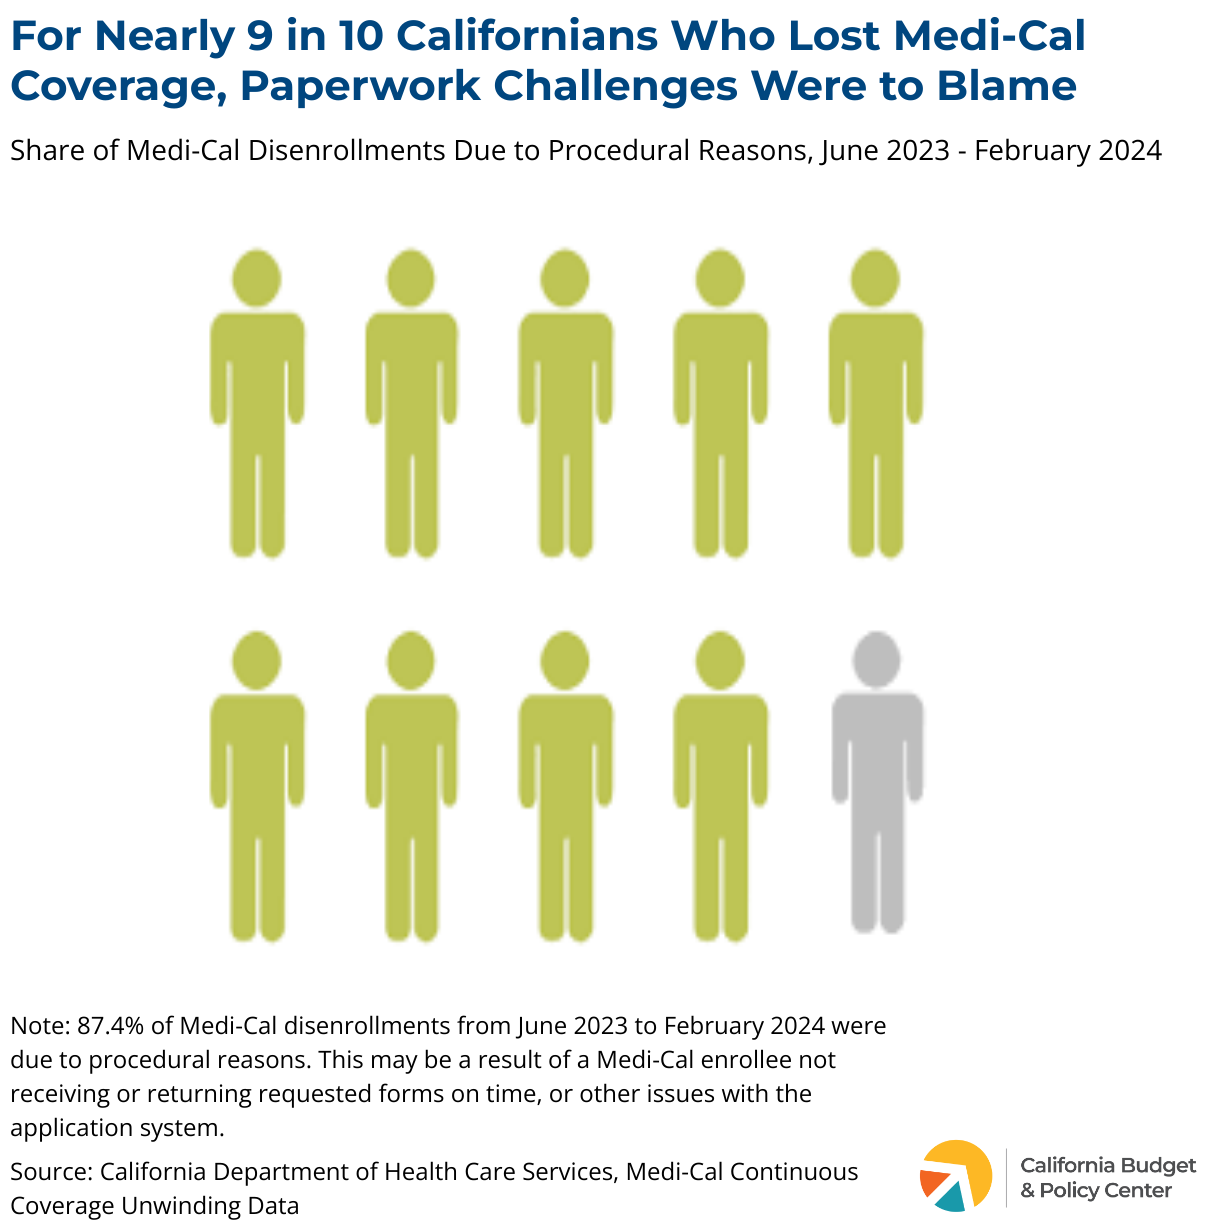
Despite being eligible, many Californians lose vital Medi-Cal coverage due to complex paperwork and difficulty reaching county offices. Streamlining the renewal process and improving accessibility are crucial to ensure everyone keeps the health insurance they need.
Continuous access to health care is necessary for everyone to be healthy and thrive. Unfortunately, paperwork challenges often prevent people from obtaining and maintaining health coverage. A clear example of this: Too many individuals continue to be disenrolled from Medi-Cal, California’s Medicaid program, due to paperwork challenges.
Last year, California began processing Medi-Cal renewals for the first time since the start of the pandemic. As a result, over 1.4 million Californians have lost Medi-Cal coverage from June 2023 to February 2024. About 9 in 10 Californians (87.4%) who lost Medi-Cal coverage during this period did so because they did not complete the renewal paperwork or had incorrect or missing information in their forms.
Completing the renewal process often involves complex paperwork and documentation requirements, which can be difficult to navigate. Additionally, many Californians have experienced extended call wait times when attempting to contact county Medi-Cal workers regarding their application.
Certain groups, including older adults and people with disabilities, are at greater risk of losing Medi-Cal coverage during the unwinding period.1Jennifer Tolbert and Meghana Ammula, 10 Things to Know About the Unwinding of the Medicaid Continuous Enrollment Provision (Kaiser Family Foundation, June 2023). Immigrants and their family members face unique obstacles in remaining covered, such as language barriers, privacy concerns, and fear of immigration-related consequences. Many Californians who are losing Medi-Cal coverage due to paperwork challenges may still meet the eligibility criteria.2Of the redeterminations that were received and processed in February 2024, about 9% were ineligible. See California Department of Health Care Services, Medi-Cal Continuous Coverage Unwinding Dashboard (February 2024), 14.
The high disenrollment rate due to paperwork challenges underscores the need to further streamline the renewal process and alleviate the paperwork burden on beneficiaries during the unwinding period and beyond. Addressing these challenges is essential to ensure that those who are eligible for Medi-Cal continue to receive vital health coverage.
While state leaders have implemented measures to reduce barriers to accessing and maintaining Medi-Cal coverage, they can take additional steps to prevent Californians who remain eligible for Medi-Cal from losing coverage. These include:
State leaders have already extended waivers and flexibilities through December 31, 2024. Making these flexibilities permanent is essential, as they have substantially helped increase automatic renewals and decrease coverage disruptions.
Improving wait times for county call centers.
For instance, state policymakers can establish regulations that set basic standards for wait times and require the state to publish call center data.
Accelerating the implementation of continuous Medi-Cal coverage for children from birth to age 5.
In 2022, policymakers passed legislation that would allow children enrolled in Medi-Cal to remain enrolled without administrative renewals. However, this policy is not slated to begin until January 2025.
Providing continuous Medi-Cal coverage to adults.
Extending continuous coverage for adults would promote consistent health care access, reduce administrative burdens, and increase economic stability for Californians.
Increasing reimbursement rates for Community Health Workers / Promotoras/ Representatives (CHWPRs).
As trusted members of the community, CHWPRs, including community-based health navigators, serve as liaisons between the community and health and social service providers in order to facilitate access to services and improve service delivery.
By taking additional action, state leaders can reduce barriers and ensure that all Californians, regardless of race, age, disability, or immigration status, can access and maintain the critical health coverage they need to be healthy and thrive.
Of the redeterminations that were received and processed in February 2024, about 9% were ineligible. See California Department of Health Care Services, Medi-Cal Continuous Coverage Unwinding Dashboard (February 2024), 14.
You may also be interested in the following resources:
There was a problem processing your signup. Please try again. Or contact us
Please check your email to confirm your signup.
key takeaway
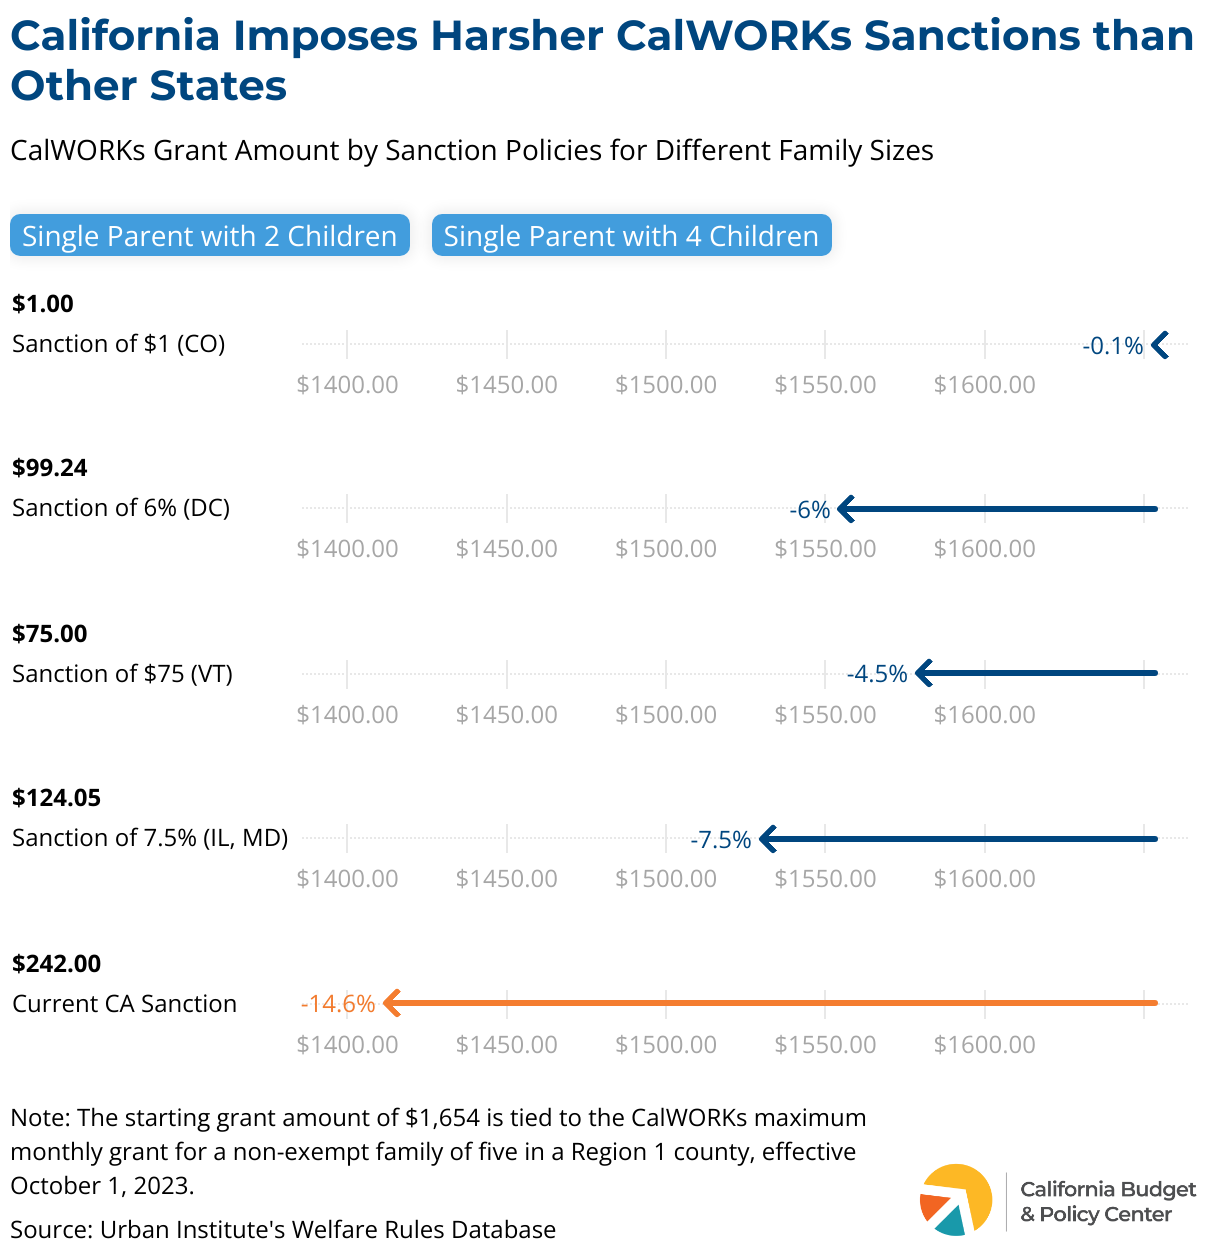
California’s CalWORKs program, while crucial for low-income families with children, penalizes them financially for not meeting work requirements. This is counterproductive as sanctioned families often face the most barriers to employment.
The California Work Opportunity and Responsibility to Kids (CalWORKs) program is a critical component of California’s safety net for families with low incomes. The program helps over 650,000 children and their families, who are predominantly people of color, with modest cash grants, employment assistance, and critical supportive services. However, the program has a problematic history of prioritizing work over family well-being, exemplified by financial penalties against families and counties that don’t meet narrowly defined performance indicators.
For many families, receiving cash assistance is conditional on engaging in employment or other specified “welfare-to-work” activities intended to lead to employment, such as on-the-job training or unpaid work experience. Additionally, families must navigate through various other paperwork-related stipulations, which further exacerbate the barriers to accessing the much-needed aid. Families who do not comply with all the requirements set forth by the state can be subject to a financial sanction that reduces their monthly cash grant.
California’s sanction policy is harsher than what is required by the federal government. The punitive approach to this safety net cash assistance is counterproductive. Research shows that sanctioned recipients are often those who face the most barriers to employment, such as limited education, learning disabilities, limited work history, physical and mental health problems, and a history of domestic violence.1Rachel Kirzner, TANF Sanctions: Their Impact on Earnings, Employment, and Health (Center for Hunger-Free Communities, Drexel University, March 23, 2015). These participants are often not aware of the financial penalties or cannot fully navigate the overly burdensome processes due to limited resources and information.
As states across the country are learning that harsh sanctions do not directly lead to gainful employment and family stability, many have reduced the amount by which cash grants are cut, recognizing that pushing families deeper into poverty only further jeopardizes their well-being. California, which is often at the vanguard of providing cash and safety net support, is unfortunately trailing significantly behind.
How do CalWORKs sanctions impact California families?
CalWORKs families cannot afford to be sanctioned. These artificial barriers put families at risk of falling deeper into poverty. Briana, a Parent Voices California advocate, experienced this reality firsthand. As a mother of four living in Contra Costa County, Briana has been on and off of CalWORKs since the age of 17. Even though her CalWORKs case manager did not help her to utilize the full scope of CalWORKs services (i.e., child care, school tuition assistance), Briana received her certified nursing assistant certification (CNA) and achieved her goal of working in the medical field, which she did for several years. A CNA certification course at Contra Costa College is approximately $322 in fees and CNA students pay over $100 in books, costs that could have been covered by CalWORKs benefits and not paid through Briana’s cash aid.
While experiencing postpartum depression following the births of her son and daughter, Briana went back on CalWORKs assistance to help make ends meet. During this time, Briana was sanctioned several times for reasons such as:
Not having an up-to-date immunization card;
Not having one of her children’s birth certificates on file;
Not turning in a check stub (despite the stub already being in the CalWORKs system);
As well as other reasons unknown to Briana.
These sanctions cost Briana hundreds of dollars, as highlighted in the preceding chart. With the $242 recouped from sanctions, every month, Briana could have paid for:
Six days of groceries for her family;
Three-quarters of her monthly utility bill;
48 gallons of gas; or
Funds to support rent and car payments.
Briana’s sanctions coupled with remaining cash aid paying for her CNA certification exacerbated her financial insecurity. At the time that Briana shared her story at a March 2024 Assembly hearing, she was $300 short on her rent and car payment and had $0 left on her EBT card.
Briana’s story is just one example of how CalWORKs sanctions perpetuate the cycle of poverty and are rooted in a racist and sexist history popularized by figures like then California Governor Ronald Reagan that punished Black and other mothers of color, in particular. In the words of Briana: “Our future generations, our grandkids, somebody down the line is gonna need help. And I just want it to be easier for them. We need to defend these programs against cuts, get rid of these unnecessary sanctions, and reimagine CalWORKs into a program that opens those doors to help us get to where we want to go.”
How can policymakers ensure families in need have access to CalWORKs?
The governor’s commitment, outlined in his January budget proposal, to apply to a federal pilot aiming to center family well-being over work requirements offers California a great opportunity to reevaluate its sanction policy. Policymakers can make a significant difference in CalWORKs families’ lives, like Briana’s, by eliminating non-federally required sanctions and minimizing the amount sanctioned families lose each month. Additionally, policymakers should continue investing in CalWORKs and protect the program from harmful cuts. CalWORKs should center the well-being of families by removing barriers instead of amplifying them.
There was a problem processing your signup. Please try again. Or contact us
Please check your email to confirm your signup.
key takeaway
While domestic and sexual violence disproportionately affects women, transgender, non-binary, and women of color, prevention programs that address root causes like gender and racial inequities can significantly improve safety for all Californians.
All Californians should be able to live in safe environments, free from violence and fear. However, millions of Californians experience domestic and sexual violence every year and women, transgender, non-binary, and women of color are most likely to experience these types of violence.
Domestic and sexual violence prevention programs are proven ways to stop violence from occurring in the first place. Prevention programs take a proactive approach and seek to shift culture on racial and gender inequities. Examples of prevention work include educating people on healthy relationships, increasing economic security for families, and reducing systems and beliefs that can lead to violence. These programs have been shown to:
Improve the safety of school and community spaces,
Lead to significant community and structural changes,
Lead to sexual violence prevention being added to school district budgets,
Make physical spaces safer in order to reduce vulnerability to sexual violence,
Increase student conversations about sexual violence as a problem,
Reduce dating abuse, and
Result in substantial cost savings due to reductions in sexual violence-related costs.
How does California support domestic and sexual violence prevention?
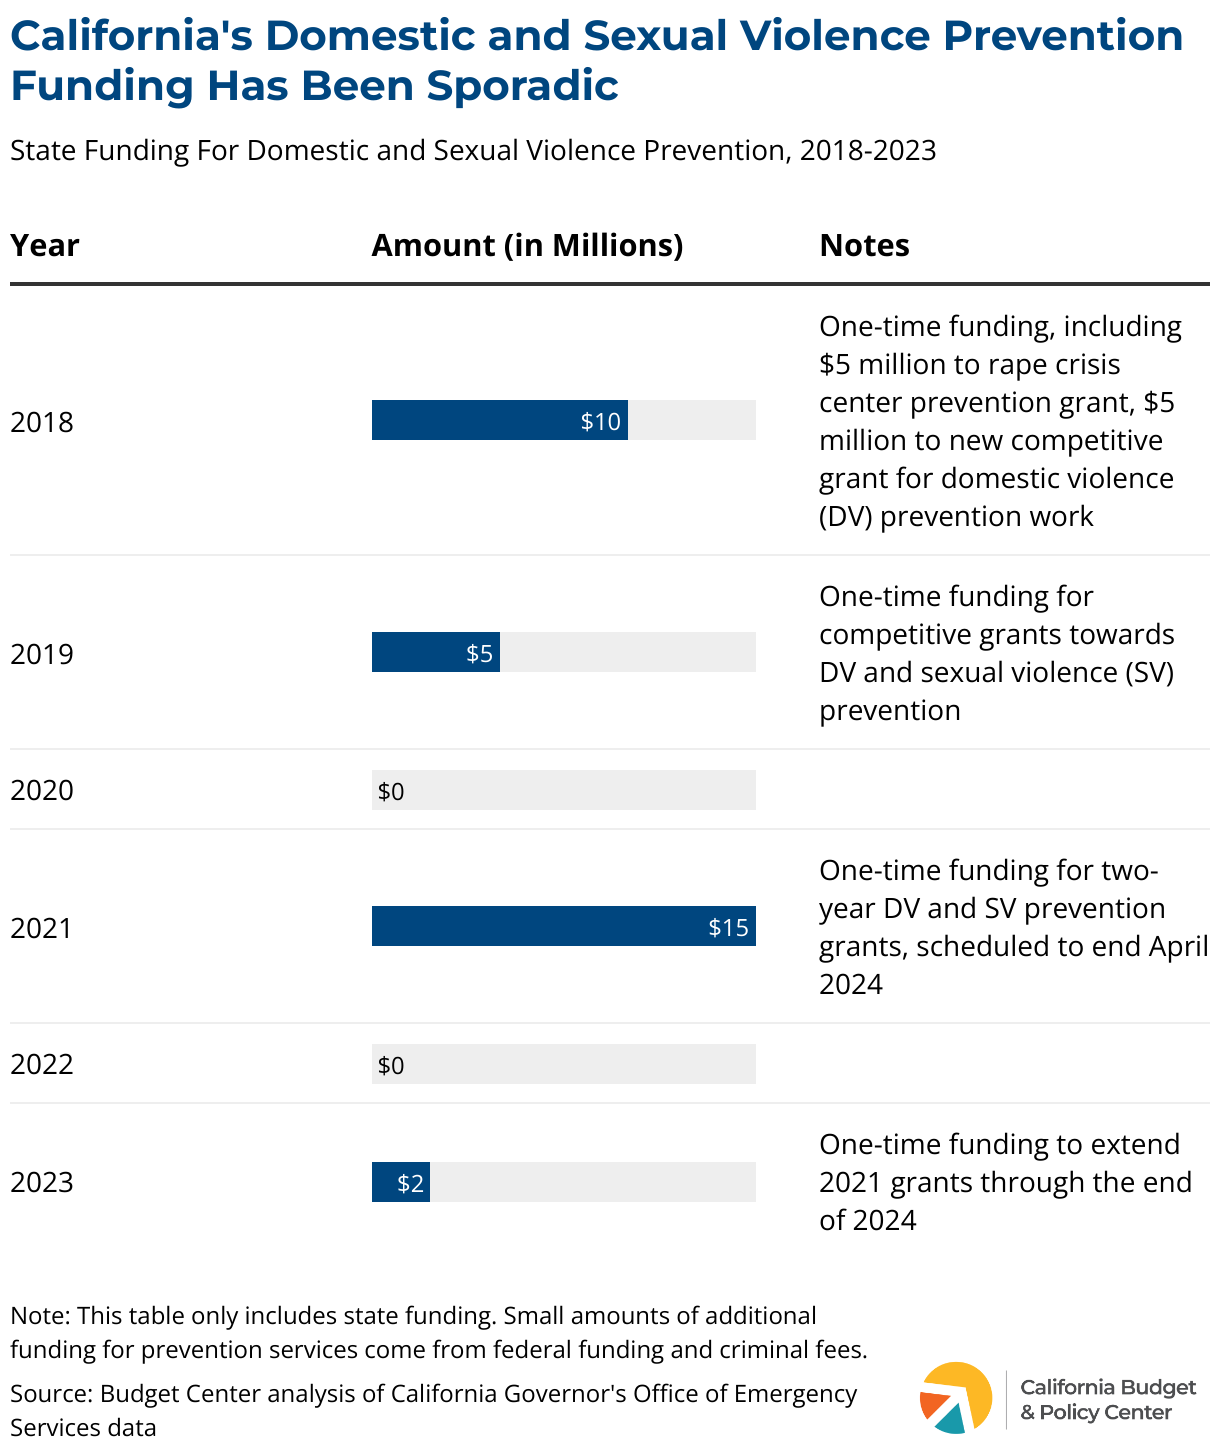
Since 2018, California has provided small, one-time grants for prevention programs. The California Governor’s Office of Emergency Services (Cal OES) administers multiple grants with this one-time funding to support prevention efforts. There are also some federal funds available for prevention, but the large majority of federal funding for addressing domestic and sexual violence is for intervention only, and in fact, is prohibited from being used for prevention efforts. Despite domestic and sexual violence prevention’s proven effectiveness, state funding is relatively new and has been sporadic.
What organizations have received state prevention funding?
Many organizations across the state have received state funding in the form of Cal OES prevention grants. These grants are focused on supporting community-based organizations in the implementation of domestic and sexual violence prevention and education initiatives, especially those that focus on serving communities that are disproportionately impacted. Examples of organizations that have been able to increase their prevention efforts because of the state funding are described below.
Korean American Family Services(KFAM)provides assistance to Korean Americans in the Greater Los Angeles area, especially women, children, and immigrants. This assistance includes mental health support, AAPI foster family and adoption services, social services, family intervention, and a gender-based violence program. They used the prevention funding to develop a culturally responsive, bilingual positive parenting program that provides education to parents on how to prevent violence from occurring in the first place.
Project Sister Family Services
Project Sister Family Servicesis a service provider to survivors of sexual violence in the San Gabriel and Inland Valleys. They provide direct services to those in crisis as well as outreach and prevention education programs. Project Sister used the prevention funding to further educate students on safe and healthy relationships by providing annual presentations and training to schools.
Rainbow Services
Rainbow Servicesprovides comprehensive survivor services in the Los Angeles area, including emergency shelter, transitional services, housing assistance, children’s education, and legal assistance. Rainbow’s prevention services focus on targeting youth, faith-based leaders, and businesses, and the prevention funding grants allow them to target those three communities and develop educational programming specific to those groups.
ACKNOWLEDGEMENT
Special thank you to Korean American Family Services, Project Sister Family Services, and Rainbow Services for providing the information included in these examples.
How has state prevention funding impacted what services organizations can provide?
Dedicated prevention funding has a meaningful impact on communities. Perspectives from these organizations demonstrate how funding has supported the services that can be provided.
Funding allowed grantees to expand existing prevention programs.
For example, while KFAM had existing outreach programs that had mixed levels of success, they were able to create a new parenting training program that was also culturally responsive to the needs of their community members.
Additionally, Project Sister described how prevention funding allowed them to build on their training and presentations with students. More specifically, the funding allowed them to develop more long-term relationships with the schools, which is crucial for breaking generational cycles of violence.
Rainbow Services shared how the funding allowed them to transform their existing outreach program into a fully-fledged prevention program.They were able to make a strategic prevention plan for the first time ever, which allowed them to grow their prevention team and increase their reach within the community.
Funding allowed grantees to connect with community members in ways they had not been able to previously.
Rainbow Services explained that with their strategic plan they were able to go beyond individualized intervention approaches and work on shifting culture.
KFAM discussed how they had previously worked for years on outreach to community leaders to tackle domestic violence, but faced challenges with the stigma associated with domestic violence. However, their new parenting training did not have as much stigma as prior outreach efforts, which allowed them to reach out and connect directly with families, offer support, and create long-term relationships to ensure that families stay free from violence.
Project Sister described how although students received the prevention training in schools, the impacts were felt beyond the students. They have seen firsthand how students take home what they learn and apply their learning to their own families to improve relationships at home.
What would happen without ongoing domestic violence prevention funding?
Each organization recognized that their important work, which supports survivors and helps prevent domestic violence, is at the peril of sporadic state funding. Organizations describe how without these grants, they would not have any prevention funding to continue sustaining these programs.
Both Project Sister and Rainbow Services explained how they are not able to do more ongoing prevention education due to a lack of ongoing funding, and that the sustainability of current programs relies on the state’s grants.
KFAMshared that the only prevention funding they have is from the Cal OES grants. Although there is much more funding provided for intervention efforts, prevention grants allowed them to be more creative with programs to prevent violence in the first place, rather than only supporting survivors afterward.
Domestic and sexual violence prevention efforts take time. These programs work on shifting culture, which takes long-term planning and commitment. However, as the organizations in the examples all noted, organizations doing this critical work cannot commit to long term programming without permanent, ongoing funding. The governor’s proposed 2024-25 budget does not include any additional funding for domestic violence prevention, which puts these programs providing critical domestic violence prevention services at risk for termination.
No Californian should live in fear over their safety. In order to adequately protect Californians from domestic and sexual violence, the state should provide ongoing, sustained funding for prevention programs that can help stop the violence before it starts.
There was a problem processing your signup. Please try again. Or contact us
Please check your email to confirm your signup.
key takeaway
California has a significant unmet need for affordable child care, with only a fraction of eligible children receiving subsidized care. The state needs to make significant and sustainable investments in expanding subsidized child care options, particularly for infants and toddlers.
Affordable child care is critical for supporting California’s families to grow and thrive. Within California’s mixed delivery system, the California Department of Social Services (CDSS) provides child care programs at low- to no-cost for families with low incomes. For far too long, the demand for subsidized child care has outpaced supply. Specifically:
In 2015, 85% of children eligible for subsidized child care did not receive services.
In 2017, 89%of children eligible for subsidized child care did not receive services.
An analysis of 2022 data shows an unfortunate continuation of this trend, underscoring the need for a larger supply of subsidized child care spaces in California.
Child Care and Development Transition
This analysis only includes child care programs within CDSS. The 2020-21 Budget Act transferred the child care and development programs from the California Department of Education (CDE) to CDSS. This transfer was intended to support a more integrated and coordinated system of care that could more effectively serve children, families, and the workforce. Thus, as of July 1, 2021, CDE only maintained oversight of two early learning programs: 1) The California State Preschool Program (CSPP); and 2) Transitional Kindergarten (TK) — both of which are now a part of CDE’s “Universal Pre-K” system. Previous Budget Center analyses of unmet need included CSPP. However, given the transition of programs from CDE to CDSS and related changes to eligibility requirements and other aspects of these programs, this analysis does not include CSPP. A forthcoming publication will explore eligibility and enrollment specific to CSPP.
What is the unmet need for child care?
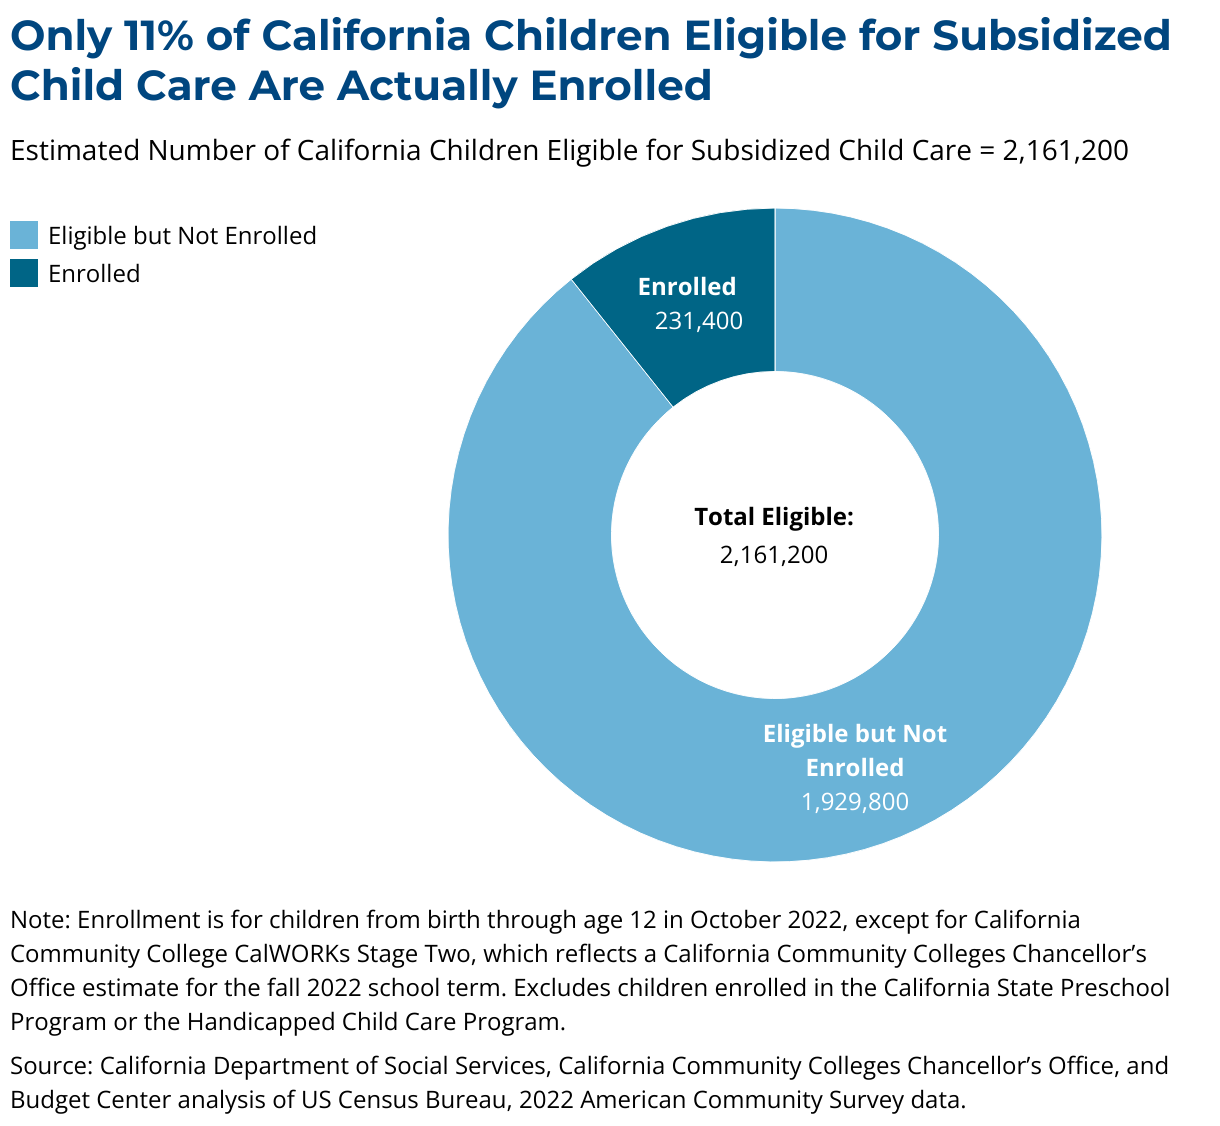
In 2022, only one in nine of California’s children eligible for child care actually received services. The number of children eligible for subsidized child care has grown from 1,479,000 in 2015 to 2,161,000 in 2022. While the number of new subsidized child care spaces has increased — notably, 146,000 new spaces were added since 2021-22 — the number of new slots has not kept pace with the growing demand. The chart below provides a visual of the unmet need for child care in California.
What are the implications of failing to meet California’s child care needs?
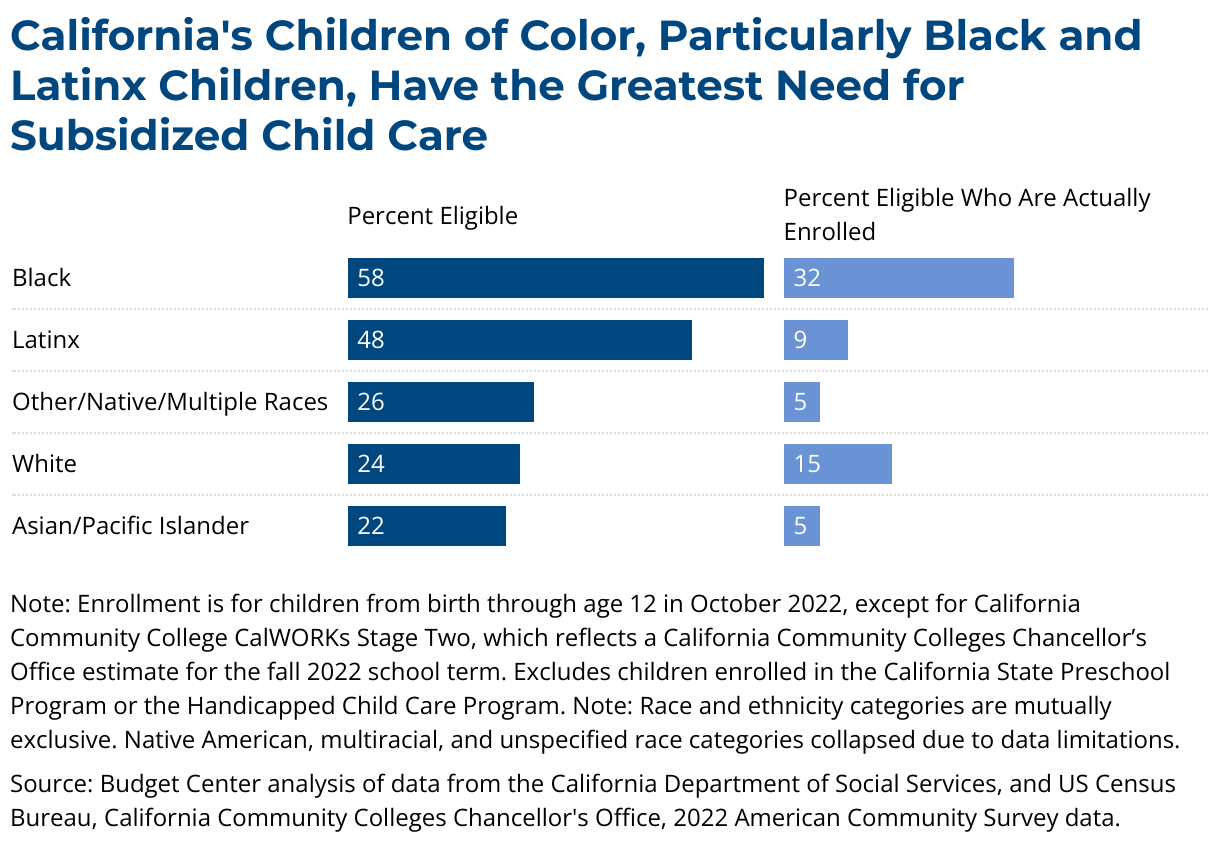
Failure to adequately address the unmet need for child care disproportionately impacts families and children of color.
Key Implication #2
Expanding the supply of infant and toddler care is particularly critical.
Families of color in California have historically been denied access to key services and opportunities. These inequities continue to negatively impact Californians of color as recent analyses have shown that poverty rates nearly doubledfor Black and Latinx adults in California from 2021 to 2022. Moreover, Californians of color are more likely to struggle with paying for basic expenses.
The chart belowshows that children of color are disproportionately eligible for subsidized child care. As the demand for subsidized child care continues to far outpace supply, families of color are most impacted by this insufficient supply. Therefore, the lack of subsidized child care continues to exacerbate the historical and unjust inequities that impact Californians of color.
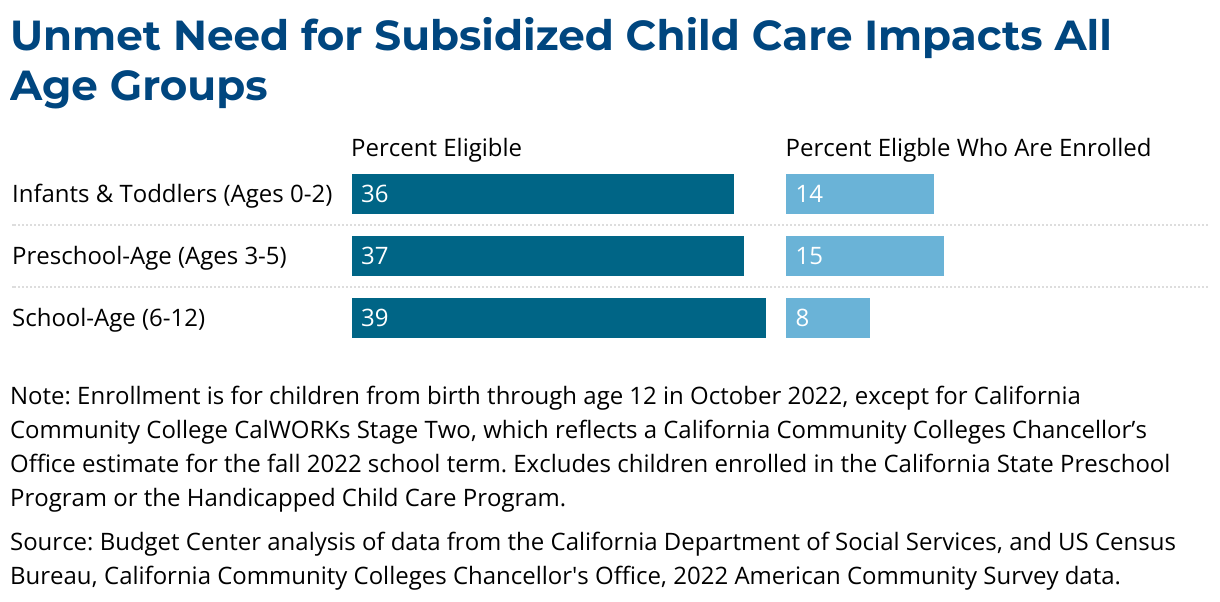
CDSS’s child care and development programs serve ages zero to twelve. Within this age range, the cost of providing care is the highest for infants and toddlers; yet, providers that serve infants and toddlers typically make less money. Given this context, as well as the potential impacts ofTK expansion on the mixed delivery system, there is concern around a diminishing supply of infant and toddler care options.
The chartbelow shows that across all age groups, only a fraction of those eligible for care are actually enrolled. However, children ages 0-2 are the only age group that is solely served by CDSS’s child care programs (other age groups have access to programs hosted by CDE). Thus, the unmet need for child care is particularly acute for infants and toddlers and failure to expand subsidized child care may disproportionately impact this age group. While school-age children have access to alternatives, it's important to note that the unmet needs stretch beyond infants and toddlers.
How can policymakers address the unmet need for child care?
While the supply of subsidized child care has increased since the dramatic cuts made during the Great Recession, California is still a long ways away from meeting families’ child care needs. Specifically, to help address the unmet need for child care, the 2021-22 enacted budget set a goal of adding 200,000 new child care slots. While 146,000 of these slots have been funded, slot expansion has been delayed for the last two fiscal years. The governor maintains his commitment to fund all 200,000 slots by 2026-27; however, the timeline for funding the remaining 54,000 slots by the deadline remains unclear.
The administration can increase the number of new slots in the 2024-25 budget to make immediate and needed progress on addressing the unmet need for child care. The unmet need for child care in California is an issue that requires state leaders' attention regardless of the cyclical ups and downs of the state budget. State leaders should make significant and sustainable investments in increasing access to affordable child care that meets families’ needs. Failure to do so keeps thousands of families — mainly families of color — on child care waiting lists, hampering their economic mobility and ability to find nurturing care for their children.
There was a problem processing your signup. Please try again. Or contact us
Please check your email to confirm your signup.
key takeaway
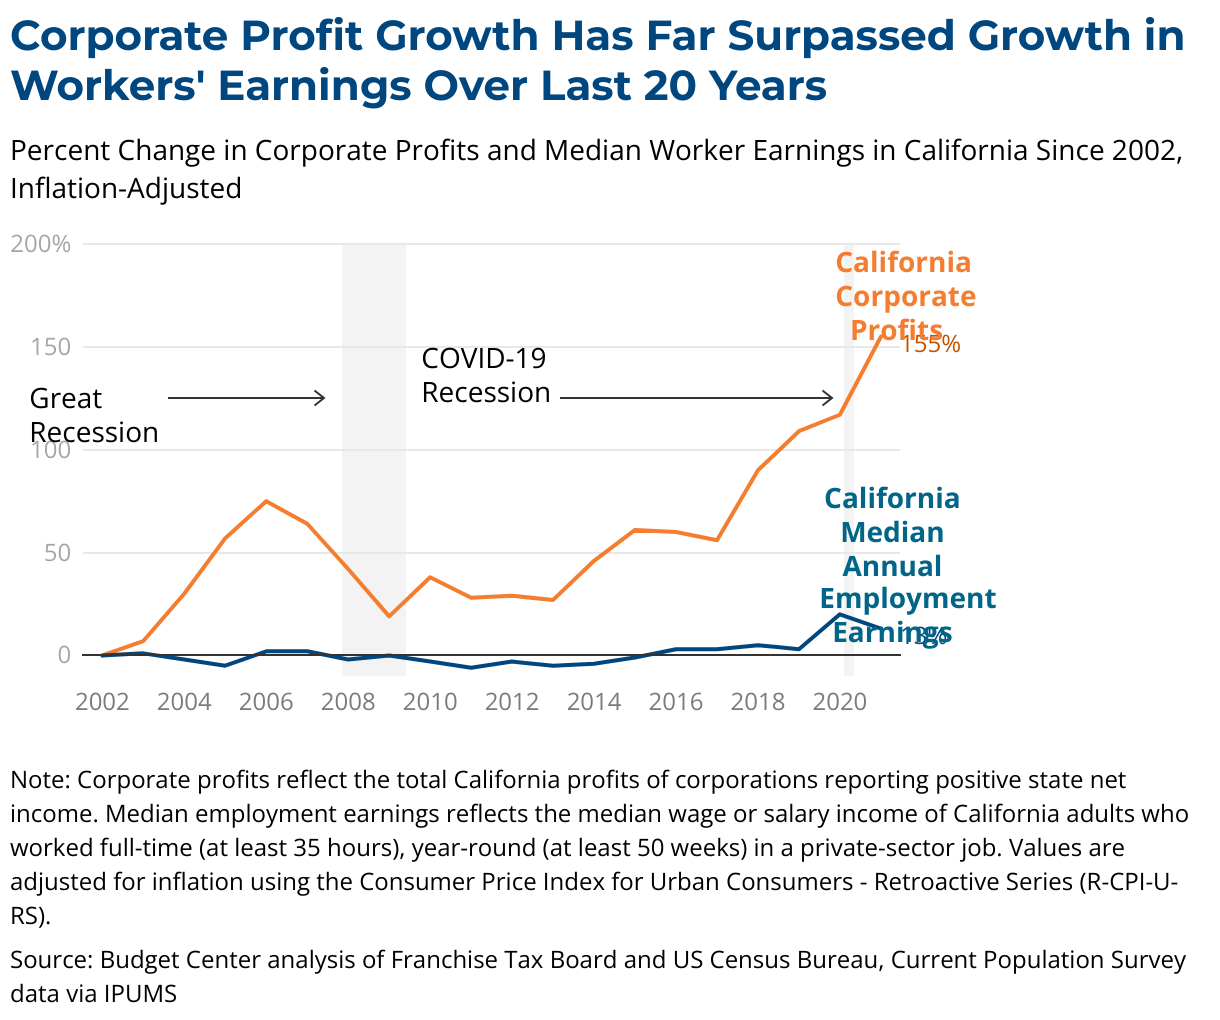
California corporate profits reached a record-breaking $368 billion in 2021, but they pay just about half of what they did in the early 1980s in state taxes as a share of those profits. Building a tax system that is more fair will help Californians — whose wages have not kept pace with inflation or record profits — make ends meet.
All Californians should have the means to keep food on the table and a roof over their heads, and to invest in education and advancement for themselves and their families. California’s businesses have a role to play in achieving this vision, both in providing well-paying jobs and in contributing their fair share to state revenues to support public services — including a safety net for people during times of unemployment, disability, or when time is needed to care for family. However, while corporations have seen skyrocketing profits in recent years, the typical California worker’s earnings have barely kept up with inflation.
California corporate profits reached $368 billion in 2021, reflecting a 155% increase since 2002 in inflation-adjusted terms. In contrast, a typical California full-time, year-round worker only saw their employment earnings increase by 13% during that time period after accounting for inflation.1The higher median wage growth seen in 2020 and 2021 was likely due in part to a change in the composition of the workforce. Because lower-paid workers disproportionately lost their jobs during the first two years of the pandemic, the remaining workforce was relatively higher paid. Nationally, this composition effect had mostly subsided by 2022. Indeed, inflation-adjusted median employment earnings growth in California from 2002 to 2022 was only 8%. This figure is not shown in the chart because comparable data on corporate profits for 2022 is not yet available.
“
Large highly profitable corporations can afford to contribute their fair share in taxes.
”
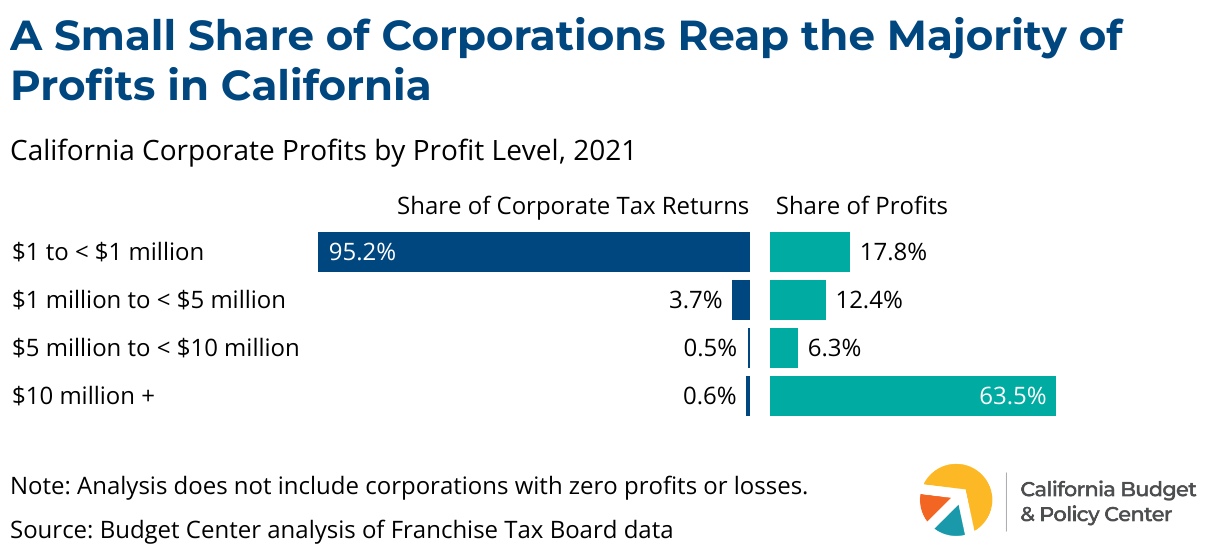
Corporate profits are highly concentrated among a small group of very profitable corporations. For example, less than 1 out of every 100 corporations (just 0.6%) made $10 million or more in annual profits in California in 2021. However, this small share of corporations accounted for more than 60% of corporate profits statewide.
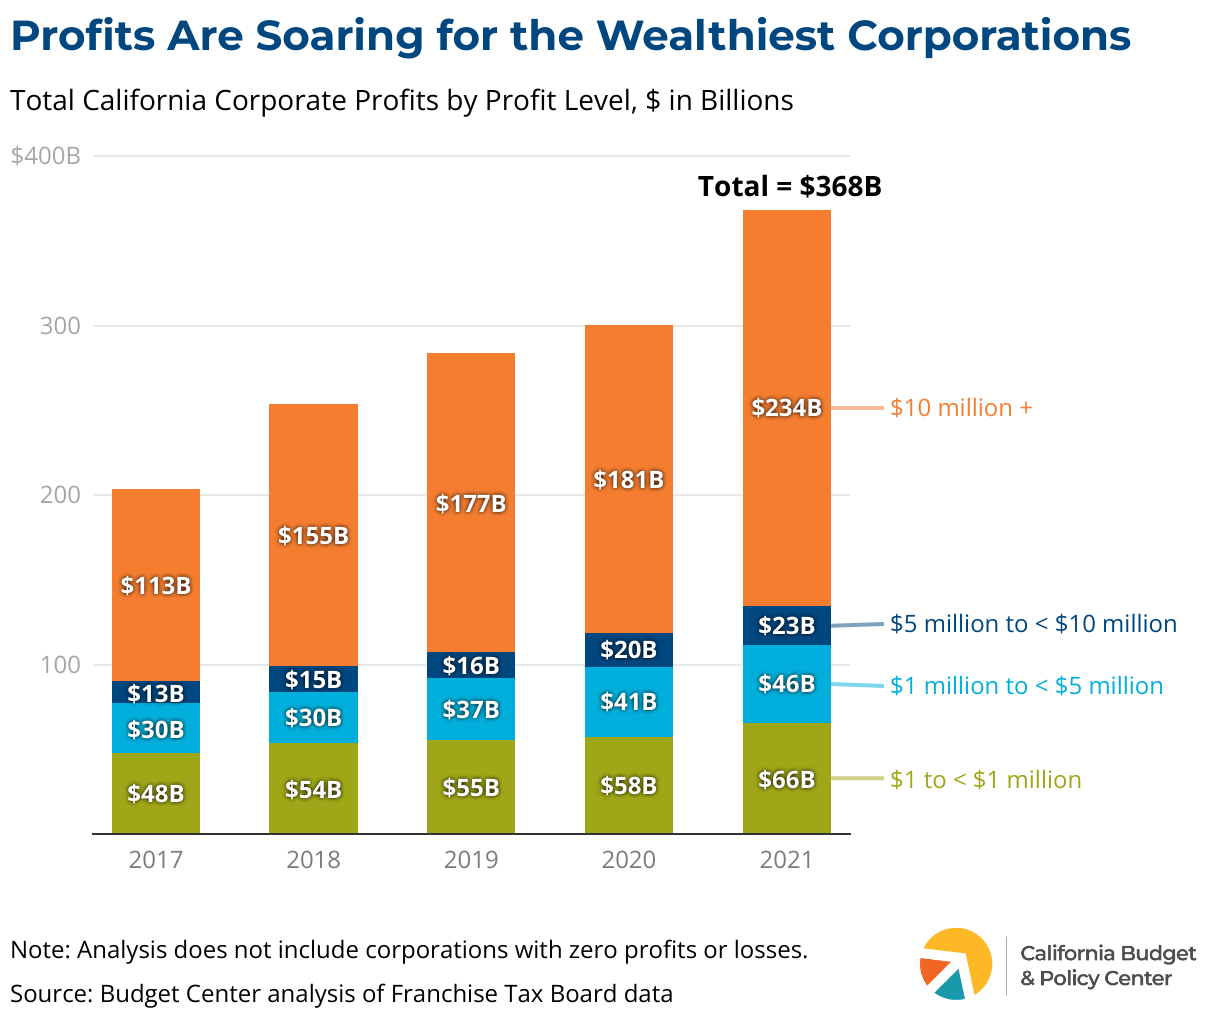
Those corporations with profits of at least $10 million saw their state profits more than double from $113 billion to $234 billion between 2017 and 2021. Corporations with profits of $5 million to $10 million also saw a near-doubling of their profits during that same period. At the same time that profitable corporations were doing exceedingly well, many Californians — particularly those with low incomes and Black, Latinx, Pacific Islander, and other Californians of color — suffered the devastating health and economic consequences of COVID-19, and continue to struggle with the high costs of necessities. Californians have seen their purchasing power fall with rising prices in recent years, a phenomenon which someresearcherssuggest has been amplified by corporations keeping prices high even as their costs declined and their profit margins increased.
Existing Tax Policy Exacerbates Inequities
Recent research shows that federal and state tax systems actually reinforce the concentration of profits among a small share of large corporations. In other words, after-tax profits are even more concentrated at the top than pre-tax profits. For example, the largest 10% of US public non-financial corporations held 95% of domestic corporate profits before federal and state taxes, but 99% of profits after taxes, according to analysis by the Roosevelt Institute. This is not surprising considering that some of the biggest corporate tax breaks provide disproportionate advantages to large and multinational corporations, and these corporations can afford to hire expensive accountants and lawyers to help them game federal and state tax systems.
More equitable state taxation of corporations would counteract the outsized advantage of corporations with the most market power and raise needed state revenues for critical public services to benefit California’s communities. It could also increase racial and economic equity in the state, since corporate profits flow to corporate stockholders, who are disproportionately white and wealthy. The equity impacts would be even greater if the revenues raised were used to support Californians who have been economically disadvantaged by racism and discrimination.
Requiring immensely profitable corporations to contribute more to supporting state services and combating corporate tax avoidance would level the playing field among businesses and help create a more equitable state for Californians.
The higher median wage growth seen in 2020 and 2021 was likely due in part to a change in the composition of the workforce. Because lower-paid workers disproportionately lost their jobs during the first two years of the pandemic, the remaining workforce was relatively higher paid. Nationally, this composition effect had mostly subsided by 2022. Indeed, inflation-adjusted median employment earnings growth in California from 2002 to 2022 was only 8%. This figure is not shown in the chart because comparable data on corporate profits for 2022 is not yet available.
You may also be interested in the following resources:
There was a problem processing your signup. Please try again. Or contact us
Please check your email to confirm your signup.
This website uses cookies to analyze site traffic and to allow users to complete forms on the site. The California Budget & Policy Center does not share, trade, sell, or otherwise disclose personal information. By using our website you agree to our Privacy Policy.