SACRAMENTO, CA — A new fact sheet released today by the California Budget & Policy Center (Budget Center) reveals shocking numbers that nearly 744,000 young adults ages 18 to 24 in California are living in poverty — representing almost one in four young Californians. The data paints a troubling picture of the economic hardships young … Continued
key takeaway
Young adults across California face higher-than-average poverty and deep poverty rates as they transition into adulthood, underscoring the need to strengthen core basic needs programs and investments that help young Californians achieve economic stability and meet their basic needs.
Young adulthood is a crucial time to establish independence and start to build financial stability, both of which are pivotal to laying the foundation for a successful future. However, this can be difficult to do while experiencing food insecurity, housing instability, and poverty, as almost 744,000 young adults across California do.
Newly released data based on the California Poverty Measure (CPM) show that 23% — almost one-fourth — of young adults ages 18–24 are living in poverty, with 7.6% experiencing deep poverty. These rates outpace other age groups and are well above the average poverty and deep poverty rates for all Californians — 16% and 4.4%, respectively. This exposes a critical gap in access to economic stability and anti-poverty programs for young Californians.
How are poverty and deep poverty defined here?
The California Poverty Measure (CPM) compares a family’s economic resources to a poverty threshold that represents the minimum level of resources a family needs to achieve a modest standard of living within a California-specific context. Individuals experiencing deep poverty are those whose resources are less than 50% of the CPM poverty threshold.
Young Adults Encounter Many Barriers to Achieving Economic Stability
Economic instability is especially common among young adults as they make the transition into adulthood, a period when young people make key decisions about their next steps in education, work, and independence. Some enter the workforce for the first time, often taking on entry-level or low-wage jobs as they begin to build experience. Others pursue higher education or training, navigating rising costs, student housing shortages, and limited basic needs assistance while enrolled. Across these trajectories, higher-than-average unemployment rates, increased likelihood of working in low-wage occupations, and varied levels of family and community support contribute to the uncertain economic situation in which many young adults find themselves.
These challenges are especially pronounced for certain communities, including Black and Latinx young people who are more likely to face structural barriers to employment, and LGBTQ+ youth who are more likely to experience homelessness. Programs like CalFresh, Medi-Cal, and subsidized housing can play a crucial role in alleviating some of these struggles for young adults experiencing poverty and help ensure they have the tools to build a successful life.
However, CPM data show that while basic supports reduce poverty among young adults, the impact is not as pronounced as with other age groups. This may point to young adults being less consistently served by core basic needs programs, which often prioritize families with children, older adults, and people with disabilities.
The barriers to basic needs programs, lack of state investment, and challenging economic circumstances increase the likelihood of economic instability and may result in even higher poverty rates for young Californians.
Policy Recommendations to Help Alleviate Poverty
Meaningfully addressing poverty among young adults is already a complex task, and the adverse policy changes mentioned above will only make it harder. Some policies that could help ensure poverty rates don’t increase further while bolstering the state’s anti-poverty programs in the face of H.R. 1 include:
Strengthening access to core benefits: Invest in county capacity for streamlined, comprehensive intake to help eligible young adults maintain Medi-Cal and CalFresh despite increased federal barriers.
Restoring inclusive coverage: Reverse the state enrollment freeze for undocumented adults and eliminate the added premium to ensure equitable access to health care.
Addressing housing instability: Provide sustained Homeless Housing, Assistance and Prevention (HHAP) grant funding so counties can expand proven, flexible homelessness prevention and response strategies, in addition to replenishing depleting bond dollars to support investments in affordable housing.
In order to meaningfully address high rates of poverty for all Californians in the long run, the state will have to raise significant, ongoing revenue, beginning by eliminating costly corporate tax breaks that cost California billions of dollars in forgone revenue each year, which could be used to support Californians struggling to make ends meet. More broadly, California should strengthen its tax base so that people with high incomes and wealth contribute fairly to the public investments needed to improve the lives of all Californians.
By strengthening the core programs that young adults depend on, California leaders can help mitigate rising poverty and increase young adults’ access to basic needs. In turn, young adults can have a better chance to pursue their educational, professional, and personal aspirations.
SACRAMENTO, CA — The California Budget & Policy Center (Budget Center) and Asian Americans and Pacific Islanders for Civic Empowerment Education Fund (AAPI FORCE-EF), released a new report — Federal and State Budget Decisions Threaten AANHPI Women in California — finding that recent federal and state budget decisions threaten to undermine the health, economic mobility, … Continued
key takeaway
AANHPI women’s experiences vary widely across ethnicities, making disaggregated data essential to understanding the impacts of recent federal and state decisions. By examining the Women’s Well-Being Index indicators across multiple AANHPI ethnicities, this report highlights distinct challenges facing AANHPI women in California and identifies key steps state and local leaders can take to advance equity and well-being.
Recent federal and state budget cuts threaten to undermine the health and well-being of Californians, including those with AANHPI identities. The 2024 Women’s Well-Being Index (WWBI) points to long-standing disparities between men and women in California, suggesting that women — especially those facing intersecting barriers shaped by race, income, and immigration status — will face even greater hardship as a result of harmful budget actions.
AAPI ForCE-EF is a statewide network that builds progressive Asian American and Pacific Islander governing power in California through campaign organizing, policy advocacy, integrated voter engagement, and narrative change.
Asian Americans, Pacific Islanders, and Native Hawaiians (AANHPI) have a rich history in California and reflect a wide variety of backgrounds and experiences with over 50 ethnic groups. However, data collection using the “umbrella label” of AANHPI often homogenizes this diversity into a misleading single story about the experiences of AANHPIs. Aggregated data perpetuates the model minority myth and hides the struggle of working-class AANHPIs by obscuring differences between subgroups. Given the unique experiences among AANHPI ethnicities, to meaningfully understand the impact of recent federal decisions, it is paramount to understand unique impacts for individual identities within the AANHPI umbrella. Moreover, state leaders’ current response to federal actions further jeopardizes the well-being of AANHPI Californians. AANHPI women in California therefore face the compounding factors of federal threats and state inaction.
This report takes the Women’s Well-Being Index one step further by exploring key indicators of well-being across multiple AANHPI ethnicities to understand how recent federal and state decisions may influence this California population (see Technical Appendix for more information about the ethnicities reflected in this report). This report also highlights key steps that state and local leaders can take to address pressing challenges among AANHPI women and the several organizations that are leading the way.
How might recent federal and state action impact AANHPI Californians?
The harmful Republican megabill (referred to as H.R. 1), passed in the summer of 2025, includes historic cuts to health care and food assistance to fund tax breaks for the well-off. These cuts fall particularly hard on immigrants, with several of the most vulnerable classes of legally documented immigrants — like refugees, asylees, humanitarian parolees, and trafficking survivors — losing access to care.
Around a third of the California state budget comes from federal funding, and a projected multi-year budget deficit means the state — without bold action — may be unable to backfill some or all of these cuts. Rather than pursuing revenue solutions, the state has instead balanced its budget on the backs of its most vulnerable residents.
Immigrant Californians, many of whom are AANHPI, have borne the brunt of cuts to the social safety net in the state budget. The 2025-26 state budget included an enrollment freeze for undocumented Californians in Medi-Cal, a cut to dental benefits for certain groups of immigrants, and the introduction of unaffordable premiums for certain groups of immigrants.
The impacts of H.R. 1 and state budget policies stand to exacerbate the economic security challenges AANHPI women already face. Importantly, different AANHPI ethnicities face distinct challenges in health, economic mobility, and economic security, and policy approaches must account for these disparities.
Native Hawaiian and Pacific Islander Women Face Barriers to Accessing Quality, Affordable Health Care
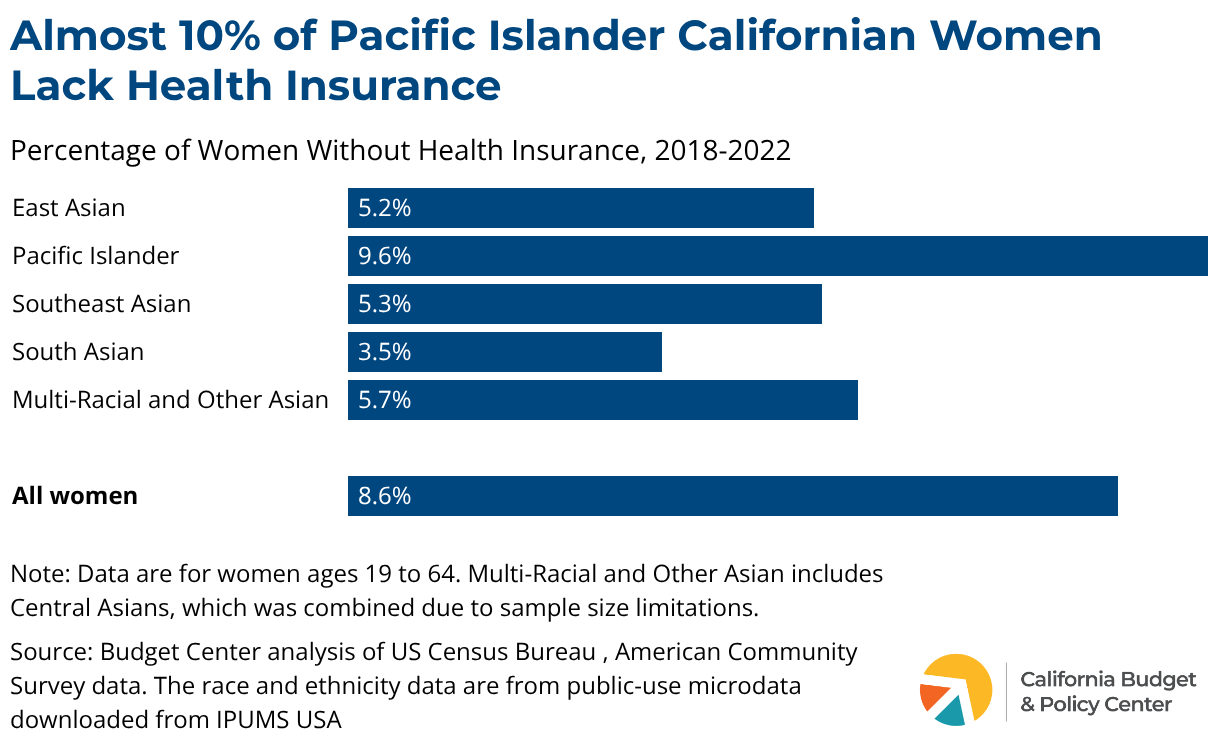
Affordable, accessible health care is critical for all Californians to be healthy and thrive. Health insurance helps lower out-of-pocket expenses and ensures access to preventive care, which in turn supports workforce participation and education. While California has made historic progress towards lowering the rate of people without health insurance, significant racial disparities persist. As seen in the chart below, access to health care differs among AANHPI women, Native Hawaiian and Pacific Islander women in particular.
The Central Valley Pacific Islander Alliance (CVPIA) is an organization dedicated to service, cultural work, civic engagement, and advocacy for NHPIs across eleven counties in California’s Central Valley. Founded in 2021 by eight NHPI volunteers responding to urgent community needs during the COVID-19 pandemic, CVPIA hosted the region’s first NHPI vaccine site, where about 150 community members were vaccinated and received resources for groceries. CVPIA continues to offer critical NHPI resource navigation surrounding leadership development for youth and young adults, higher education, employment, support for elders, and community access to housing, Calfresh, and health insurance.
Racial disparities in health coverage highlight the enduring impact of racism, which blocks Californians of color from equal access to health care. Addressing the racial disparities in health coverage requires targeted outreach and education efforts along with other antiracist policy actions to improve health and well-being for Californians of color.
However, federal budget cuts from H.R. 1 and state budget cuts restrict access to health care for many Californians, particularly for immigrants and other low-income Californians. Stricter federal restrictions on who is eligible for Medicaid, new burdensome reporting requirements, more frequent eligibility checks, and state Medi-Cal premiums for certain groups of immigrants all jeopardize health care access for Californians, including AANHPI women who are more likely to be immigrants.
As a result of state and federal cuts, we estimate:
Nearly 300,000 employed Asian American and 16,000 employed Pacific Islander adults ages 26-64 in California will be at risk of losing Medi-Cal due to monthly premiums and burdensome recertification requirements
Nearly 50,000 unemployed Asian American adults ages 26-64 and 4,000 Pacific Islander unemployed adults on Medi-Cal are at risk of losing coverage due to work requirements1Steven Ruggles, Sarah Flood, Matthew Sobek, Daniel Backman, Grace Cooper, Julia A. Rivera Drew, Stephanie Richards, Renae Rogers, Jonathan Schroeder, and Kari C.W. Williams. IPUMS USA: Version 16.0. 2019-2023, ACS 5-year. Minneapolis, MN: IPUMS, 2025. Analysis by Cevadne Lee, OCAPICA.
Together, these cuts will likely worsen existing health disparities, especially for Pacific Islander women.
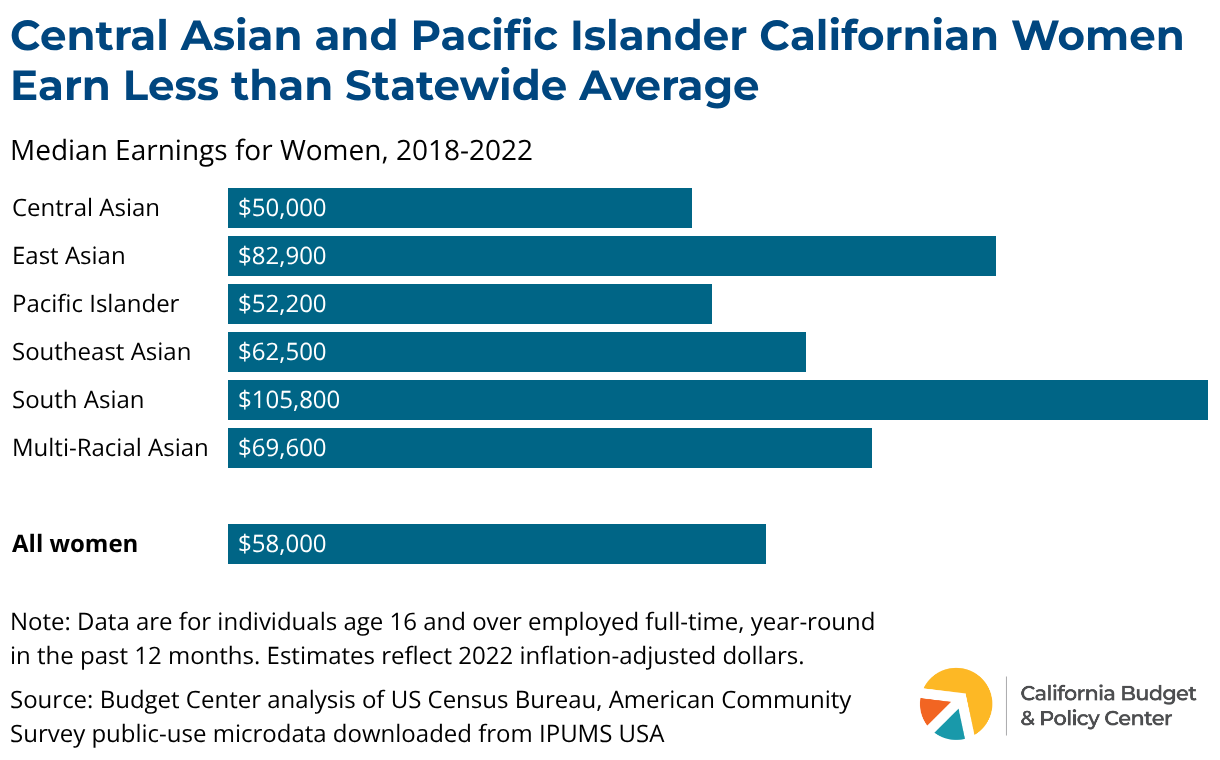
Central Asian and Pacific Islander Women Face Significant Barriers to Economic Mobility
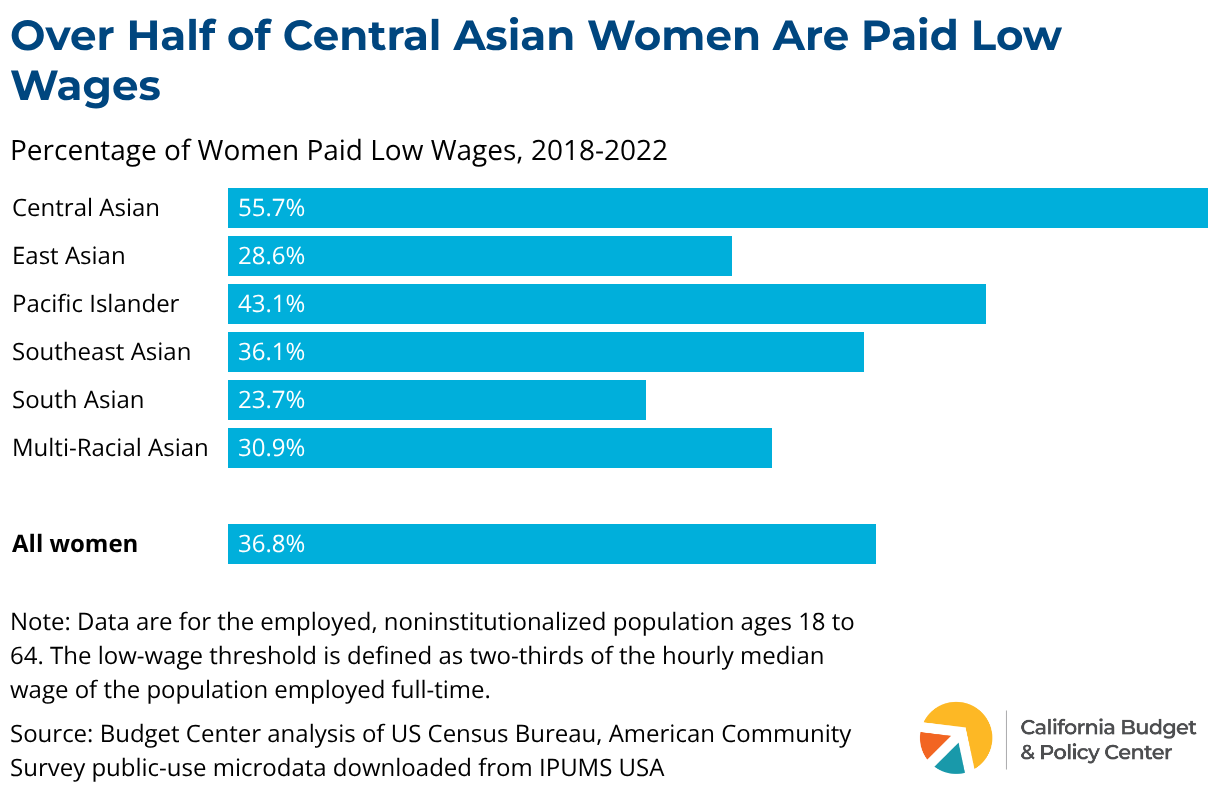
Over half (55.7%) of Central Asian women and over 40% (43.1%) of Pacific Islander women are paid low wages. These are both significantly higher than the statewide average, where roughly 37% of women in California are paid low wages. AANHPI women are overrepresented in low-wage work and in service jobs that typically earn much less than white men, such as home care workers and nail salon workers. This concentration in low-wage work widens the wage gap between AANHPI women and white men, as shown in the following chart.
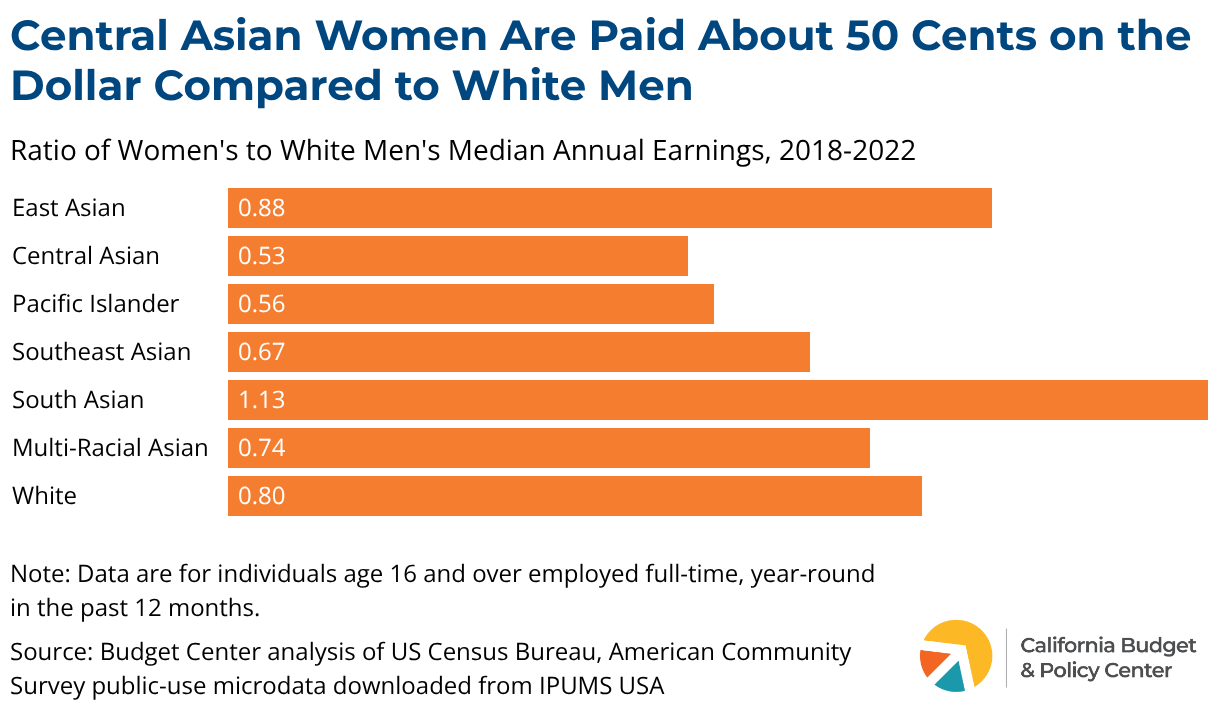
Central Asian women are paid only $0.53 for every $1 white men are paid, and Pacific Islander women earn only $0.56. AANHPI women are over-represented in low-wage work and underrepresented in higher-paying jobs. Even when AANHPI women can access higher-paying jobs, the earnings gap persists.
Occupational Segregation Pushes AANHPI Women into Low-Wage Service Jobs That Limit Economic Mobility and Fair Pay
Occupational segregation pushes many AANHPI women into low-wage service jobs. Many AANHIPI women — especially those who are undocumented — are relegated to jobs where they are easily exploited, that lack labor protections, and have limited pathways to upward economic mobility.
Service-based occupations have been shown to have the largest wage gaps, demonstrating the larger disparity for AANHPI women.
Native Hawaiian and Pacific Islander women are more likely to work as personal care aids, waitresses, and cashiers, working long hours for low wages.
In California, AANHPI women make up the largest share of nail salon and personal care workers. In addition to health and safety risks — particularly exposure to chemicals in cosmetics products linked to reproductive harm, respiratory issues, and cancer — this predominantly Vietnamese refugee women workforce face ongoing wage and hour labor violations, including pay below the minimum wage and misclassification as independent contractors.
The California Healthy Nail Salon Collaborative (CHNSC) — a statewide grassroots organization that addresses health, environmental, reproductive justice, and labor issues faced by its low-income, female, Vietnamese immigrant and refugee workforce — has made notable strides to protect the nail salon workforce. In the state legislature they championed bills like AB 647 (Kalra, 2019) requiring manufacturers to post Safety Data Sheets for cosmetics and disinfectants on their websites in Spanish, Vietnamese, Korean, and Chinese; AB 2762 (Muratsuchi, Wicks, & Quirk, 2020) banning 24 commonly used toxic chemicals in cosmetic products; and HR 5540 (Schakowsky & Blunt-Rochester, 2022) requiring product ingredient disclosure and translated Safety Data Sheets access, and research grants to develop safer alternatives to chemicals of concern.
High Poverty and Housing Costs Threaten Economic Security for AANHPI Women
Different AANHPI ethnicities face distinct poverty challenges. Namely, East Asian and Pacific Islander women have relatively higher poverty rates, and East Asian women have a significantly higher poverty rate as compared with all women. While there are many reasons contributing to poverty among AANHPI women in California, affordability challenges are paramount.
Central to affordability challenges is the high cost of housing in California. As shown in the chart below, women in California spend approximately 38% of their income on rent and are thus rent burdened. Rent burden is even more extreme for some AANHPI women.
Key points specific to AANHPI women include:
Most AANHPI ethnicities are rent burdened. Most AANHPI ethnicities spend over 30% of their income on rent. Housing affordability is therefore a central issue for AANHPI women when it comes to meeting basic needs. H.R. 1 will further strain AANHPI women’s budgets, exacerbating the high cost of housing challenges these women already face.
Rent burden estimates are likely underestimated.Housing overcrowding is a known issue among some AANHPI communities. More specifically, many AANHPI women live in housing that is considered ‘overcrowded’ in order to reduce rent burden and other housing costs. Overcrowding can result in negative outcomes, including increased exposure to environmental hazards, lower educational outcomes, poor physical health, and mental health challenges.
AANHPI women are less likely to seek support for precarious housing situations. As shared in the University of California, Los Angeles AANHPI Housing Report, one Orange County community leader described this situation as follows: “The other thing [AANHPI Californians] don’t use is free and reduced lunch, and they don’t use the McKinney-Vento Act to get additional resources for their kids because they’re worried. They’re worried the authorities will say they’re not taking care of their kids and take them away.” As a result, AANHPI women and families are less likely to see and utilize available services to address rent burden, even if they are available.
Overall, state and federal cuts will negatively impact affordability challenges for all Californians, including AANHPI women. State leaders should work to mitigate the harm of these cuts to all Californians and collaborate with their AANHPI constituents to ensure policy solutions are responsive to the unique needs of AANHPI women.
What can state leaders do to help mitigate the potential impacts from federal actions?
California’s state leaders can make budget and policy choices that actively address federal actions that will harm AANHPI women. State leaders should pursue revenue solutions to invest in vital programs and services that mitigate the harm caused by federal actions to AANHPI women and all vulnerable Californians. For example, state leaders can focus on ensuring that corporations and wealthy individuals, who were recently showered with massive federal tax cuts, contribute more in state taxes. Ensuring that the state has sufficient resources to fund the programs and services that California — including AANHPI women — needs is critical.
More specific recommendations for supporting AANHPI women are as follows:
Continue to seek opportunities to challenge and backfill cuts to federal funding for critical programs like Medi-Cal and CalFresh, such as by raising new, ongoing state revenue.
Allow continued enrollment in Medi-Cal, eliminate premiums, and restore dental coverage; and
Ensure a seamless transition of newly SNAP-excluded immigrants to the California Food Assistance Program (CFAP).
Establish an Office of Language Access within the California Health & Human Services Agency (CalHHS) to provide oversight, accountability, and coordination across CalHHS’ departments and offices to ensure individuals who speak a language other than English have meaningful access to the government’s health and human services programs.
Require local and state agencies to collect accurate, disaggregated data in order to identify hidden disparities among AANHPIs.
Preserve and continue to expand commitments to culturally and linguistically appropriate outreach and supports, including:
Restoring the 2018–2019 Safety Net Reserve Fund to support community-based organizations;
Restoring funding for the California Health Enrollment Navigator Program;
Building a pipeline for bilingual/ bicultural licensed therapists, and incentivizing them to train with and subsequently work at LEP-serving community-based organizations;
Continuing to fund the California Reducing Disparities Project, which is aimed at reducing mental health disparities for five key populations including AANHPIs; and
Conducting more culturally and linguistically specific outreach to AANHPI communities for mental health supports and general assistance programs.
Continue to enforce and strengthen laws protecting patient data and privacy, including:
Ensuring state and local agencies do not share sensitive information with the federal government; and
Mandate regular in-language training on safety, health, and workers’ rights for low-wage workers and employers.
Strengthen protections for immigrant workers against employer coercion.
Prohibit employers and others from leveling immigration-related threats meant to preemptively silence them.
Housing
Increase access to safe and affordable housing for AANHPI families.
Prioritize funding, producing, and preserving housing that will be permanently affordable to low-income households, including multigenerational households, seniors and families with children.
Invest in in-language housing counseling programs that assist households with applying to and accessing housing resources.
Invest in measures to increase AANHPI participation in state housing programs, including rental assistance programs.
Consider and implement legislative recommendations made in the Senate Bill 555 (Wahab, 2023) social housing study, which will include a comprehensive analysis of opportunities, resources, and obstacles.
Authorize general obligation bonds to be used for affordable rental housing programs for lower income families and supportive housing for people experiencing homelessness, among other uses. Include carveout for alternative models for permanently affordable housing and other social housingmodels.
Protect low-income AANHPI tenants.
Enact strong baseline relocation protections for tenants to disincentivize displacement and speculation, particularly in the context of jurisdictions with an aging housing stock or housing stock vulnerable to climate change or natural disasters.
Strengthen and clarify language access rights for tenants in their preferred language.
Strengthen protections and create greater stability for renters by narrowing exemptions in the state’s just cause for eviction laws.
Lower the rent cap to a figure more closely aligned with inflation in order to help keep families in their homes and prevent homelessness and overcrowding.
Fund proven emergency rental relief programs in perpetuity.
Protect individuals and families most at-risk of housing instability and homelessness, particularly under the current federal administration.
Allocate funding to local and state governments to provide emergency rental relief to mixed status tenant households, which face the loss of income due to immigration enforcement and other harmful federal actions.
Condemn the criminalization of homelessness, and commit to Housing First policies in order to end the cycle of homelessness in our communities.
Provide state funding to continue ongoing support of homelessness services and permanent housing placement and to backfill federal cuts.
To overcome harmful stereotypes and ineffective policies, state leaders should recognize the multitude of identities and needs underscoring the AANHPI population in California. As federal cuts begin to impact Californians, the need for policies that support the well-being of AANHPI women is even more critical. Policymakers can make this possible by raising sustained, ongoing revenue to support AANHPI women and all vulnerable Californians as the state continues to reel from a harmful federal policy agenda.
The 2024 Women’s Well-Being Index was able to disaggregate many of the 30 indicators by race and ethnicity. However, we know that the identity of Asian and Asian/Pacific Islander incorporates many different ethnicities within those labels, so we have disaggregated some of the indicators further to provide a better understanding of how Asian women are doing in the state. The Asian subgroups were created via the US Census Bureau’s American Community Survey using this resource, and the breakdown is as follows:
South Asians: Bangladeshi, Bhutanese, Indian, Maldivians, Nepali, Pakistani, Sri Lankan.
We created the group Multi-racial Asian to account for individuals who identify as more than one Asian identity. Additionally, due to sample size issues, we sometimes had to group Central Asians with Multi-Racial Asians. We also chose not to include the West Asian group due to limitations with Census data. In 2024, the Census announced they will be including a new Middle Eastern and North African ethnicity option, which will help provide more data on this population.
Steven Ruggles, Sarah Flood, Matthew Sobek, Daniel Backman, Grace Cooper, Julia A. Rivera Drew, Stephanie Richards, Renae Rogers, Jonathan Schroeder, and Kari C.W. Williams. IPUMS USA: Version 16.0. 2019-2023, ACS 5-year. Minneapolis, MN: IPUMS, 2025. Analysis by Cevadne Lee, OCAPICA.
There was a problem processing your signup. Please try again. Or contact us
Please check your email to confirm your signup.
key takeaway
Federal funding instability to the Victims of Crime Act (VOCA) threatens essential services for survivors of domestic violence, creating uncertainty for service providers who rely on these funds. To ensure survivors receive the support they need, state and federal policymakers must prioritize stable, ongoing funding and prevent further cuts to VOCA.”
Every Californian deserves to live in a world free from violence. However, this is not the reality for millions of Californians — especially women, people of color, transgender, and non-binary Californians — who experience domestic and sexual violence every year. Programs that provide essential services to survivors are critical tools in protecting survivors’ safety and helping them heal and recover. However, federal cuts have resulted in large funding gaps for these programs, and ongoing threats by Congressional Republicans and the Trump administration, including a federal funding freeze or additional budget cuts, would harm the ability of service providers to support survivors. Ongoing funding at the state and federal level is needed to ensure that survivors are provided with the crucial services they need.
How are Programs Supporting Survivors of Domestic and Sexual Violence Funded?
California receives federal dollars through the Victims of Crime Act (VOCA) that help fund programs that provide survivors with services like emergency shelter, counseling, and financial assistance. However, the lack of a federal fiscal year (FFY) 2026 congressional appropriations package and ongoing federal instability due to shifting prosecution styles have left programs in the dark about the longevity and stability of their grants.
Where Do the Victims of Crime Act Funds Come From?
The Victims of Crime Act was a bipartisan effort passed in 1984 with the purpose to help survivors of crime with the associated costs like medical bills and lost wages. The passage of VOCA established the Crime Victims’ Fund, which is what holds the dollars to support survivors. The money in the fund is collected by the federal government and comes from criminal fines, penalties, forfeited bail bonds, and special assessments paid by people or corporations convicted of federal crimes.
Those dollars do not directly go to states. Congress authorizes the release of a set amount of money, or cap, each year from the fund. As shown in the following diagram, the process of distributing the funds involves multiple steps and allocates funds to several purposes, before ultimately reaching the states to support crime victim services.
Once the funds have gone through every step in the above chart, the very last step is awarding 47.5% of the remaining balance in grants to states. This is not the only way these dollars can go to states to support victim services — shelters also get funding through other federal agencies and grants — but the dollars awarded through the victim assistance formula grants are the most direct and most flexible.
In California, the money goes to the California Governor’s Office of Emergency Services, who administers the funding to eligible organizations that provide direct services to survivors.
Federal Funding Levels are Inconsistent, Causing Challenges for Survivor Service Providers
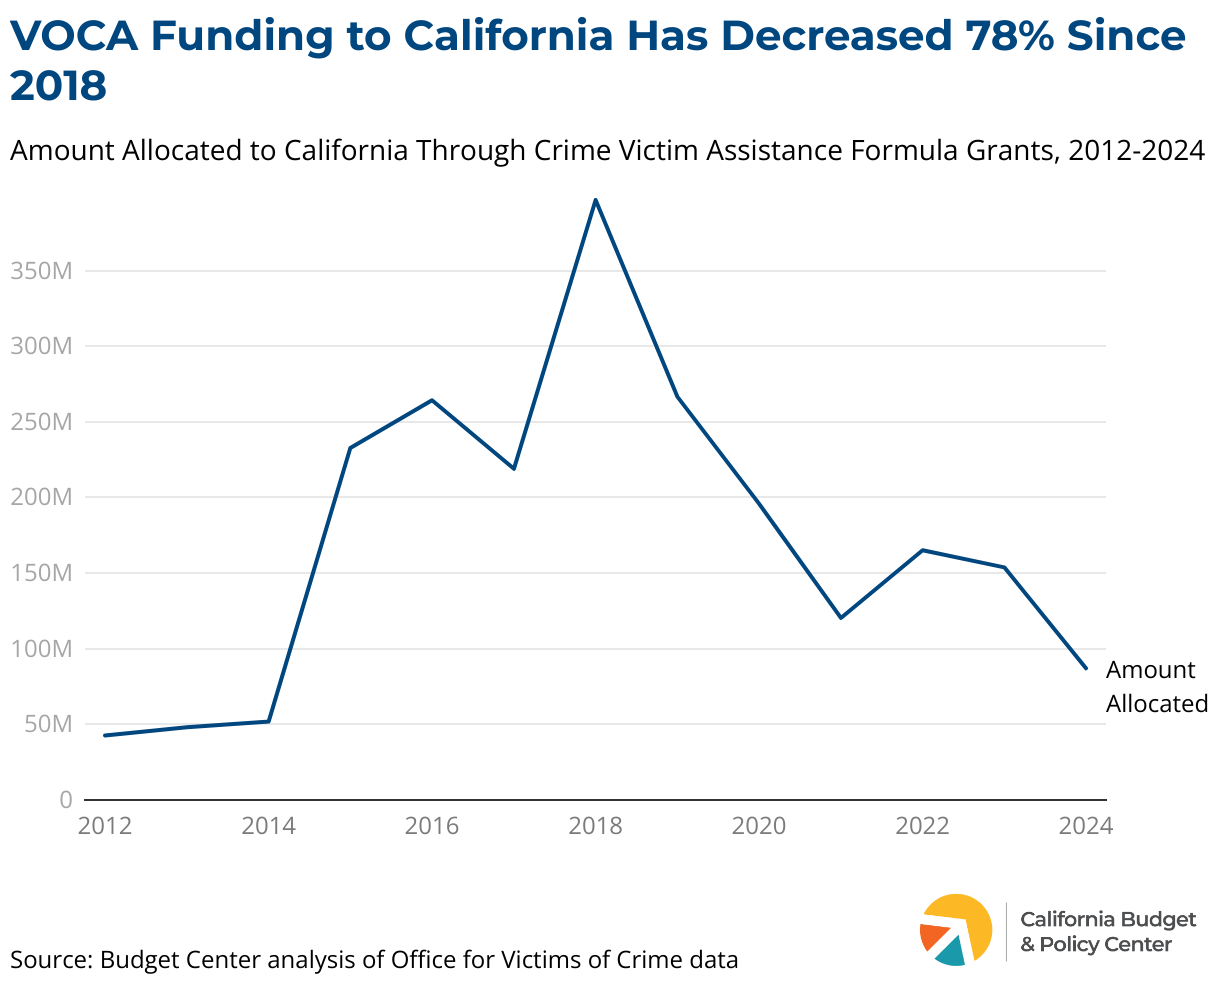
Unfortunately, while this funding is necessary to provide crucial support to survivors, it is currently insufficient due to federal funding cuts. Since 2019, funding has fallen far short of levels needed to maintain the services local organizations provide to more than 816,000 victims of crime in California. While the state stepped in and provided $103 million in one-time funding in 2024 and $100 million in one-time funding in 2025 to backfill federal VOCA funding gaps, the state has not made an ongoing commitment to fund these vital programs that support survivors.
Due to changes in the amount Congress decides to allocate each year to be released from the fund and large fluctuations in the amount collected in federal fines and fees, funding for survivors is precarious. As shown in the chart below, there have been large swings in the amount in the Crime Victims Fund, such as in 2017 when there was a $4.3 billion settlement from Volkswagen that led to a massive increase in the amount of funding sent to California the following year. These swings in funding levels have largely been due to unexpectedly large criminal fines and settlements, which can change drastically from year to year and create instability so programs cannot count on consistent funding to provide the critical services necessary for survivors.
What Are the Current Threats to This Funding?
While the dollars in the Crime Victims Fund come from criminal fines and fees, they are unfortunately still under threat due to a lack of a final FFY 26 appropriations package and a decrease in federal prosecution of white-collar crimes. In addition to decreasing federal funding, the Trump administration could pursue several potential actions that would harm survivors and service providers by:
Putting new grant conditions on the funds programs receive to limit who can be served or what services are prioritized;
Working with Congress to reduce or zero out how much is released from the fund each year; or
Using VOCA funding release to fund programs that do not support survivors or victims of crime.
How can state and federal policymakers better support survivors?
Programs that support survivors can be better resourced in two ways:
State-Level: The state can help fill the gaps left by the federal government cutting VOCA funding to ensure that every Californian can feel safe. Ongoing, stable funding is crucial for service providers to be able to best support survivors.
Federal-Level: Do not continue to make cuts to VOCA funding. Proposed and planned federal budget cuts threaten the ability of domestic and sexual violence service providers to care for survivors, which puts the health and well-being of millions of Californians at risk in favor of tax cuts for corporations and the wealthy. Instead, Congress should appropriate adequate funding to be released each year from the fund in order for service providers to maintain and grow their critical programs.
There was a problem processing your signup. Please try again. Or contact us
Please check your email to confirm your signup.
key takeaway
Women in California continue to experience higher poverty rates than men, highlighting that despite decades of progress in job opportunities and earnings, women — especially women of color — still face persistent barriers. While recent state and federal budget cuts threaten to worsen these inequities, state policymakers have the tools to ensure all California women have the resources they need to thrive.
Women in California continue to face economic barriers that undermine equitable access to economic stability and well-being. In 2024, 18.4% of California women lived in poverty, reflecting persistent inequities in pay, caregiving demands and the cost of child care, and inadequate political representation. Racial poverty gaps for women of color also persist in large part due to the intersectionality of racism and sexism they have historically endured, with Black and Latina Californians experiencing poverty rates that are approximately 10 percentage points higher than rates for white women, according to new Census data.
When women thrive, their families and communities prosper. However, women still struggle to afford basic needs, and systemic racism and gender inequities have meant that despite decades of progress in job opportunities and earnings, women still face barriers to equity.
Recent federal and state cuts to life-saving programs will lead to an even greater rise in poverty and further entrench gender inequities unless policymakers take bold action to reverse course. The harmful Republican megabill, H.R. 1, drastically cuts funding for health care, food assistance, and other basic supports for millions of women across the United States, using that cost savings to pay for tax cuts for wealthy individuals and corporations. Given that women make up the majority of recipients of food assistance and women — especially women of color — already face health disparities, these cuts will make it harder for women in California to make ends meet. The 2025-26 California state budget also includes significant cuts to health care access that will likely worsen existing inequities women face.
Confronting the harm to California’s communities requires bolder action from state leaders. With 7 million Californians living in poverty — even before these extraordinary budget cuts fully take effect — state leaders should do everything possible to support investments that help California women afford essential needs, including health care, food, child care, and housing. These investments are possible if leaders raise significant, ongoing revenue, particularly from the corporations and wealthy individuals that are overwhelmingly benefiting from recent massive federal tax cuts.
H.R. 1 and the Federal Budget
H.R. 1, the harmful Republican mega bill passed in July 2025, will deeply harm Californians by cutting funding for essential programs like health care, food assistance, and education.
See how California leaders can respond and protect vital supports.
Poverty Rates for Women in 2024 Signal Further Challenges Ahead
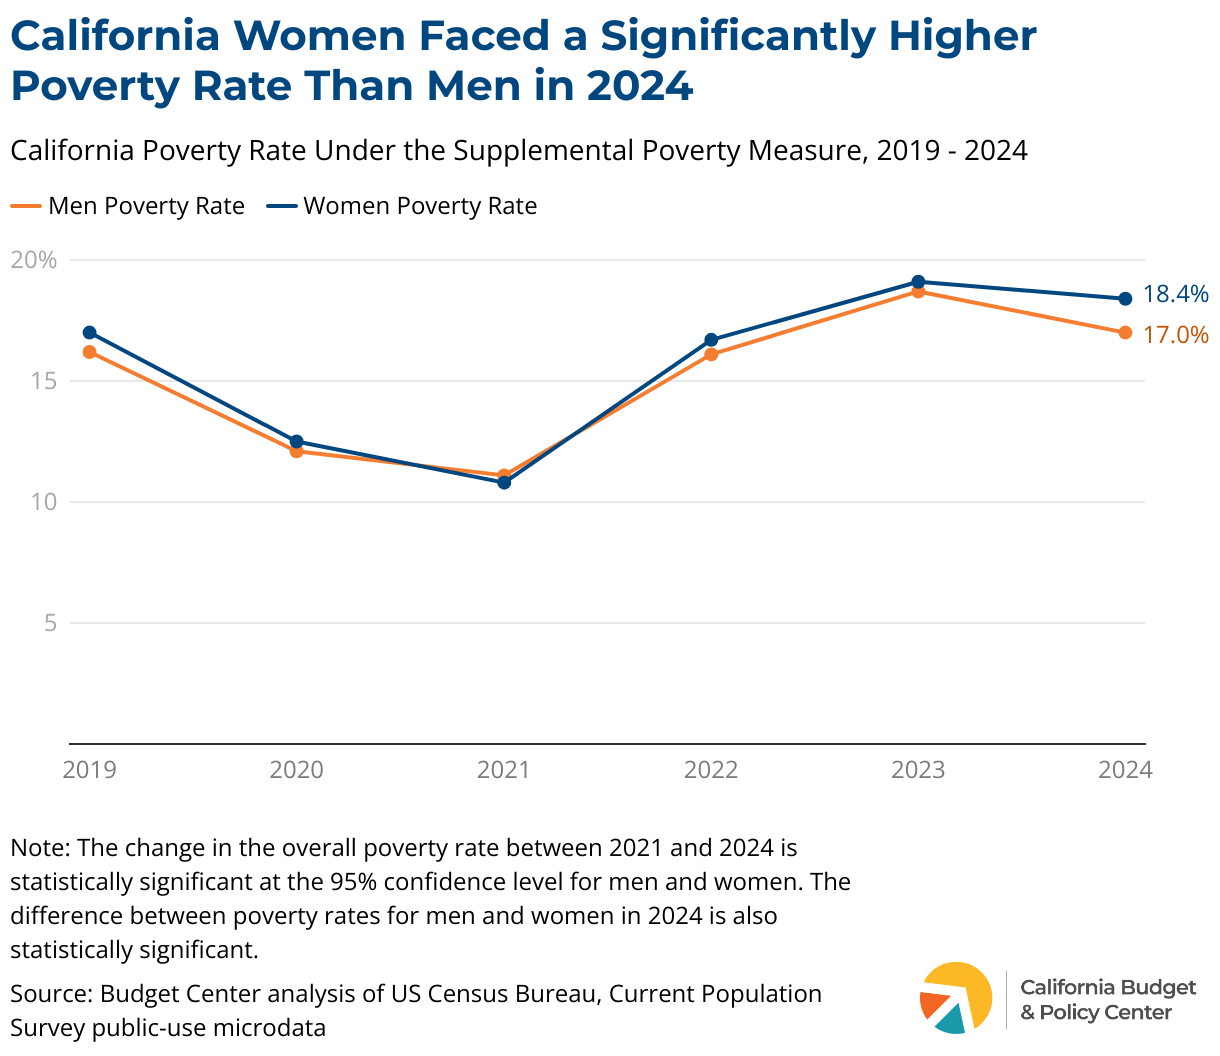
Using new US Census data, the Supplemental Poverty Measure — a more comprehensive reflection of economic well-being than the Official Poverty Measure — shows that the poverty rate for women in California remains high and is now significantly higher than the rate for men. Although the poverty rates for California’s men and women have followed a nearly identical trend since 2019, the poverty rate for women in 2024 (18.4%) was significantly higher than the rate for men (17.0%).
Poverty rates for both men and women hit significant lows in 2021, which reflected the success of pandemic-era policies like the expanded federal Child Tax Credit in reducing poverty. However, the gap in poverty rates in 2024 between men and women is a warning sign for women. H.R. 1 slashed funding for SNAP (CalFresh food assistance in California) and Medicaid (Medi-Cal in California) and severely reduced access to preventive care, primary care, and reproductive and sexual health care, all of which will especially harm women. Given the higher poverty rates women experienced in 2024, the cuts to proven poverty-reducing programs will fall hardest on women and risk pushing more into poverty.
Poverty for Older Women and the Rise in Poverty for Adult Women Are Both Alarmingly High
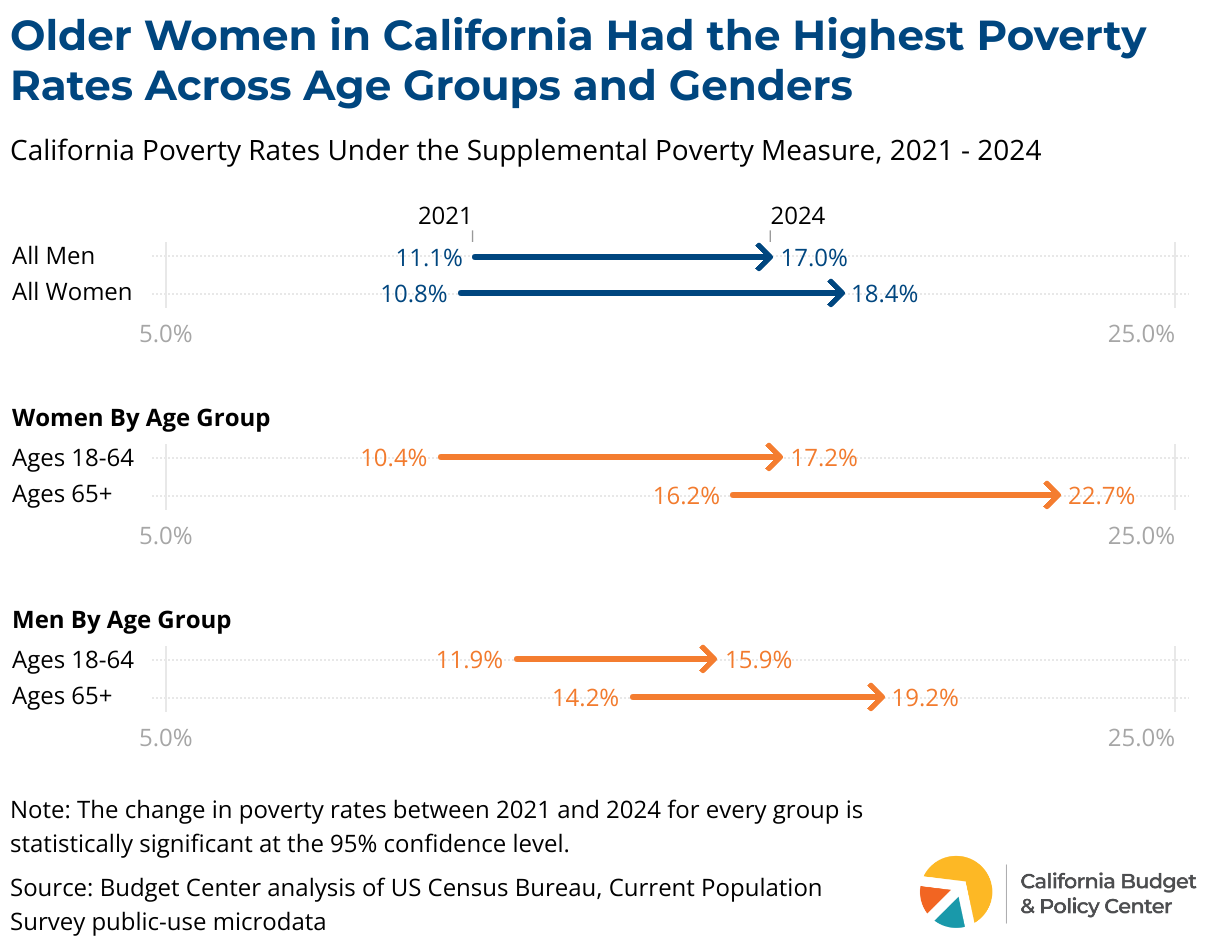
Older women faced a staggeringly high poverty rate in 2024. Women ages 65 and up had a poverty rate of 22.7% in 2024, over 5 percentage points higher than the overall poverty rate for women. Older adults are subject to higher out-of-pocket medical expenses, which contribute to their higher poverty rates and will only worsen with the policies from the federal and state budgets. Both H.R. 1 and the state budget include harmful policies and cuts to health care programs that will make accessing health care for older adults even more expensive. Additionally, new work requirements are more likely to harm older women who had left the workforce to care for children or family members. Together, these cuts and policies will further push older women into poverty.
H.R. 1 — the harmful Republican megabill — does not address these inequities adult women face. Instead, it reverses progress that had been made in granting more adults access to affordable health insurance. H.R. 1 contains multiple provisions that will result in adults losing their health care. Administrative burdens like work requirements and increased eligibility checks for adults as well as new copayments on certain Medi-Cal services for low-income adults will likely result in millions of Californian adults — who are already the age group most likely to lack health insurance — losing coverage and pushing more adults and especially adult women into poverty.
Racial Inequities Persist, Especially for Women of Color
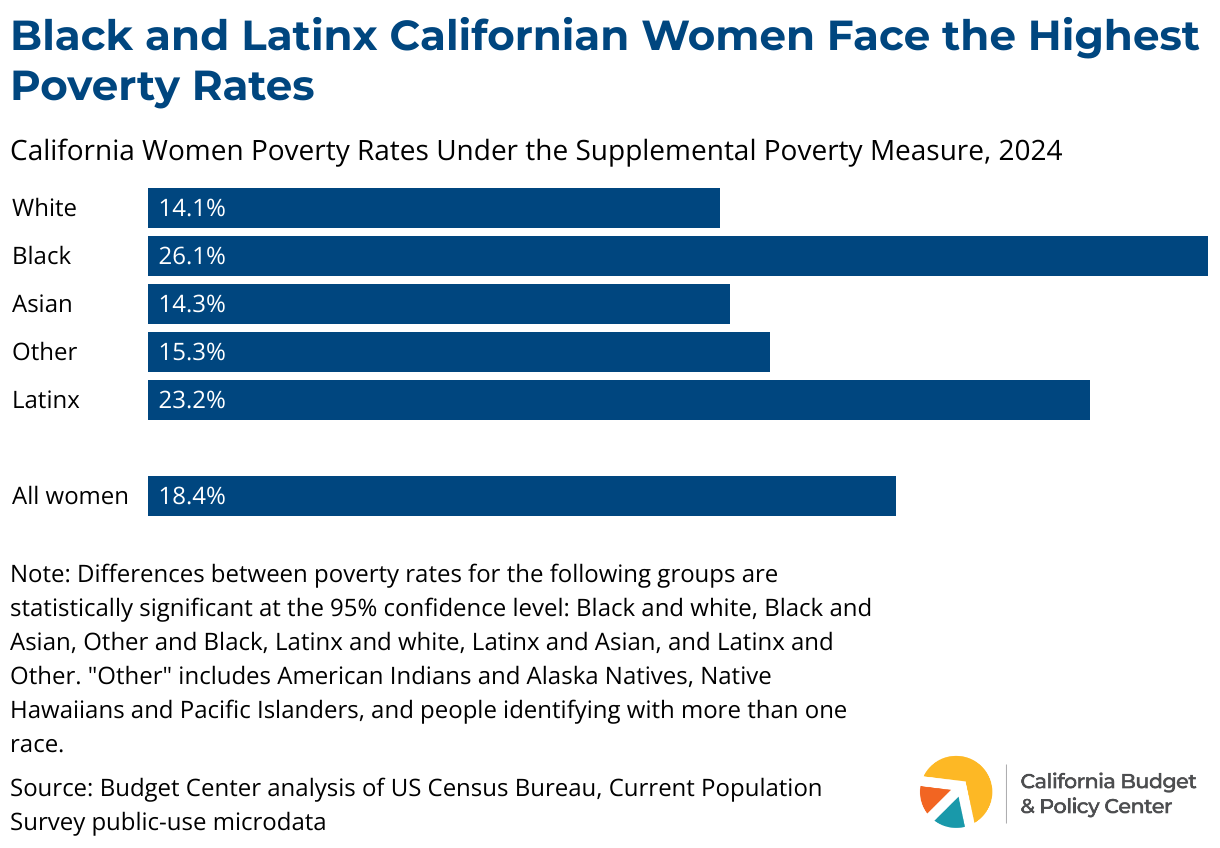
While poverty increased across all racial and ethnic groups in California from 2021 to 2024, poverty rates remain the highest for Black and Latinx Californians, especially Black and Latinx women. Over one in four Black women (26.1%) were in poverty in 2024 and 23.2% of Latinx women were in poverty, both of which are significantly higher than the 14.1% of white women. These disparities are evidence of generations of systemic racism, as well as racial discrimination in housing, access to banking, education, and taxation that have all contributed to a racial wealth gap evident in this poverty data.
H.R. 1 will disproportionately harm Californians of color and immigrants, which will only deepen inequities that women of color face. Federal cuts to Medicaid would take health coverage away from millions of Californians of color, forcing families to delay or forgo care, take on medical debt, and face greater risks of falling into poverty. More than one in three Californians — nearly 15 million people — rely on Medi-Cal, the state’s Medicaid program, for health coverage. Latinx Californians represent more than half of Medi-Cal enrollees and Black Californians make up nearly 7% of enrollees.
At the same time, monthly premium costs for Covered California, the state’s health insurance marketplace for people who do not qualify for Medi-Cal, are projected to rise by an average of 66% due to the expiration of enhanced premium tax credits, with even steeper increases for communities of color.
Federal actions also permanently gut the federal estate tax, allowing wealthy families to pass up to $30 million to their heirs tax-free, perpetuating wealth inequality and the racial wealth gap.
Without strong state policy interventions, recent federal actions will deepen racial and ethnic disparities especially for women of color, leaving Californians of color with fewer resources to stay healthy, build wealth, and achieve economic security. Protecting Medi-Cal and advancing more equitable tax policies are critical to ensuring all Californians can share in the state’s prosperity.
First Look: Understanding the Governor’s Proposed 2026-27 California Budget
Learn about the key pieces of the 2026-27 California budget proposal, and see how the governor addresses affordability, federal cuts, and California’s fiscal priorities.
Women Renters in California Experience High Poverty Rates
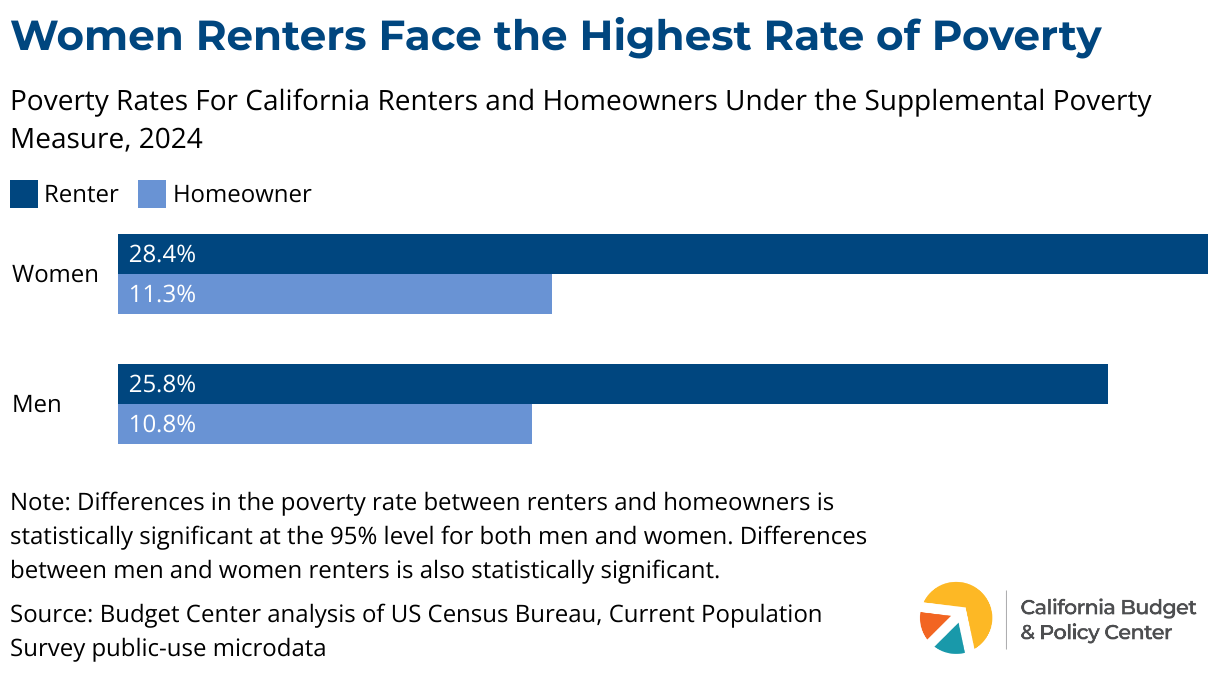
Housing is the single largest cost in most family budgets, and high housing costs are pushing more people, especially those already facing systemic barriers, into deeper hardship. California renters are particularly likely to experience poverty due to unaffordable housing costs, which threaten their economic and housing stability.
While renters consistently face a higher poverty rate than homeowners, this is especially the case for women renters. The percentage of women renters in poverty is significantly higher than the percentage of men. Women are consistently more likely than men to face unaffordable housing costs. Women have long faced historical racism and sexism in the housing market that when combined with gender inequities like lower pay, less accumulated wealth, and a higher likelihood to be caring for children continue to keep women renters in poverty.
Renters — and especially women renters — need support. However, future federal policy choices may exacerbate poverty among renters. Proposals from the Trump administration and the House for the upcoming federal fiscal year included cuts to rental assistance and affordable housing funds. Meanwhile, the Senate proposed level funding for Housing Choice Vouchers — the main federal rental assistance program — which is still not sufficient to fully fund voucher renewals for current participants, and could result in an estimated 14,400 households, encompassing 31,600 people, losing housing vouchers in California. Additionally, neither the House nor Senate has proposed sufficient funding for fully transitioning Emergency Housing Voucher recipients into the Housing Choice Voucher program, which currently serves over 15,000 people in California.
The lack of federal and state investments in affordable housing and rental assistance, combined with the enacted federal cuts to health and food assistance, will mean more women will face impossible choices between having enough food, accessing needed medical care, and paying rent.
State Leaders Have the Tools to Help California Women Living in Poverty
Women in California face continued disparities across all aspects of their lives, and the poverty rates for women in the state have remained high. Recent federal and state budget decisions strip away crucial safety net programs for women and will further entrench existing inequalities. In order to meaningfully reduce poverty amongst women in California, state policymakers must raise revenue to fund programs that are proven to reduce poverty. This starts with making sure that corporations and wealthy individuals pay their fair share in taxes, especially given the massive federal tax cuts they will be getting from H.R. 1 which are being financed by gutting the very safety net programs that help lift women out of poverty. State policymakers should begin by:
Ending California’s most costly corporate tax break — the water’s edge loophole — which allows corporations to avoid around $3 billion in California taxes each year and deprives the state of needed resources to address the most pressing concerns facing Californians.
There was a problem processing your signup. Please try again. Or contact us
Please check your email to confirm your signup.
key takeaway
California’s poverty rate remains among the highest in the nation (17.7%), with children, people of color, and renters most affected. Recent federal actions threaten to worsen these trends, highlighting the urgent need for bold state leadership.
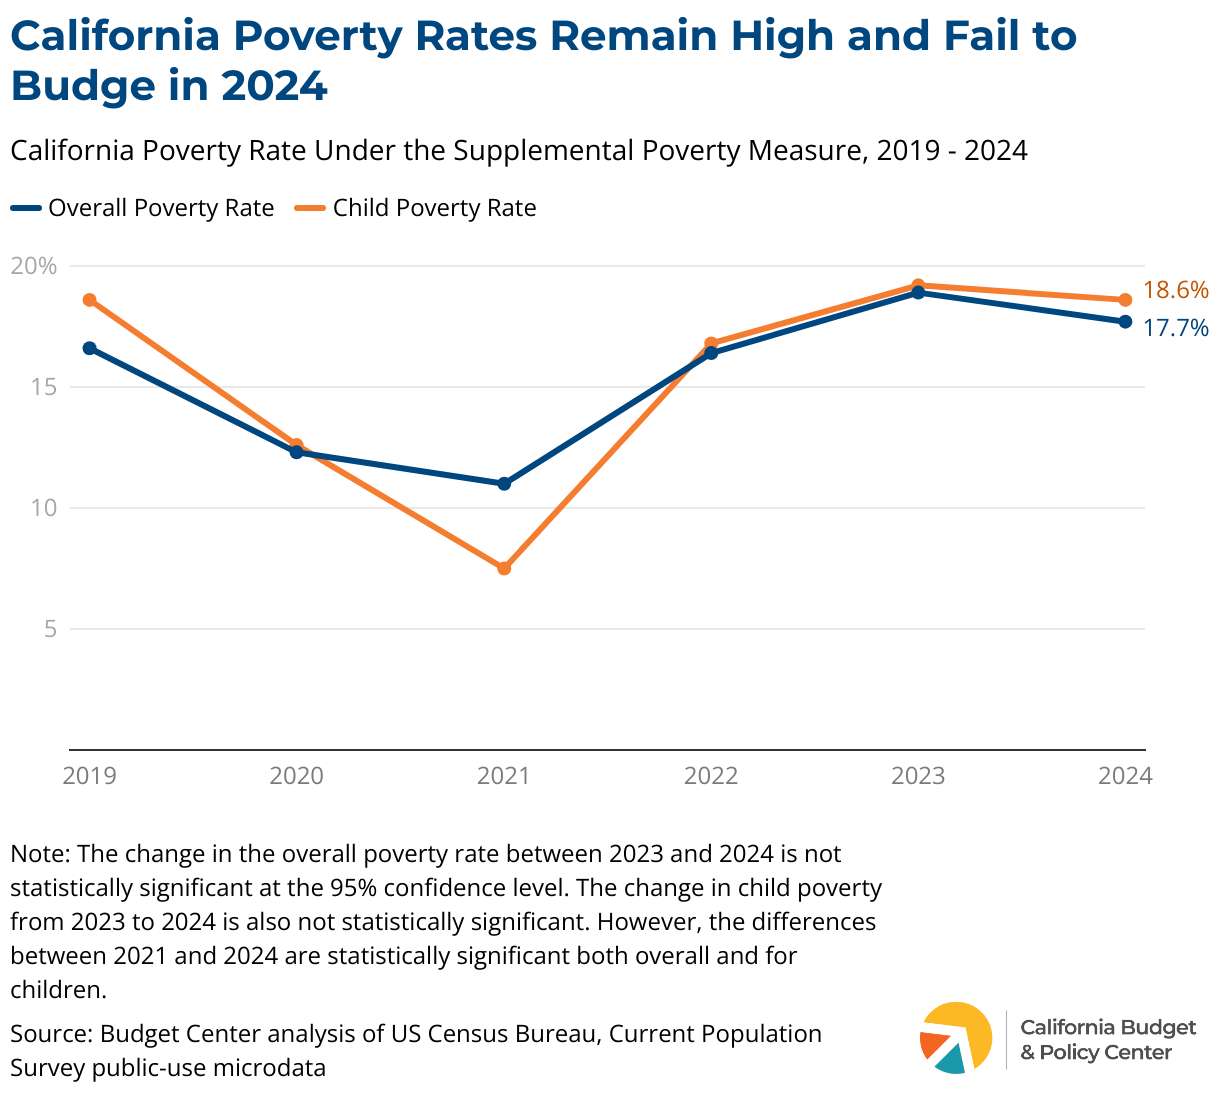
California’s poverty rate, at 17.7%, continued to be the highest (alongside Louisiana) in the United States in 2024, with no tangible improvement from 2023. Racial poverty gaps also remain stark, with Black and Latinx Californians experiencing poverty at approximately ten percentage points higher than white Californians, according to new Census data. California’s poverty rate means that about 7 million state residents lacked the resources to meet basic needs last year — roughly equivalent to the populations of Los Angeles, San Diego, San Jose, and San Francisco combined.
These figures reflect a troubling trend that began with the rollback of historic anti-poverty investments that were created to mitigate the harm of the COVID-19 pandemic —underscoring that poverty is a policy choice. Bold investments in the federal Child Tax Credit (CTC) and other economic security-promoting policies during the pandemic were associated with a historic drop in poverty in 2021. When Congress allowed these effective policies to expire, they immediately reversed progress, causing the largest increase in the national poverty rate in 50 years, and a significant spike in California’s poverty rate.
Recent federal and state cuts to life-saving programs will likely contribute to an even greater rise in poverty and increased economic inequality across California next year and beyond, unless policymakers take bold action to respond. On July 4, 2025, President Trump, with the support of every Republican in California’s congressional delegation, signed a federal budget into law that strips away health care, food assistance, and other basic supports for millions of Americans, driving up living costs and making it harder to make ends meet. This shift in federal policy diverges from established evidence on effective strategies to reduce poverty, which emphasize sustained investments in public supports. The 2025-26 California state budget also includes significant reductions in health care that will harm the same populations targeted by federal policies, particularly immigrants, seniors, and people with disabilities.
Confronting the harm to California’s communities requires bolder action from state leaders. With 7 million Californians already living in poverty even before these extraordinary budget cuts fully take effect, state leaders should do everything possible to support investments that help Californians afford essential needs, including health care, food, child care, and housing. These investments are possible if leaders raise significant, ongoing revenue, particularly from the corporations and wealthy individuals that are overwhelmingly benefiting from recent massive federal tax cuts.
Poverty Remains Alarmingly High Following Repeal of Pandemic-Era Policies
Nearly 7 million Californians lived in poverty in 2024, according to new US Census data based on the Supplemental Poverty Measure — a more comprehensive reflection of economic well-being than the Official Poverty Measure. The poverty rates of 17.7% for all Californians and 18.6% for children were statistically unchanged from 2023 levels, but reflect a drastic increase from the recent historic low of 11% overall poverty in 2021.
This alarmingly high level maintains the trend in increased poverty over the last few years since the expiration of many pandemic-era policies that expanded public benefits and their reach. The last of those expansions expired in early 2023 with the end of Supplemental Nutrition Assistance Program (CalFresh in California) emergency allotments, which temporarily increased nutrition benefits for program participants. The post-relief trend underscores the significant role that federal supports like safety net and social insurance programs play in reducing poverty.
H.R. 1 and the Federal Budget
H.R. 1, the harmful Republican mega bill passed in July 2025, will deeply harm Californians by cutting funding for essential programs like health care, food assistance, and education.
See how California leaders can respond and protect vital supports.
Poverty Increased Across All Age Groups, Especially for Younger Californians
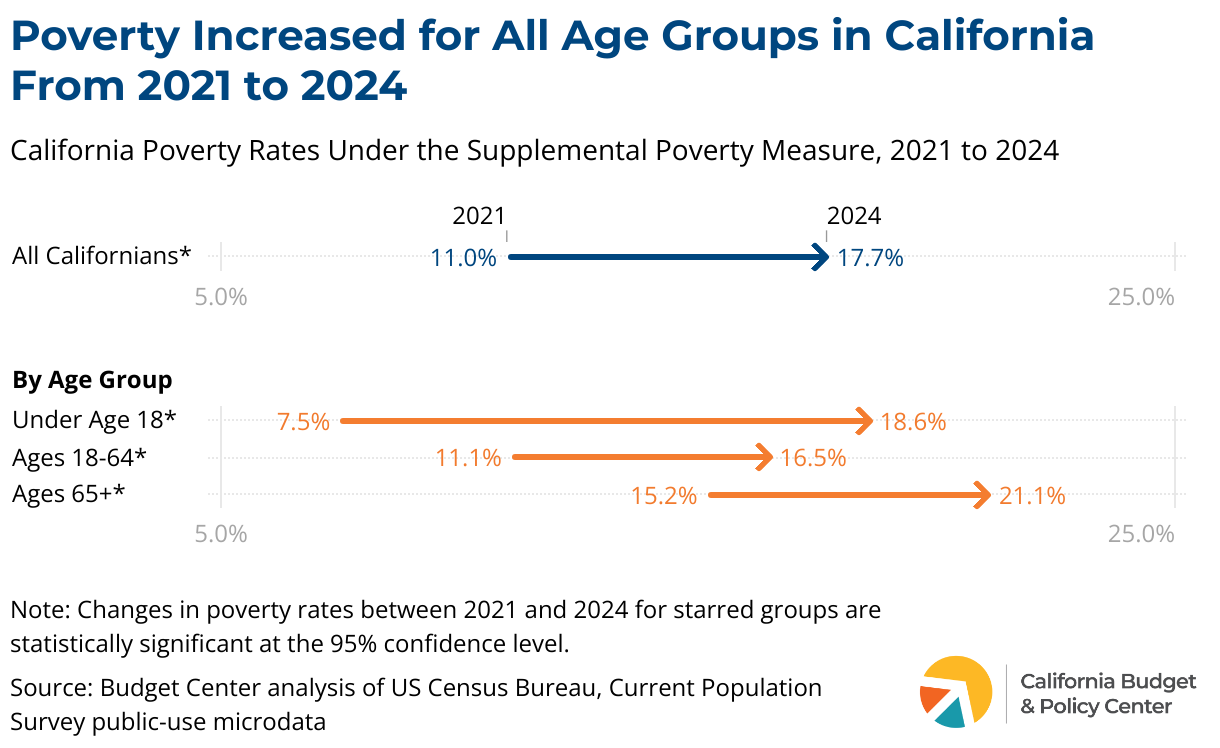
Poverty rose significantly across all age groups from 2021, though rates vary among children, adults, and older adults. Notably:
Child poverty more than doubled, reflecting the sunset of the expanded federal Child Tax Credit. Child poverty has risen since 2021 from 7.5% to more than double that in 2024 at 18.6%. In general, the poverty rate is higher for children than for adults given the costs associated with raising children (such as child care) and the low wages for parents and caregivers, particularly women and women of color. Additionally, at the national level, the expanded federal CTC kept 2.9 million children out of poverty in 2021. When Congress let the expanded CTC expire in 2022, more children in California fell into poverty. This trend will only worsen with recent federal budget decisions to take the child tax credit away from mixed-status families.
Poverty remains highest for older adults in California. As displayed in the chart above, poverty is highest for adults ages 65 and older, at 21.1%. This trend is largely due to higher out-of-pocket medical expenses for older adults and mirrors national poverty trends. Both the federal and state budgets include harmful policies and cuts to health care programs that will make accessing health care for older adults even more expensive, further pushing older adults into poverty.
Poverty rates for adults are significantly higher in 2024, as compared with 2021. Sustaining a trend from last year, poverty continues to be on the rise for the largest age group in California. Specifically, poverty for Californians ages 18 to 64 rose from 11.1% in 2021 to 16.5% in 2024.
Racial Inequities Persist, Further Highlighting How Federal Actions Disproportionately Impact Californians of Color
Poverty increased across all racial and ethnic groups from 2021 to 2024. These increases were most pronounced for Black and Latinx Californians, further widening racial disparities in the state. Such disparities reflect generations of systemic racism that continue to persist. Racial discrimination in housing, access to banking, education, and taxation have all contributed to a racial wealth gap that is reflected in today’s poverty estimates.
Recent federal actions will disproportionately harm Californians of color and immigrants and are likely to push more Black and Latinx Californians into poverty in future years. Federal cuts to Medicaid would take health coverage away from millions of Californians of color, forcing families to delay or forgo care, take on medical debt, and face greater risks of falling into poverty. More than one in three Californians — nearly 15 million people — rely on Medi-Cal, the state’s Medicaid program, for health coverage. Latinx Californians represent more than half of Medi-Cal enrollees and Black Californians make up nearly 7% of enrollees.
At the same time, monthly premium costs for Covered California, the state’s health insurance marketplace for people who do not qualify for Medi-Cal, are projected to rise by an average of 66% due to the expiration of enhanced premium tax credits, with even steeper increases for communities of color.
Federal actions also permanently gut the federal estate tax, allowing wealthy families to pass up to $30 million to their heirs tax-free, perpetuating wealth inequality and the racial wealth gap.
Without strong state policy interventions, recent federal actions will deepen racial and ethnic disparities, leaving Californians of color with fewer resources to stay healthy, build wealth, and achieve economic security. Protecting Medi-Cal and advancing more equitable tax policies are critical to ensuring all Californians can share in the state’s prosperity.
California Renters Experience Higher Levels of Poverty, Particularly Latinx and Black Renters
Housing is the single largest cost in most family budgets, and high housing costs are pushing more people, especially those already facing systemic barriers, into deeper hardship. California renters are particularly likely to experience poverty due to unaffordable housing costs, which threaten their economic and housing stability.
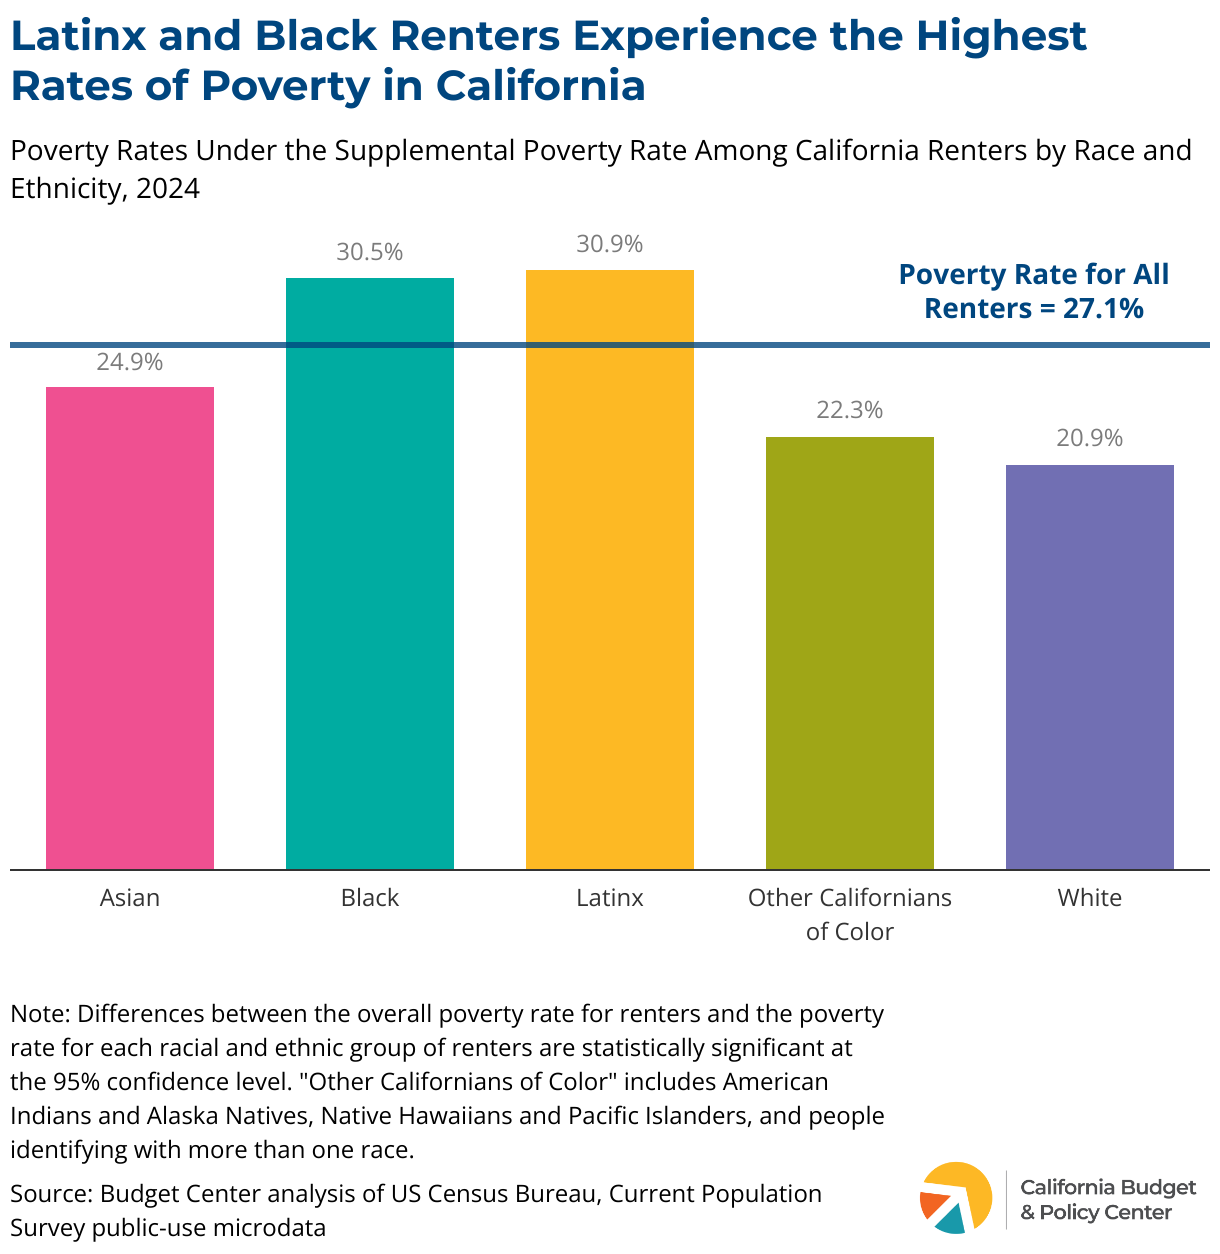
More than one-quarter (27.1%) of California renters experienced poverty in 2024, compared to 11.1% of homeowners. The 2024 poverty rate for renters is not statistically different from the 2023 rate, but it is significantly higher than the rate in 2021 (15.8%), when pandemic assistance for renters was still available.
Renters with the lowest incomes come from different walks of life and include older adults, people with disabilities, families, and single caregivers. Many also work or are pursuing their education while trying to stretch their budgets to make ends meet. Latinx and Black renters experienced the highest rates of poverty in 2024, at 30.9% and 30.5%, respectively. This is consistent with the fact that these groups of renters are most likely to have unaffordable housing costs that account for more than 30% of their income.
Future federal policy choices may lead to increases in poverty among renters. Proposals from the Trump administration and the House for the upcoming federal fiscal year included cuts to rental assistance and affordable housing funds. Meanwhile, the Senate proposed level funding for Housing Choice Vouchers — the main federal rental assistance program — which is still not sufficient to fully fund voucher renewals for current participants, and could result in an estimated 14,400 households, encompassing 31,600 people, losing housing vouchers in California. Additionally, neither the House nor Senate has proposed sufficient funding for fully transitioning Emergency Housing Voucher recipients into the Housing Choice Voucher program, which currently serves over 15,000 people in California.
The lack of federal and state investments in affordable housing and rental assistance, combined with the enacted federal cuts to health and food assistance, will mean more families and individuals will face impossible choices between having enough food, accessing needed medical care, and paying rent.
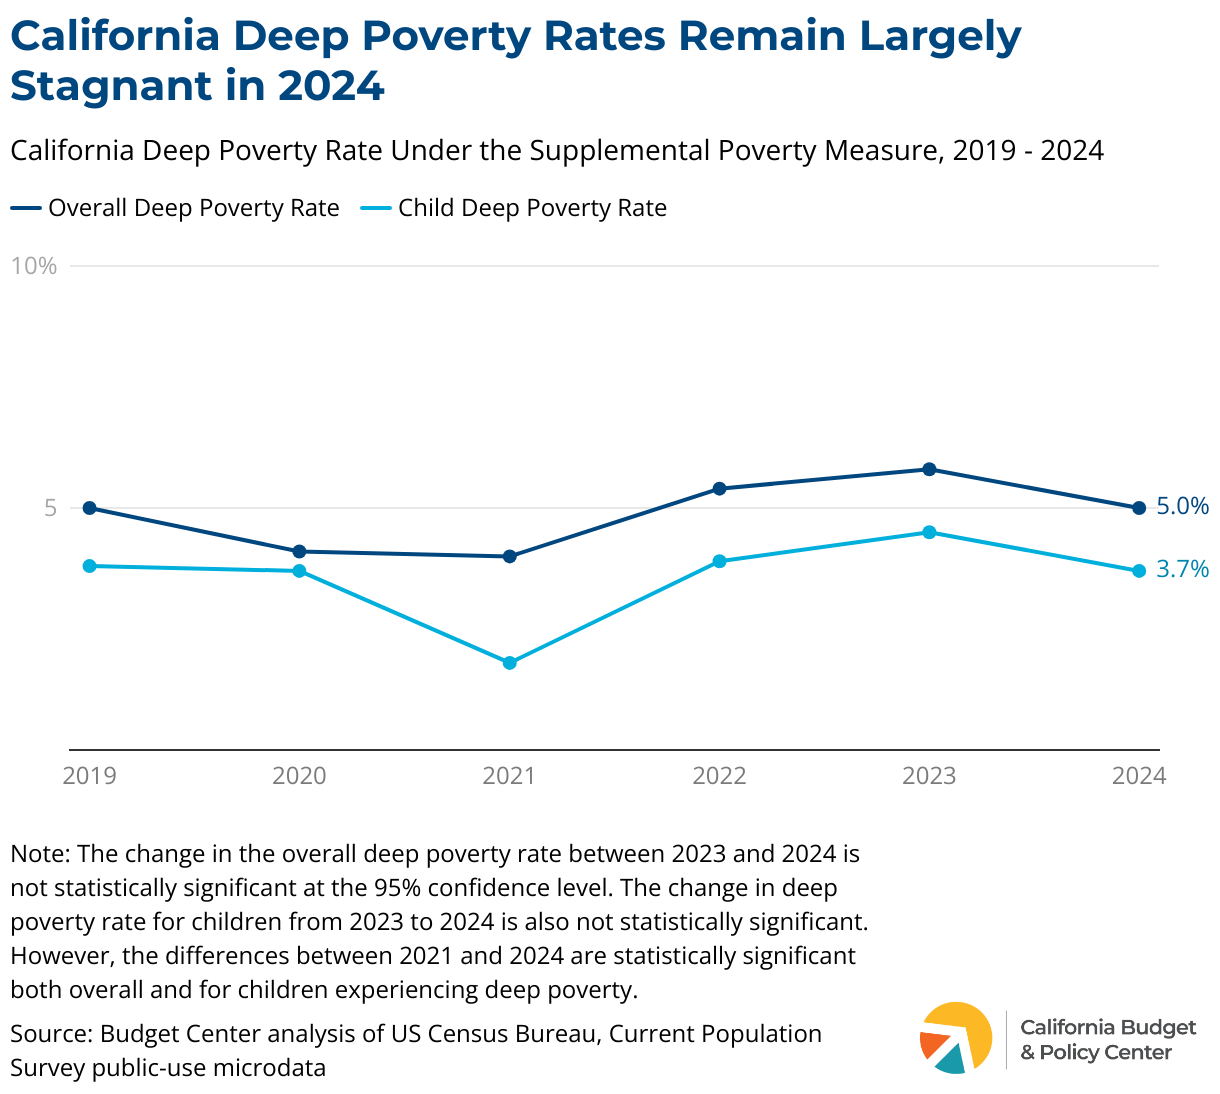
Tackling Deep Poverty Requires Bolder Expansions
In 2024, nearly 2 million Californians lived in deep poverty. Deep poverty, which is representative of severe economic hardship and extreme poverty, is defined in this analysis as a household with total resources below 50% of the supplemental poverty measure threshold. For a family of two adults and two children, this is equivalent to approximately $20,000 per year, inclusive of public assistance.
Over the past few years, the deep poverty rate has remained relatively stable, even during historic drops in the overall poverty rate in response to expanded pandemic-era relief. The trend in the deep poverty rate among children appears to have been more responsive to increased federal supports in 2021, which coincided with significant expansions to the child tax credit, but rose to pre-pandemic levels after these expansions were repealed.
Research shows that since the 1990s, following sweeping reforms to the safety net, public assistance has shifted from helping the poorest households toward work-based assistance. The emphasis on policies like work reporting requirements to obtain assistance minimizes the complex barriers to work for people facing this level of economic hardship, often categorically excludes people in need from accessing programs, and has contributed to a rise in deep poverty. As a result, investments in traditional public supports often don’t reach the people who experience deep poverty. To truly support Californians living in deep poverty, policymakers must go beyond simply maintaining existing safety net programs and expand them so families currently blocked from accessing supports can afford food, health care, and rent.
Californians Need State Leaders to Address Poverty with Bold Action
Poverty in California remains extremely high, and recent federal budget cuts will cause a steeper rise in hardship in years to come as millions of Californians lose health care and food assistance, further straining household budgets and pushing them deeper into poverty. Faced with this looming crisis, Californians need state leaders to take bold action to mitigate the harm and hardship of federal cuts. State leaders should particularly focus on ensuring that the corporations and wealthy individuals, who were recently showered with massive federal tax cuts, contribute more in state taxes. This is because these federal tax giveaways are largely financed by deep federal cuts to health care and food assistance — the very cuts that are likely to cause poverty and hardship to rise for years to come — and because corporate profits have skyrocketed in recent years while workers’ wages have stagnated. As a start, state leaders should:
End California’s most costly corporate tax break — the water’s edge loophole — which allows corporations to avoid around $3 billion in California taxes each year and deprives the state of needed resources to address the most pressing concerns facing Californians.
Improving the economic security of Californians not only lifts families out of poverty, it also supports a more equitable state and a robust economy. Racial/ethnic and gender disparities in California continue to persist, which will further widen without action from state leaders. For California to be a state for all to thrive — regardless of race or ethnicity, gender, and other identities — state leaders should take bold action to mitigate the rise in poverty and present a different vision for California than the one the federal government has put forth in recent months. State leaders have the tools to hold a California for all as the vision, the goal, and the promise.
There was a problem processing your signup. Please try again. Or contact us
Please check your email to confirm your signup.
key takeaway
Federal budget cuts to essential services threaten to worsen long-standing inequities for Latinx Californians and immigrants, underscoring the urgent need for state leaders to protect communities through stronger investments and fairer tax policies.
Access to affordable health care, child care, housing, and food is necessary for all Californians to thrive. However, congressional members — with the support of all California Republican representatives — and the Trump administration have passed a federal budget that includes deep and harmful cuts to programs that provide health coverage, nutrition assistance, and other essential services. The significant cuts represent one of the largest transfers of wealth in the history of the United States, which helps fund huge tax giveaways for the wealthy and provide an unprecedented increase in funding for immigration enforcement.
These cuts are harmful for millions of Californians with low incomes who are already struggling to secure basic needs. Still, these proposals are especially devastating for Latinx Californians, who are the largest racial and ethnic group in the state, yet continuously face significant disparities in areas such as health care access, earnings, rent burden, and access to child care due to historic ongoing racism and discrimination.
The California Immigrant Policy Center (CIPC) is a constituent-based statewide immigrant rights organization with offices in Los Angeles, Sacramento, and Fresno. It is a leading immigrant rights institution in the state. CIPC advocates for policies that uphold the humanity of immigrants and refugees in California by transforming systems to achieve racial, social, and economic justice.
Latinx Californians Are Essential to California
It would not be an exaggeration to say that there is no California without Latinx Californians, who make up the largest share — 40% — of racial and ethnic groups in California and also comprise more than half of young Californians. As the population of Latinx Californians increases, so does their visibility and representation across all aspects of everyday life. Though they work across all industries, Latinx Californians are disproportionately concentrated in industries that are notorious for low wages, limited workplace protections, lack of employer-provided benefits such as health insurance, and safety risks, including construction, agriculture, retail trade, and other services (e.g., janitorial services). Latinx workers in these industries experience low pay and significant power imbalances that contribute to a high need for programs to support basic needs — many that have been significantly cut.
Medi-Cal is California’s Medicaid program, which provides free or low-cost health coverage to over one-third of the state’s population. The program serves individuals with modest incomes, including children, seniors, people with disabilities, and pregnant individuals.
CalFresh
CalFresh is California’s Supplemental Nutrition Assistance Program (SNAP). CalFresh provides modest monthly assistance to over 5 million Californianswith low incomes to purchase food.
CalWORKs
CalWORKs (California Work Opportunity and Responsibility to Kids) is California’s name for the federal program Temporary Assistance for Needy Families (TANF). CalWORKs provides modest cash grants, employment assistance, and critical support services to children and families who are struggling to meet their basic needs.
Head Start
Head Start is a federal program that provides early childhood education and developmental services to low-income children.
WIC
WIC (Special Supplemental Nutrition Program for Women, Infants, and Children) is a federally funded program that provides food benefits, nutritional education, healthcare referrals, and community services to pregnant individuals, new parents, infants, and children under the age of 5.
Pell Grants
Pell Grants are federal aid dollars offered to undergraduate students from low-income households. Unlike loans, these grants do not have to be repaid except under certain circumstances.
What Are the Major Cuts That Will Impact Latinx Californians?
Latinx Californians have propelled California into being the fourth-largest economy in the world, yet many struggle to afford basic needs. The recently passed federal budget includes trillions in cuts to vital programs that support the health and well-being of millions of Latinx Californians. Programs like health care and food assistance help close decades of inequities that Latinx Californians have faced, but they are now facing severe funding cuts. At the same time, increased immigration enforcement actions that often target Latinx communities instill fear and threaten their safety and livelihoods.
Cuts to Medi-Cal and Other Health Care Programs Will Worsen Existing Disparities for Latinx Californians
At the state level, policymakers made significant cuts to Medi-Cal that reversed decades of progress toward affordable and accessible health care for all Californians. This includes freezing Medi-Cal enrollment for undocumented Californians, who are majority Latinx, re-instituting an asset limit test that will lead to substantial coverage losses, and implementing a monthly premium for undocumented Californians and certain other groups of immigrants with low incomes who qualify for Medi-Cal. This unprecedented Medi-Cal premium is a cost that will not apply to any other Medi-Cal members, meaning certain immigrants will have to pay to access health care that is free for other Medi-Cal recipients.
Federal actions may result in 1 million Latinx Californians losing their health insurance. These cuts, along with new burdensome red tape, will harm the health and well-being of millions of Californians, forcing them to make impossible choices between their health care and economic security.
Harmful provisions in the state budget targeting immigrants will only increase health inequities. Health care coverage is already an area where Latinx Californians face large disparities. Approximately 14% of Latinas and 19% of Latinos do not have health insurance, which are both the highest rates in the state for their respective gender.
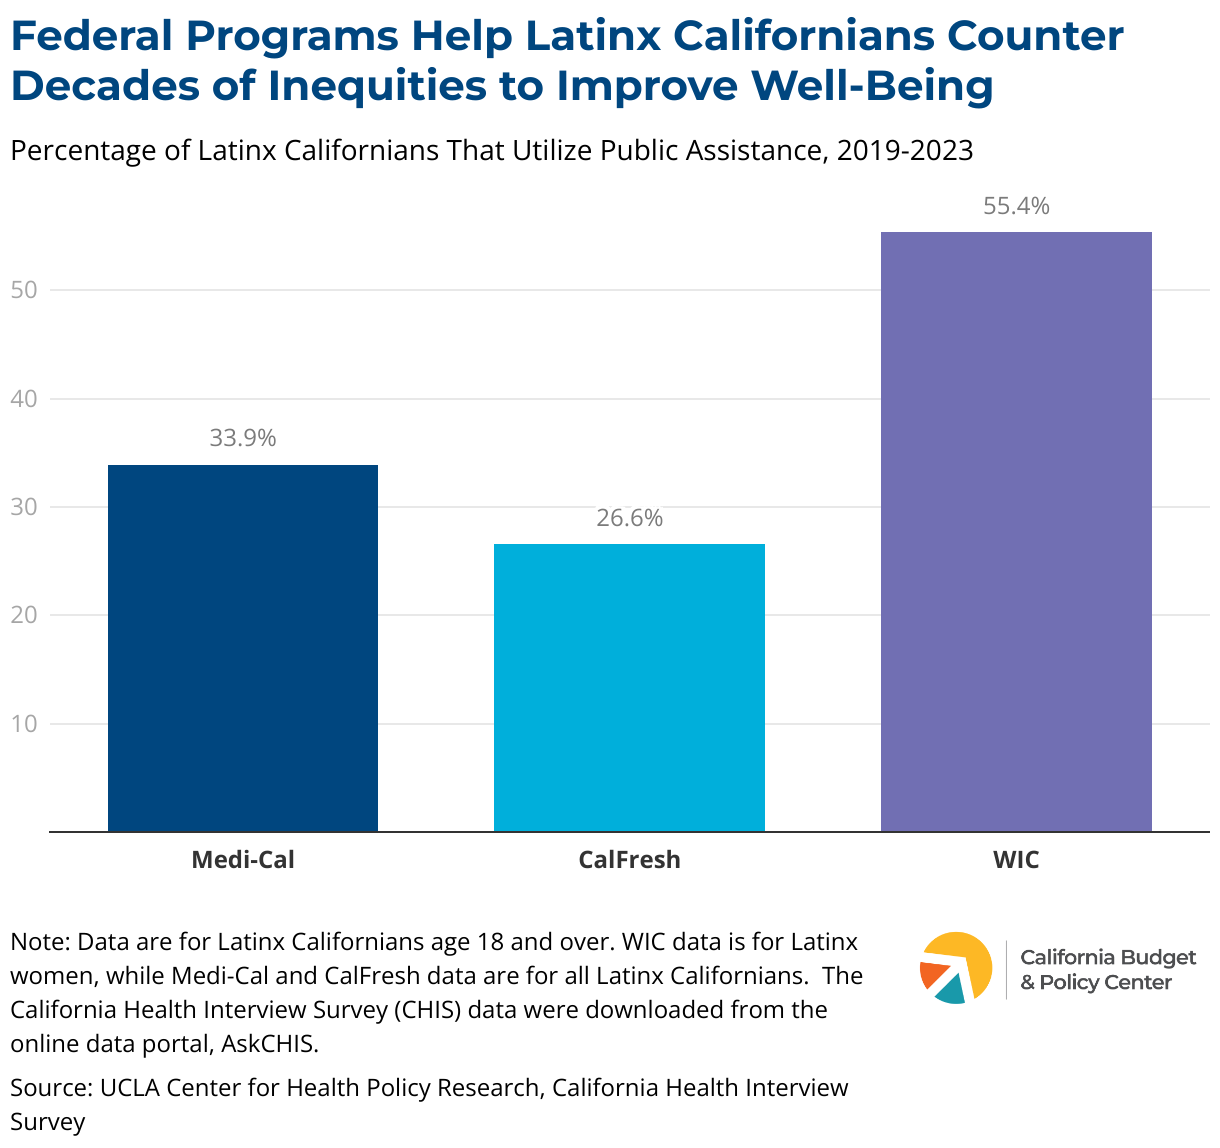
Latinx Californians’ Ability to Afford Food and Other Necessities is Under Threat
Access to affordable food is critical for living healthy lives. Over 1 in 4, or 27% of, Latinx Californians receive food assistance through CalFresh, and almost 1 in 3, or 30%, of Latinas receive this assistance. Additionally, over half — or 55% — of Latinas participate in WIC, which helps ensure young children are healthy. Recent federal budget cuts slashed billions of dollars in funding for SNAP, resulting in CalFresh losing between $1.7 billion and $3.7 billion annually in federal funding, and will impose burdensome requirements on recipients of food assistance. Funding for WIC will be decided during the federal appropriations process and it is not yet certain whether the program will be funded at current levels.
New time limit expansions, cost-shifts to the state, cuts in benefit levels, and restrictions on some immigrants’ eligibility for CalFresh will all directly harm the ability of many Latinx Californians to feed themselves and their families. At least 2 in 5 Latinas and Latinos (42% and 41% respectively) are currently not able to afford enough food, and that is with CalFresh food assistance programs at their previous funding levels. With the state set to lose out on billions of dollars in funding for food assistance programs, Latinx Californians will face even steeper disparities in their ability to afford food for themselves and their families.
Only 72% of Latinas receive adequate prenatal care, so the federal appropriations process will be critical in ensuring WIC’s funding is preserved.Maintaining funding levels for WIC is crucial in helping to combat the disparities Latinas face in accessing adequate prenatal care.
H.R. 1 and the Federal Budget
H.R. 1, the harmful Republican mega bill passed in July 2025, will deeply harm Californians by cutting funding for essential programs like health care, food assistance, and education.
See how California leaders can respond and protect vital supports.
Access to Affordable Child Care is Critical For Latinx Families
Child care is critical for both parents and children in California so that children can grow and learn and parents can stay employed or continue their education to support themselves and their families. However, the high cost of this care threatens to push families, especially those headed by Latinas, deeper into poverty. A Latina single mom in California with an infant and school-age childspends over 70% of her income on child carewithout access to a state-subsidized program or Head Start — more than any other racial or ethnic group. A recent notice from the Department of Health and Human Services restricts certain immigrants’ eligibility to access Head Start.
Restricting access to Head Start will take away an effective and affordable child care program for many Latinx Californians. Latinx children are disproportionately eligible for subsidized child care; therefore, when the supply of affordable child care is reduced (which will happen with restrictions on who is eligible for Head Start), Latinx families are more likely to be burdened. The additional restrictions may also lead to a chilling effect, which can discourage qualified immigrants from enrolling due to distrust in government agencies that may not be able to protect their personal information. This could make it even harder for some Latinx Californians to afford sending their children to child care.
Federal Policy
The federal government plays a major role in shaping California’s budget, economy, and the well-being of its people.
Learn how federal policies shape California’s budget, economy, and vital programs — and how state leaders can respond to protect and support Californians.
A Key Federal Program To Help Latinx Californians Afford College is Under Threat
All people in California — including Latinx Californians — should be able to afford higher public education and access career pathways so they can achieve economic security. Unfortunately, this is not the reality for the large majority of Latinx Californians.Only 17% of Latinas, and just 14% of Latinos, have at least a Bachelor’s degree, which are the lowest percentages in the state, respectively. Research in 2021 found that despite comprising nearly 55% of students in K-12 education, Latinx students constituted only 43% of public higher education students. In addition, Latinx students graduate on-time at disproportionately lower levels across different institutions, ranging from 18% to 36% in California State Universities (CSU) and 51% to 53% in University of California (UC) institutions, which results in higher expenses due to the longer amount of time that students have to spend in order to graduate.
For Latinx Californians who are able to attend college, Pell Grants play a crucial role in helping them attend college. These grants supported 40% of Latinx Californians, or over 400,000 students, in attending college across the University of California, California State University, and California Community College systems. However, President Trump has proposed significant cuts to higher education funding, which include reducing the maximum federal Pell Grant award, and his administration is actively dismantling the Department of Education.
Threats to higher education and Pell Grants could make it impossible for hundreds of thousands of Latinx Californians to afford going to college. Pell Grants provide an average financial aid award of about $4,500 per year, which means that with in-state tuition at a California State University institution currently at $6,084 per year, Pell Grants cover almost three-quarters of the cost of tuition. These grants are awarded mainly to families with an annual income of less than $20,000, meaning they provide significant aid in helping students attend college. With higher education already being unaffordable for the vast majority of Latinx Californians, decreases in the financial aid that is available threatens the ability of Latinx Californians to access higher education.
Additional federal threats to affordable housing and homelessness programs loom as the appropriations process gets underway. Proposed decreases to Housing and Urban Development funding could mean cuts to already underfunded programs for rental assistance, affordable housing, and community development.
Any cuts to federal housing programs would further jeopardize the stability of housing for Latinas, who already face severe housing insecurity. Racial inequities in housing compound with other racial inequities Latinx Californians face in the state, which have resulted in rent comprising over 50% of the median annual earnings of Latinas in the state. Inequities Latinx renters face in the state harm their ability to maintain health, work, and dignified living conditions.
Latinx Californians Face Threats To Their Safety With Increased Immigration Enforcement
Racial profiling tactics are increasingly putting Latinx Californians in the crosshairs as they are targeted with more frequent and intense immigration enforcement operations, violating their human and civil rights.
This unprecedented increase in enforcement also negatively impacts US-born workers: immigrants generate jobs for US-born workers directly as entrepreneurs and indirectly, as research has shown that for every 13 foreign-born workers who leave the labor force because of direct removals and the chilling effect of deportations, 10 US-born workers lose their jobs.
California’s state leaders cannot stand by as the pain of these harmful federal policy choices radiates out across the state. State policymakers should commit to doing all they can to protect vulnerable Californians and ensure access to basic supports like health care and food assistance. This includes adopting common-sense reforms to the tax code, particularly corporate taxes, to raise the revenue needed to protect all Californians and vulnerable communities from deepening hardship.
Increase funding for legal services to protect and support immigrants.
No individual should have to worry about not having some form of legal defense when they are confronted with the risk of being uprooted from their home and separated from their loved ones and neighbors. The existing levels of funding for legal services in California are insufficient to meet the profound and sustained threat that communities across the state are facing. State leaders must match legal service funding levels to meet the moment.
Continue to take legal action against the federal government.
Californians are facing a litany of threats from the federal government, from programs being cut off, to private tax and health care data being shared with immigration enforcement, to the direct kidnapping of community members. The state must implement a comprehensive legal strategy that defends the rights and safety of Californians.
Preserve, and where possible, restore access to health care.
In the near term, state leaders should preserve, and where possible, restore access to health care. This means avoiding additional cuts to Medi-Cal eligibility and prioritizing support for safety-net providers like community clinics and public hospitals that serve a large number of Medi-Cal enrollees and uninsured patients. In the longer term, state policymakers should take action to increase health insurance coverage for Latinx people to ensure that everyone has access to affordable, quality health care.
Expedite expanded access to food assistance.
Under the current timeline, undocumented individuals aged 55 and older would gain access to food benefits in October 2027. However, this commitment was at risk several times this year during budget negotiations. No one should ever have to worry about food insecurity. The state must work to expand access to food to all Californians regardless of status and age as soon as possible. Good nutrition contributes to positive developments in other areas of individuals’ lives.
Accelerate efforts to make college more affordable for Californians.
While the state budget maintains current financial aid caseload levels, it does not address longstanding affordability issues, which may worsen as a result of federal actions and threats to Pell Grants. State leaders could revisit Cal Grant reform as they plan for future budgets to mitigate the harm coming from the federal government on college affordability and access.
Strong, sustained state investments to protect progress and meet urgent housing needs of communities across the state.
California has the resources to ensure ongoing funding for homelessness services and affordable housing development so that all Californians have a safe, stable place to call home. Focus should remain on funding and promoting real, compassionate solutions that aren’t rooted in criminalization, discrimination, or further displacement of unhoused Californians. Proactive efforts can also ensure renters have the protections and resources they need to stay housed, especially during economic hardship or when federal supports are at risk.
Supported by the California Health Care Foundation (CHCF), which works to ensure that people have access to the care they need, when they need it, at a price they can afford. Visit chcf.org to learn more.
There was a problem processing your signup. Please try again. Or contact us
Please check your email to confirm your signup.
This website uses cookies to analyze site traffic and to allow users to complete forms on the site. The California Budget & Policy Center does not share, trade, sell, or otherwise disclose personal information. By using our website you agree to our Privacy Policy.