This report was co-authored by Amy M. Traub, Senior Researcher and Policy Analyst at the National Employment Law Project.
When Californians are out of work, unemployment insurance (UI) should help them make the rent, put food on the table, and cover other basic needs until they can find a new job. During the worst days of the pandemic, millions of jobless workers across the state relied on UI benefits to make ends meet, supporting both their families and California’s economy until it could thrive again. UI is also critical for jobless workers during periods of economic growth: In May 2024, 379,955 California workers — laid off from industries including manufacturing and information — counted on UI as they sought new employment.1Employment Development Department, California Employers Gained 43,700 Nonfarm Payroll Jobs in May 2024, accessed June 21, 2024, https://edd.ca.gov/en/about_edd/news_releases_and_announcements/unemployment-may-2024/.
Yet without the federal supplements that were available during the pandemic downturn, California workers received an average UI benefit of just $368.53 a week in 2023, less than the income needed to afford fair market rent in any county in the state.2Average benefit amount based on US Department of Labor Employment and Training Administration, Unemployment Insurance Data, https://oui.doleta.gov/unemploy/data_summary/DataSum.asp; housing affordability based on National Low Income Housing Coalition, Out of Reach: The High Cost of Housing, 2023, https://nlihc.org/sites/default/files/oor/California_2023_OOR.pdf using an affordability standard of 30% of income for rent. At the same time, millions of California workers, including more than a million immigrant workers, are excluded from accessing unemployment insurance entirely.3Legislative Analyst’s Office, Extending Unemployment Insurance to Cover Excluded Workers, (March 28, 2023), https://lao.ca.gov/handouts/state_admin/2023/Unemployment-Insurance-032823.pdf.
To strengthen and expand UI to adequately support workers and the economy, California must address the severe and chronic underfunding of the UI trust fund, which has created a structural deficit and $19.8 billion in debt for the state’s UI system. The underlying problem is California’s deficient UI financing: For decades policymakers have not required businesses to cover the true cost of the unemployment benefits their workers need. Instead, the state taxes employers on only the first $7,000 of each employee’s pay, a dramatically lower wage base than most other states.
This report details how workers, employers, and the economy as a whole are paying a steep price for California’s inadequate UI financing system. It explores how both raising the taxable wage base and changing the state’s experience rating system will be necessary to strengthen and stabilize UI to better serve workers, employers, and the economy.
Unemployment Insurance is a Lifeline for California, But Low Benefits and Exclusions Undermine Its Effectiveness
The joint federal-state UI system was established in the wake of the Great Depression to protect workers and their families against the loss of employment income, to bolster the economy during economic downturns by supporting consumer demand, and to ensure jobseekers are not forced into substandard jobs that could broadly depress wages and degrade working conditions.
Today, economists recognize that UI also plays an important role in improving job matches, enhancing the overall functioning of the labor market, and helping employers match with workers who have the right skills, improving their efficiency.4Ammar Farooq, Adriana D. Kugler, and Umberto Muratori, “Do Unemployment Insurance Benefits Improve Match Quality? Evidence From Recent US Recessions,” National Bureau of Economic Research (2020), https://www.nber.org/system/files/working_papers/w27574/revisions/w27574.rev0.pdf. By giving workers time to match with more suitable jobs, UI also contributes to higher wages and greater job satisfaction when they find new work.5Nick Gwyn, State Cuts Continue to Unravel Basic Support for Unemployed Workers (Center on Budget and Policy Priorities, June 27, 2022), https://www.cbpp.org/research/state-budget-and-tax/state-cuts-continue-to-unravel-basic-support-for-unemployed-workers; Adriana D. Kugler, Umberto Muratori, and Ammar Farooq, The Impacts of Unemployment Benefits on Job Match Quality and Labour Market Functioning (Centre for Economic Policy Research, February 7, 2021), https://cepr.org/voxeu/columns/impacts-unemployment-benefits-job-match-quality-and-labour-market-functioning. Yet UI’s ability to fulfill any of these functions is weakened by California policymakers’ failure to raise the state’s low benefit levels or to include the significant numbers of workers who are locked out of the system entirely.
Unemployment benefits remain critical to workers who receive them. In 2022, UI prevented more than 400,000 people nationwide, including 116,000 children, from experiencing poverty.6Amy Traub, Unemployment Insurance Had Less Capacity to Cut Poverty in 2022 (National Employment Law Project, 2023), https://www.nelp.org/insights-research/unemployment-insurance-had-less-capacity-to-cut-poverty-in-2022/. Even for workers not facing poverty, receiving unemployment benefits reduces hardship and broadly improves the well-being of households, including recipients’ financial stability and mental health.7Patrick Carey, et al., “Applying for and Receiving Unemployment Insurance Benefits During the Coronavirus Pandemic,” Monthly Labor Review, US Bureau of Labor Statistics, September 2021, https://doi.org/10.21916/mlr.2021.19.
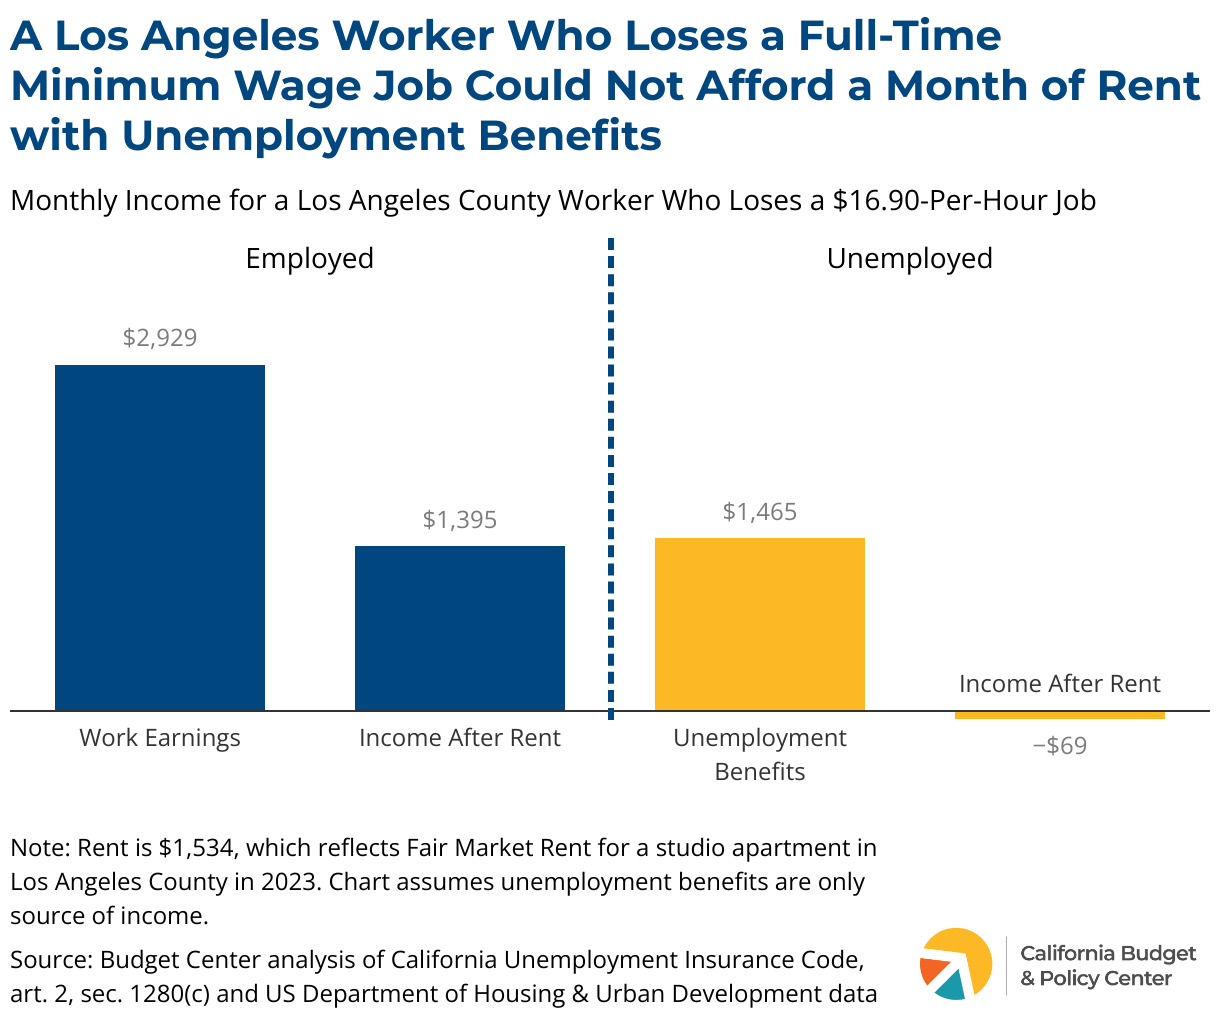
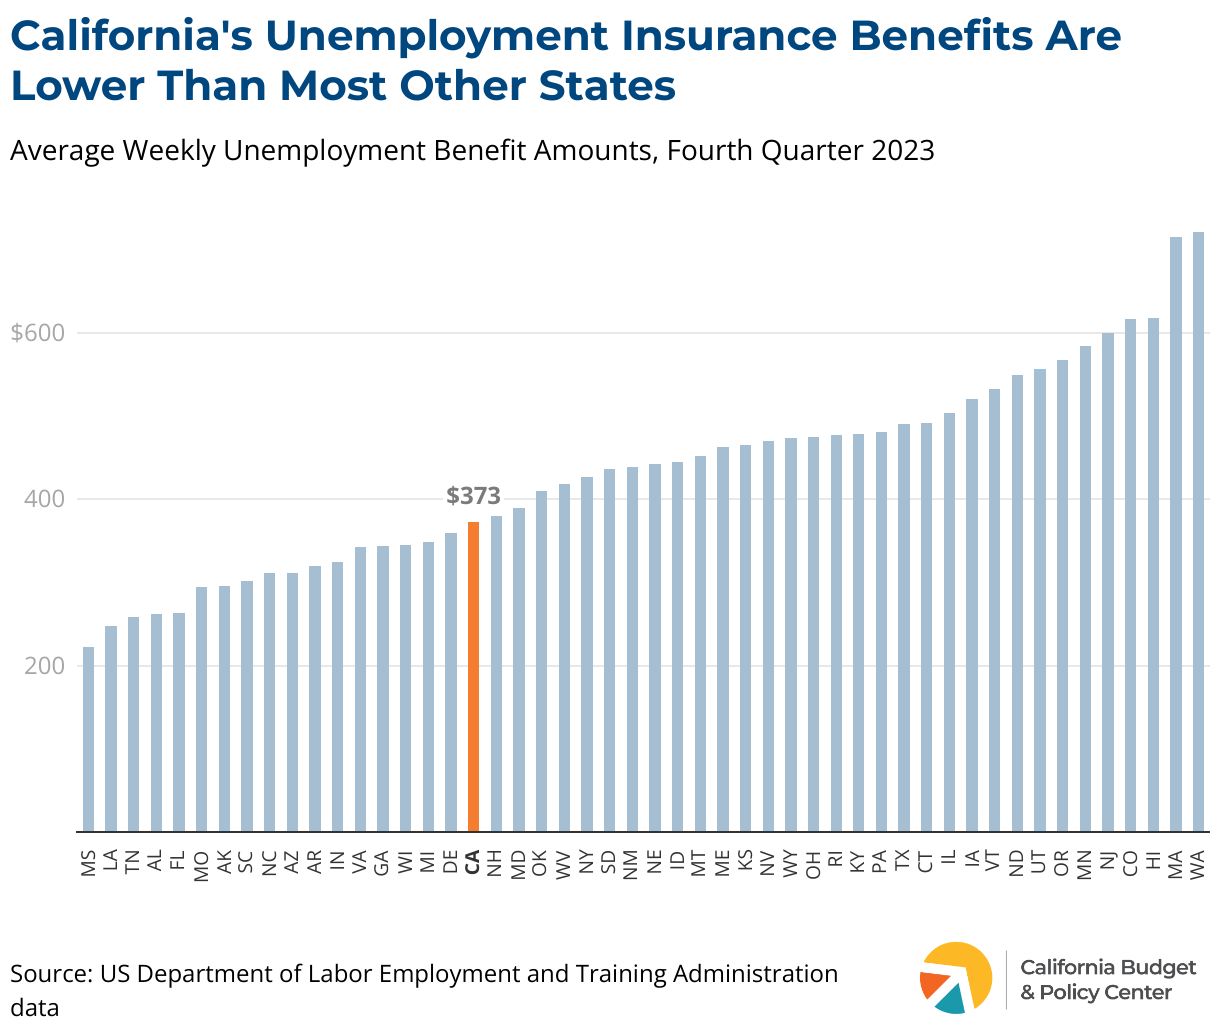
Yet benefits in California have not been raised in nearly two decades. With an average benefit of just $368.53 a week in 20238US Department of Labor, Employment and Training Administration, Unemployment Insurance Data, https://oui.doleta.gov/unemploy/data_summary/DataSum.asp., UI benefits no longer provide enough money for Californians — particularly those with low incomes — to meet the rising cost of living while seeking employment. As the California Budget & Policy Center pointed out earlier this year, a worker who loses a full-time minimum wage job (at $16.90-per-hour in Los Angeles County) receives just $1,465 in monthly unemployment benefits, which falls $69 short of covering rent for a studio in Los Angeles priced at Fair Market Rent.9Alissa Anderson and Hannah Orbach-Mandel, California Should Increase Unemployment Benefits to Help Workers Meet Basic Needs (California Budget & Policy Center, January 2024), https://calbudgetcenter.org/resources/california-should-increase-unemployment-benefits-to-help-workers-meet-basic-needs/ California’s UI benefits are significantly lower than other Western states, including Washington ($703.79 per week on average), Oregon ($543.81 per week), Nevada ($450.70 per week), and Hawaii ($613.30 per week), as shown in the figure below. California’s low benefits are even more striking considering the state’s higher cost of living.
At just $40 per week, California’s minimum UI benefit — the payment provided to workers who earned the lowest wages before becoming unemployed — is also among the nation’s lowest, falling below the minimum benefits provided by 29 other states. For example, Washington’s minimum benefit is seven times greater than California’s ($295 per week), while Arizona’s minimum benefit is $200 per week, and Oregon’s is $171. In addition, 12 states offer dependent allowances, providing a weekly supplement to UI benefits so that workers with children and other dependents have an additional resource to make ends meet. Despite its low average and minimum benefits, California offers no additional support to unemployed parents and other workers supporting dependents.
Low Unemployment Insurance Benefits Exacerbate Racial and Gender Inequities
Low UI benefits can be especially harmful for workers of color, including American Indian, Black, Latinx, and Pacific Islander Californians — particularly women — who are overrepresented in low-paying jobs due to structural racism and sexism.10Jasmine Tucker and Julie Vogtman, When Hard Work Is Not Enough: Women in Low-Paid Jobs (National Women’s Law Center, April 2020), https://nwlc.org/wp-content/uploads/2020/04/Women-in-Low-Paid-Jobs-report_pp04-FINAL-4.2.pdf. Since benefit levels are based on prior wages, low-paid workers tend to receive lower UI benefits. Yet workers who lived paycheck-to-paycheck when they were employed face even greater hardship in trying to cover their expenses on benefits that are a small fraction of their paycheck. At the same time, workers of color typically have fewer financial resources other than UI benefits to draw on during unemployment compared to white workers, as a result of systematic exclusion from wealth-building opportunities over generations.11Angela Hanks, Danyelle Solomon, and Christian E. Weller, Systemic Inequality (Center for American Progress, February 21, 2018), https://www.americanprogress.org/article/systematic-inequality/.
California’s low benefit levels also undercut UI’s ability to fight recessions. This is particularly troubling because a strong UI system is among the most effective tools available to promote economic recovery: According to the International Monetary Fund, each dollar paid in UI benefits during the pandemic generated $1.92 of economic growth as workers and their families were able to continue spending on basic necessities.12Klaus-Peter Hellwig, Supply and Demand Effects of Unemployment Insurance Benefit Extensions: Evidence from US Counties (International Monetary Fund, 2021), https://www.imf.org/en/Publications/WP/Issues/2021/03/12/Supply-and-Demand-Effects-of-Unemployment-Insurance-Benefit-Extensions-Evidence-from-U-S-50112. This powerful impact was achieved because the federal government expanded UI benefits during the pandemic: A $600 a week supplement to regular state UI benefits early in the pandemic (later $300 a week) ensured that unemployed workers could keep spending money, supporting local businesses across the state. The expanded federal benefits also ensured that California jobseekers and their families were able to meet expenses far better than they could by relying solely on the state’s regular UI benefits.
Federal pandemic programs also expanded eligibility for UI benefits to self-employed workers, caregivers, misclassified independent contractors, part-time workers, and many underpaid workers who are typically shut out of California’s regular UI system. By expanding the share of unemployed workers who received support, federal pandemic programs further improved the ability of UI to stabilize the economy.
More than 1 million undocumented workers, who represent over 6% of California's workforce, were, notably, not included in the UI benefit expansions.13University of California Merced Community and Labor Center, Worker Relief: Expanding the Safety Net to Excluded Workers, April 2023, https://clc.ucmerced.edu/sites/clc.ucmerced.edu/files/page/documents/worker_relief_2022_2.pdf. California instituted a Disaster Relief Assistance for Immigrants (DRAI) program to provide limited, one-time financial assistance to unemployed immigrants who were not otherwise eligible for UI benefits. However, the amount of support was grossly inadequate to meet immigrant workers’ needs and fell far short of what other Californians received, with researchers finding that unemployed citizen workers in California were eligible for up to 20 times more aid than the state’s undocumented workers in the first year of the pandemic.14University of California Merced Community and Labor Center, Essential Fairness: The Case for Unemployment Benefits for California’s Undocumented Immigrant Workers, March 2022, https://clc.ucmerced.edu/sites/clc.ucmerced.edu/files/page/documents/essential_fairness.pdf.
Workers who are on strike are also excluded from UI benefits, even though they miss paychecks and risk hardship for exercising their right to collective action. California should consider expanding UI benefits to striking workers, as New York and New Jersey already do.
Now both federal and state emergency programs have expired, and Californians are left with a UI system that does not adequately support jobseekers and still excludes many of them. California’s UI system is not prepared for the next unexpected economic shock or crisis. At a moment when policymakers are increasingly worried that the use of artificial intelligence could push large numbers of workers out of a job, a strong UI system is needed more than ever to support Californians who could be displaced.
A Strong and Effective UI System Requires Adequate Financing: California Needs Major Reforms
Unemployment insurance is funded by state and federal payroll taxes. In general terms, the Federal Unemployment Tax Act (FUTA) funds UI administrative costs and certain special programs, while the State Unemployment Tax Act (SUTA) tax, imposed by states, pays for UI benefits and is used to repay any federal loans made to the state’s UI trust fund (more on this below). SUTA tax revenues are deposited into a trust fund held for each state by the US Treasury.
State unemployment insurance benefits are paid out of each state’s trust fund. If states don’t have sufficient money in the trust fund to pay UI benefits, they can take out a federal loan. That’s what California and 21 other states did as they struggled to pay out benefits to tens of millions of laid off workers in the early days of the COVID-19 pandemic.15US Department of Labor, Office of Unemployment Insurance Division of Fiscal and Actuarial Services, State Unemployment Insurance Trust Fund Solvency Report 2021, March 2021,https://oui.doleta.gov/unemploy/docs/trustFundSolvReport2021.pdf. Although the federal government fully paid for expanded UI benefits during the pandemic economic crisis, California still faced a record $35 billion in costs for regular UI benefits. The state is still paying back those costs today, and currently faces a trust fund debt of $19.8 billion.16US Department of Labor, Office of Unemployment Insurance Division of Fiscal and Actuarial Services, State Unemployment Insurance Trust Fund Solvency Report 2024, March 2024, https://oui.doleta.gov/unemploy/docs/trustFundSolvReport2024.pdf.
Yet the extraordinary costs of the pandemic are only the latest and most dramatic manifestation of an ongoing structural deficit in California’s UI financing system. In January 2020, before the pandemic triggered record job loss, California already had the most underfunded UI system of any state.17US Department of Labor, Office of Unemployment Insurance Division of Fiscal and Actuarial Services, State Unemployment Insurance Trust Fund Solvency Report 2020, March 2020, https://oui.doleta.gov/unemploy/docs/trustFundSolvReport2020.pdf. Even today, with a relatively low unemployment rate hovering around 5%, California does not raise enough revenue to pay for current UI benefits, much less pay down its trust fund debt.
In addition to regular SUTA taxes, California employers are paying a 15% tax surcharge to pay back the trust fund loan, but this additional revenue is still not sufficient to reduce the principal. The state Employment Development Department projects that at the current rate of repayment, the outstanding federal UI loan balance will grow to nearly $22 billion in 2025.18Employment Development Department, May 2024 Unemployment Insurance (UI) Fund Forecast, May 2024, https://edd.ca.gov/siteassets/files/unemployment/pdf/edduiforecastmay24.pdf.
California must overhaul its UI revenue system to adequately support unemployed workers and the economy, pay down its debt, and build a reserve for future economic downturns.
Failing to Modernize UI Financing Costs All Californians
California’s underfunded UI system imposes steep costs across the state. As described above, job seekers face hardship as they struggle to get by on low UI benefits, even as many jobless workers are excluded. At the same time, meager benefits may not be enough to power the state’s economic recovery in the next downturn. Yet the costs are even more widespread: Because the interest on the trust fund debt has traditionally been paid out of the state’s general fund, all California residents will ultimately pay a price.
Due to rising interest rates, California owed $484 million in interest on UI debt in 2024 at a time when the state was facing a significant, multi-year budget shortfall. Although California was able to use internal borrowing to cover the interest payment due in 2023, there were fewer such options available in 2024 and the state’s final budget agreement covered most of the interest payment ($384 million) with General Fund dollars, taking significant resources away from other priorities. Looking ahead to future years, California will continue to owe interest every year that it maintains trust fund debt, and these payments will significantly reduce funding available to invest in other critical priorities, including health care, child care, affordable housing, and environmental protection.
And while employers may express concern about increased UI taxes in a modernized system, they also face a direct tax penalty if no action is taken: In addition to the surcharge to pay back the loan, California employers will also face a reduction in the Federal Unemployment Tax Act (FUTA) tax credit, effectively hiking their taxes as long as the trust fund debt continues to go unpaid.
Raising and Indexing the Taxable Wage Base Is Critical to Improving UI Financing
Failure to raise revenue is at the heart of California’s UI financing crisis. State policymakers have been reluctant to mandate that employers contribute the funds needed to finance a strong and effective UI system. As a result, California taxes employers on only the first $7,000 of each employee’s pay.
What Is the Taxable Wage Base and Why Is It Important for Understanding How Unemployment Insurance Benefits Are Funded?
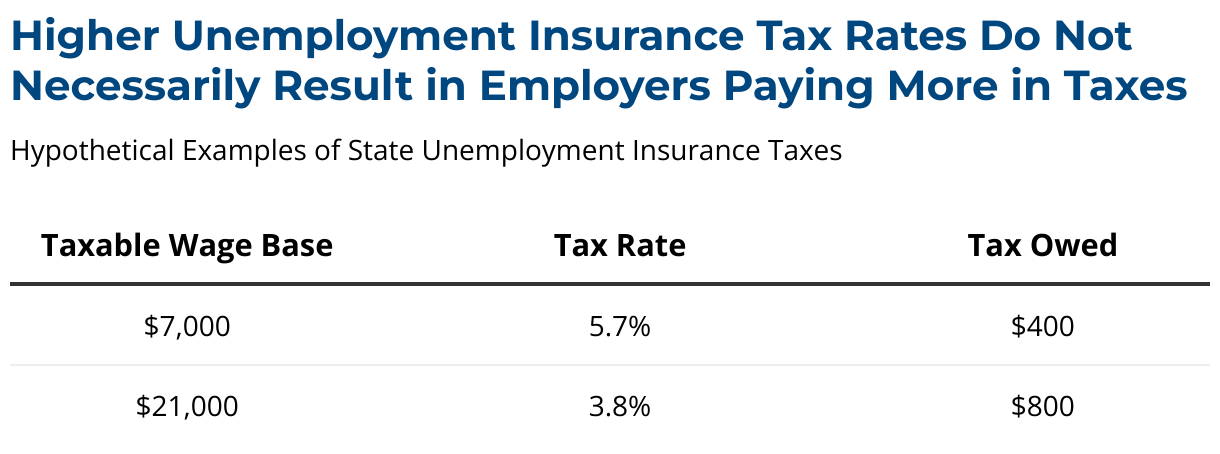
State unemployment benefits are financed through state payroll taxes paid by employers. There are two basic factors that determine how much employers pay in those taxes: the tax rate and the taxable wage base. The tax rate is determined for each employer based on tax rate schedules outlined in state law. The rate for a particular employer is then applied to a taxable wage base equal to each of their employee’s first $7,000 in annual earnings to determine how much tax the employer owes.
For example, new employers are assigned a state payroll tax rate of 3.4%. If a new employer has three employees all earning $40,000 annually, the employer would calculate the payroll tax they owe by multiplying 3.4% by $7,000 for each employee ($238), for a total annual tax of $714 for all three employees. If the taxable wage base were higher, say $21,000, the same amount of revenue could be raised with a much lower tax rate (1.1%) because a greater proportion of each worker’s wages would be subject to taxation. Alternatively, by maintaining a 3.4% tax rate, the higher taxable wage base would raise three times as much revenue ($2,142 for all three employees).
When comparing state payroll taxes across states, it’s important to consider both the tax rate and the taxable wage base to which that rate is applied. A state with relatively high tax rates does not necessarily result in employers in that state paying more in taxes than states with lower tax rates. For example, a 5.7% rate would generate a tax of $400 if applied to a base of $7,000. But a much lower rate of 3.8% would generate twice as much tax ($800) if applied to a base of $21,000.
This low fixed amount, known as the taxable wage base, not only raises inadequate revenue but raises it inequitably. The low taxable wage base means that California taxes a higher proportion of the wages of low-paid workers and imposes the highest effective tax rates on small businesses while failing to keep up with wage growth and taxing a far smaller share of wages than most other states. Raising the taxable wage base and indexing it to the state’s average wages is essential to strengthen the UI system.
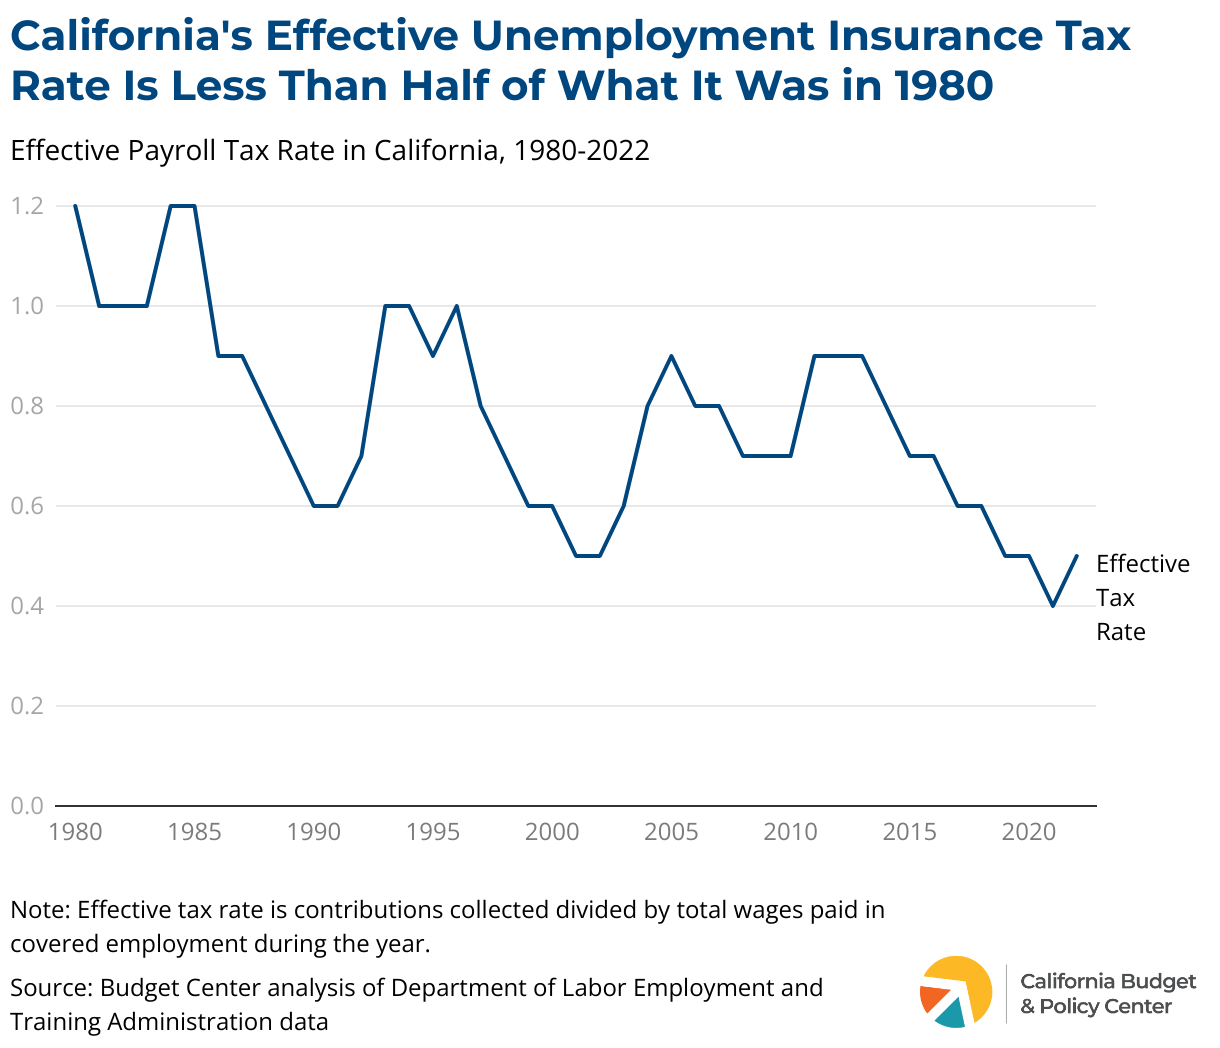
Wages have increased significantly over the last 40 years, yet California’s taxable wage base has remained fixed, lagging further and further behind. While the state’s taxable wage base of $7,000 was equivalent to full-time wages at the federal minimum wage in 1982, it was less than three months of full-time work at the minimum wage in 2022 in California. By 2022, California’s effective UI tax rate was less than half of what it had been in 1980, as the figure below illustrates.
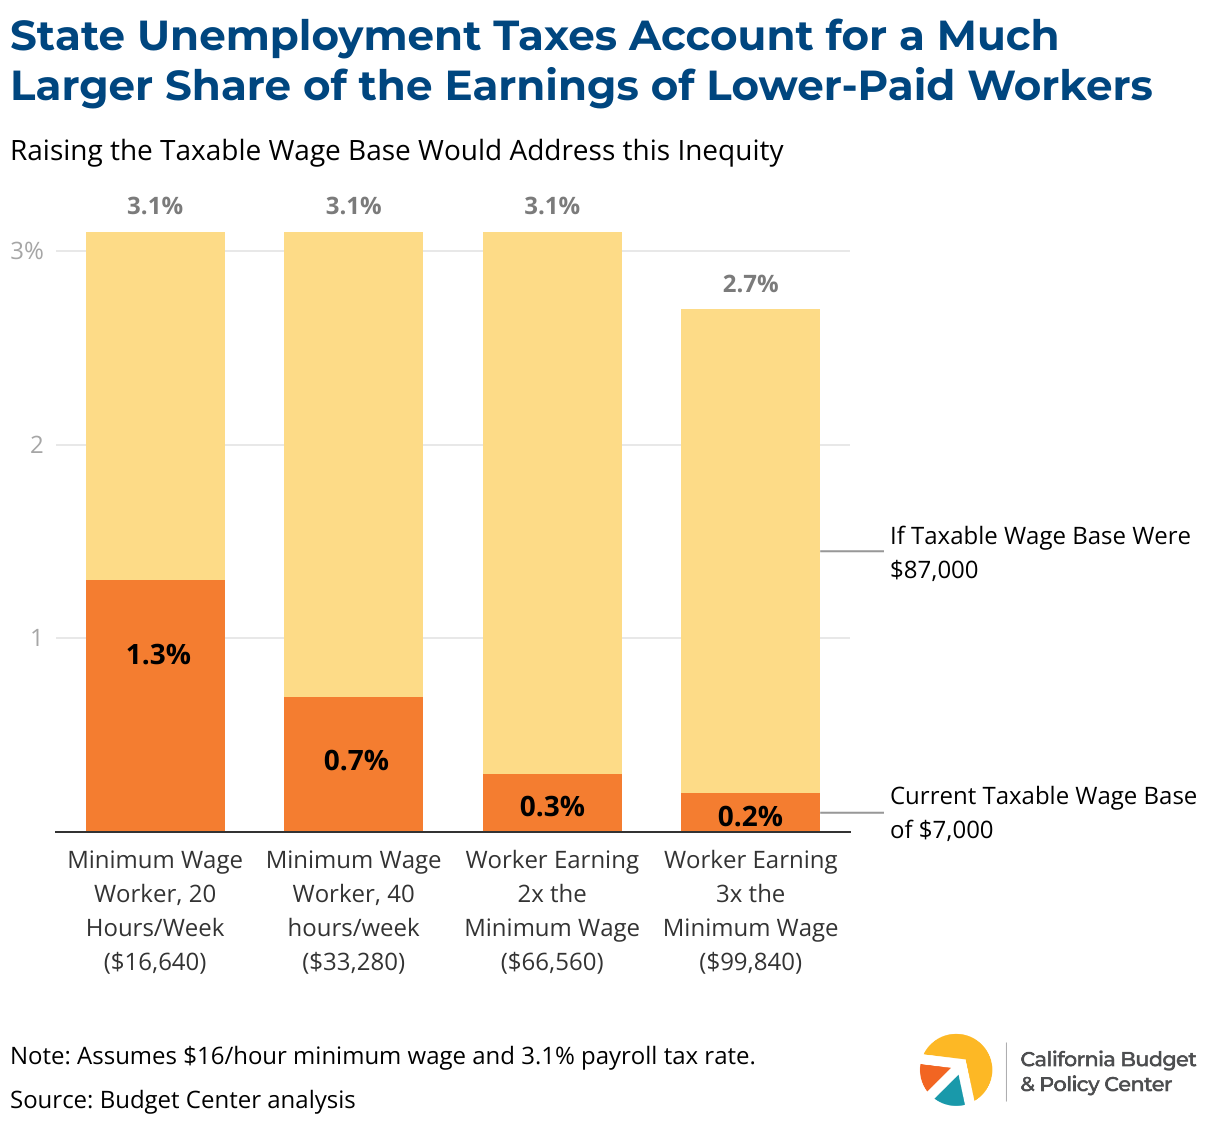
California’s UI financing system disproportionately taxes the employers of low-paid and part-time workers because the state’s taxable wage base is so low. Take, for example, employers subject to a state UI tax rate of 3.1%, which is the average rate paid by employers in 2023. Since most workers earn more than the state’s taxable wage base of $7,000, employers effectively pay $217 in state UI taxes per worker. But this represents a much larger share of employers’ labor costs for low-paid and part-time workers. For instance, $7,000 amounts to 1.3% of the earnings paid to half-time minimum wage workers, compared to 0.7% of the earnings paid to full-time minimum wage workers and just 0.2% of the earnings of workers paid three times the minimum wage, as the figure below shows. Researchers find that this creates disincentives to hire part-time workers in the first place, leading to fewer employment opportunities, which would impact workers who benefit from the flexibility of part-time work or who rely on additional earnings to make ends meet.19Mark Duggan, Audrey Guo, and Andrew C. Johnston, Would Broadening the UI Tax Base Help Low-Income Workers? (IZA Institute for Labor Economics, January 2022), https://docs.iza.org/dp15020.pdf; Po-Chun Huang, “Employment Effects of the Unemployment Insurance Tax Base,” The Journal of Human Resources, 59, no.4 (March 2022) https://doi.org/10.3368/jhr.0719-10316R2. Raising the taxable wage base would help to address these inequalities.
Small businesses also bear a disproportionate tax burden as a result of California’s low taxable wage base for UI.
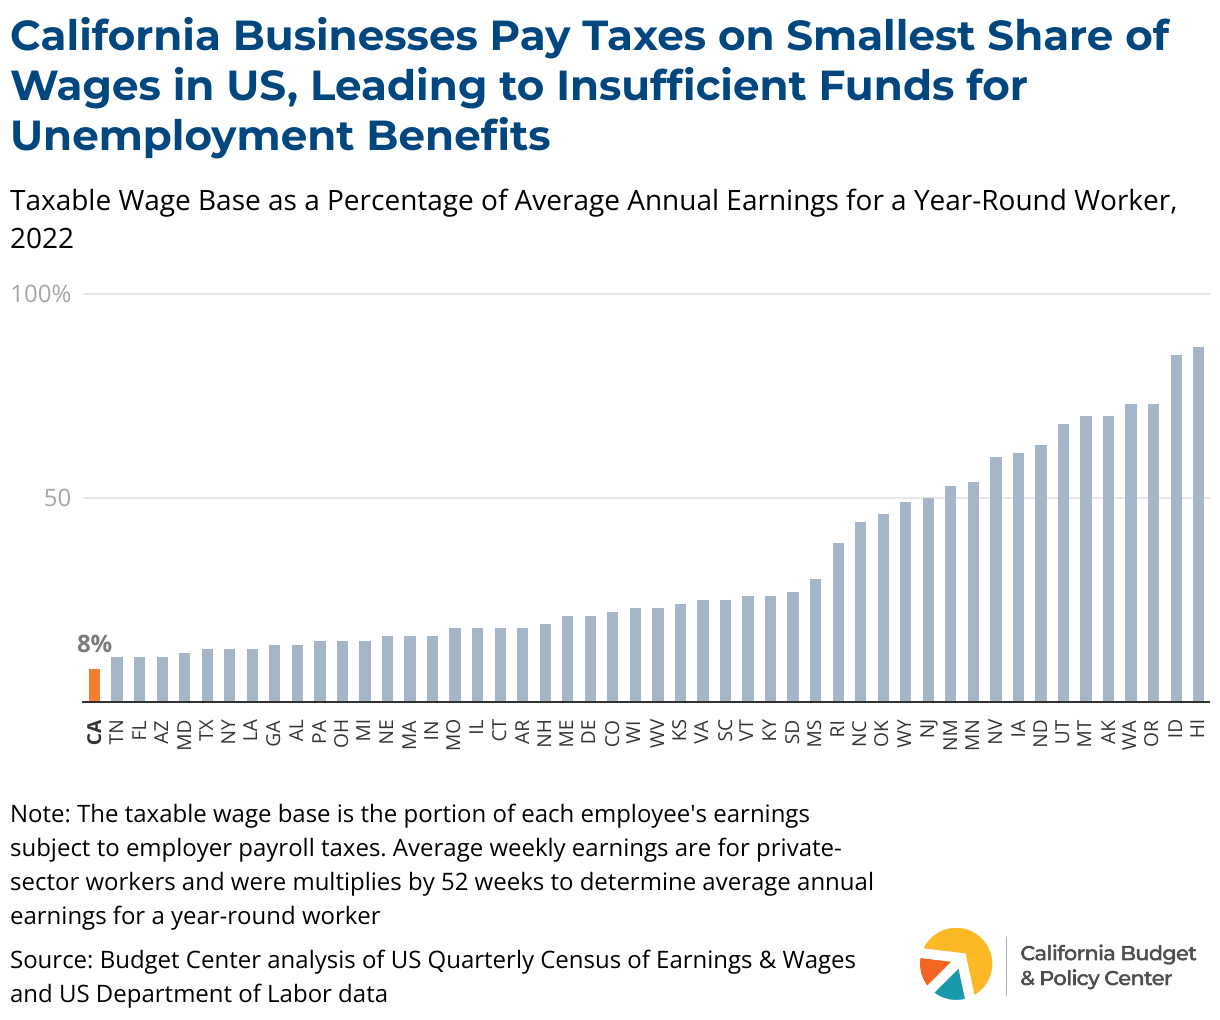
Raising California’s taxable wage base is not a pie-in-the-sky idea. In fact, 94% of US states already have a higher taxable wage base than California, including Washington State with a taxable wage base of $68,500 in 2024, Oregon ($52,800), Nevada ($40,600) and Hawaii ($59,100).20US Department of Labor, Employment and Training Administration, Significant Provisions of State Unemployment Insurance Laws Effective January 2024, https://oui.doleta.gov/unemploy/content/sigpros/2020-2029/January2024.pdf. These states not only tax a much higher share of payrolls than California, but their wage base is indexed to the state’s average weekly wage so that it adjusts automatically each year as wages rise, providing far more reliable financing than California’s low fixed rate. As the figure below shows, businesses in California actually pay taxes on a smaller share of wages than any other state, with just 8% of average annual earnings taxed. California’s low, fixed taxable wage base leads it to raise far less UI revenue than the state needs.
California Must Shift to Forward Financing of UI Benefits and Reform Experience Rating
Raising and indexing California’s taxable wage base is essential to ensuring adequate UI financing, but that alone will not be sufficient to sustainably fund the system because of the structurally flawed mechanism that determines UI tax rates in California.
California has seven employer contribution rate schedules that operate to increase state UI tax rates when the balance of the state’s UI trust fund is low and to reduce rates when the trust fund has more funding.21Employment Development Department, California System of Experience Rating, DE 231Z Rev. 17, (6-22), https://edd.ca.gov/siteassets/files/pdf_pub_ctr/de231z.pdf. This “pay-as-you-go” mechanism is meant to increase revenues at the moment they are needed, but it produces two perverse outcomes. First, by hiking tax rates during economic downturns (when more workers are claiming UI benefits and the trust fund balance falls), the system compels businesses to pay higher taxes during the most difficult economic times, when their own resources are most depleted. Raising business costs during recessions undermines the ability of UI to promote economic recovery. Second, by lowering tax rates as the trust fund balance begins to recover, this system makes raising additional revenue difficult. If California were to increase its taxable wage base without fixing the “pay-as-you-go” mechanism, employer tax rates would automatically fall as soon as the trust fund balance began to improve, making it more difficult to reach and maintain solvency.
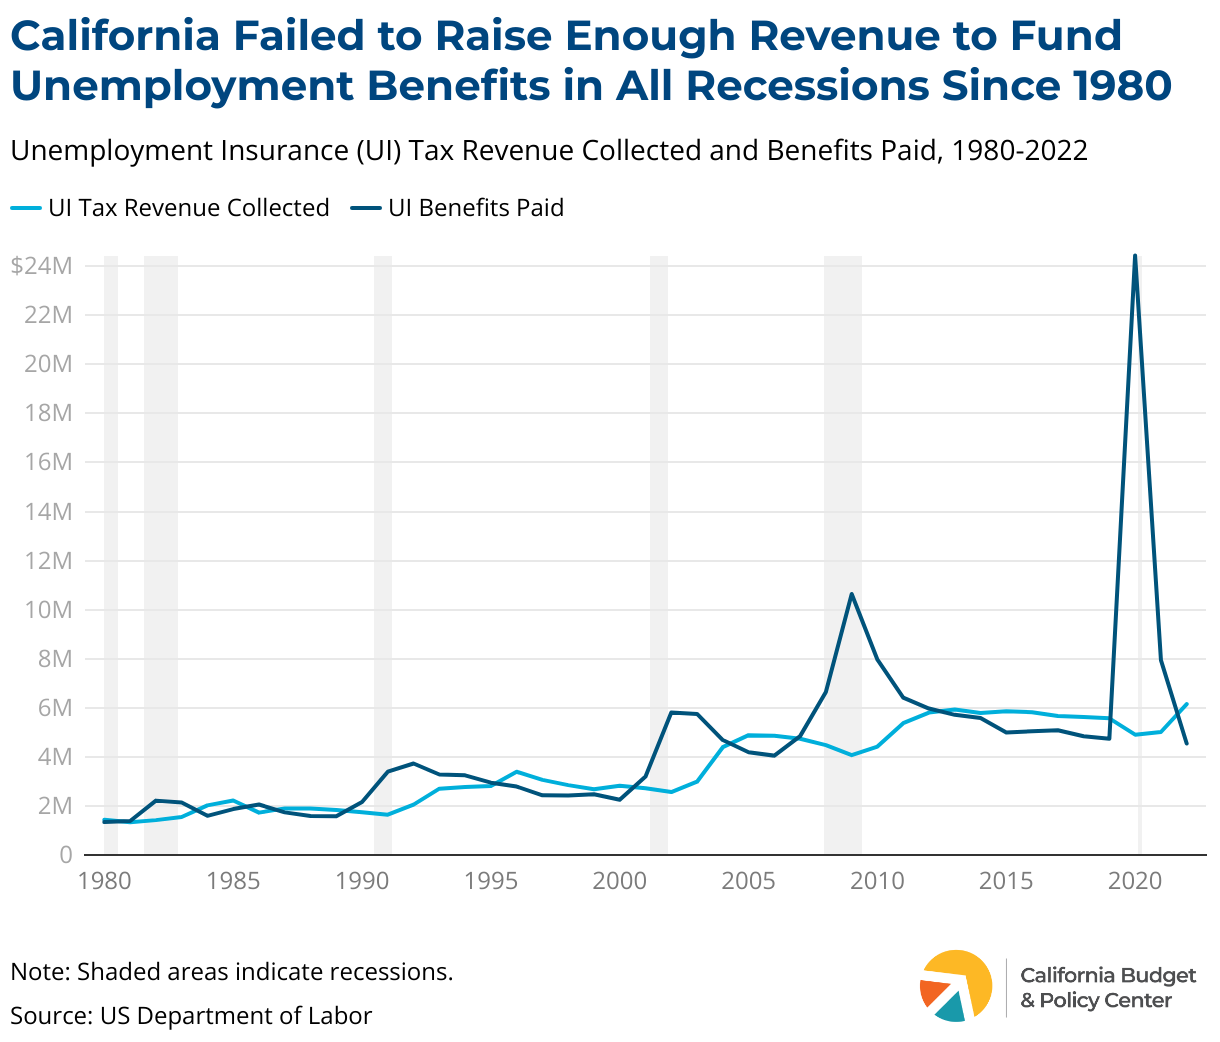
The weakness of pay-as-you-go financing is evident with a look at California’s history: As the figure below indicates, the state failed to raise sufficient revenue to fund UI benefits in every recession since 1980.
The alternative to California’s pay-as-you-go financing mechanism is a forward-funded system designed to take in more revenue than it pays out during periods of low unemployment. Forward funding enables state UI systems to build up sufficient reserves during periods of economic growth to pay benefits during economic downturns, when large numbers of workers are laid off and seeking unemployment benefits. The US Department of Labor’s UI Trust Fund solvency standards are designed to encourage this type of forward funding.22US Department of Labor, Office of Unemployment Insurance Division of Fiscal and Actuarial Services, State Unemployment Insurance Trust Fund Solvency Report 2024, March 2024, https://oui.doleta.gov/unemploy/docs/trustFundSolvReport2024.pdf. Numerous other states, including Oregon, use a forward-funding mechanism to put their UI systems on more stable financial footing.23State of Oregon Employment Department Oregon Employment Department Announces 2024 Rates for Paid Leave Oregon and Unemployment Insurance, November 2023, https://www.oregon.gov/employ/NewsAndMedia/Documents/2023-11-Tax-Contribution-Rate-Notice.pdf.
The mechanism for determining each individual employer’s UI tax rate is also flawed and needs to be reformed. In general, private employers are assigned a tax rate based on their experience with unemployment — that is, their history of laying off workers who then claim unemployment benefits.24New employers are initially assigned a rate of 3.4%, which is then adjusted after 2-3 years based on their experience rating. Additionally, public and nonprofit employers may choose to finance UI benefits on a dollar-for-dollar reimbursement basis instead of being subject to experience rating. Employment Development Department, California System of Experience Rating, DE 231Z Rev. 17 (6-22), https://edd.ca.gov/siteassets/files/pdf_pub_ctr/de231z.pdf; Employment Development Department, 2024 California Employer’s Guide, DE 44 Rev. 50 (1-24), 9, https://edd.ca.gov/siteassets/files/pdf_pub_ctr/de44.pdf. This system, known as “experience rating,” is required by the federal government, but states have considerable flexibility in selecting specific experience rating methods. In California, an employer’s experience rating is determined by a formula that takes into account their contributions into the trust fund and the UI benefits paid to their former workers.
There are two unintended consequences of this approach to experience rating. First, because employers’ contribution rate increases when their former employees claim UI benefits, employers have an incentive to discourage workers from applying for benefits, provide misinformation about eligibility, and dispute UI benefit claims. Second, this approach to experience rating makes raising the taxable wage base, on its own, a less effective strategy for improving UI financing. This is because increasing the taxable wage base would improve employers’ experience rating and automatically decrease their contribution rates (all else being equal), effectively limiting the amount of revenue that could be raised.
One potential alternative to this system is an experience rating system based on quarterly changes in the hours employees work for a given employer, regardless of whether these workers claim UI benefits.25Josh Bivens et al., Reforming Unemployment Insurance (Center for American Progress, Center for Popular Democracy, Economic Policy Institute, Groundwork Collaborative, National Employment Law Project, National Women’s Law Center, and Washington Center for Equitable Growth, June 2021), 36, https://files.epi.org/uploads/Reforming-Unemployment-Insurance.pdf. This would remove the incentive for employers to discourage or dispute benefit claims and would make increasing the taxable wage base more effective at shoring up the trust fund while supporting stronger benefits and broader eligibility.
Additionally, California could explore adopting this alternative experience rating system in combination with a method of assigning employer tax rates based on desired revenue targets, which researchers find is a highly effective strategy for improving UI financing.26A comprehensive analysis of state UI financing systems prepared by the Urban Institute for the US Department of Labor concluded that this approach, called “array allocation,” in combination with indexing the taxable wage base to wage growth were two key factors supporting UI trust fund adequacy. The analysis also suggested that states using array allocation have more stability in tax rates from year to year, leading to more predictability for both employers and the UI trust fund. Wayne Vroman et al., A Comparative Analysis of Unemployment Insurance Financing Methods (Urban Institute, December 2017), xv, 20, 42-43, 46, https://www.dol.gov/sites/dolgov/files/OASP/legacy/files/A-Comparative-Analysis-of-Unemployment-Insurance-Financing-Methods-Final-Report.pdf. Finally, California should consider how app corporations like Uber, Lyft, and DoorDash, which use technology to set and control working conditions, short-change California’s UI system by misclassifying employees as independent contractors, circumventing traditional labor laws and taxes. A study from the UC Berkeley Labor Center finds that If Uber and Lyft had treated workers as employees, these two corporations alone would have paid $413 million into the state’s UI trust fund between 2014 and 2019.27Ken Jacobs and Michael Reich, What Would Uber and Lyft Owe to the State Unemployment Insurance Fund? (Institute of Research on Labor and Employment, University of California, Berkeley, May 2020), https://laborcenter.berkeley.edu/pdf/2020/What-would-Uber-and-Lyft-owe-to-the-State-Unemployment-Insurance-Fund.pdf.
Conclusion
California’s UI system is a critical piece of social infrastructure and could become an engine of economic dynamism for the state, enabling workers, employers, and the economy to thrive. To achieve this vision, policymakers must stabilize the state’s UI finances by raising the taxable wage base and shifting to a forward-financing mechanism, providing the revenue needed to support California jobseekers with adequate benefits and expand assistance to workers who are currently shut out of the system.