key takeaway
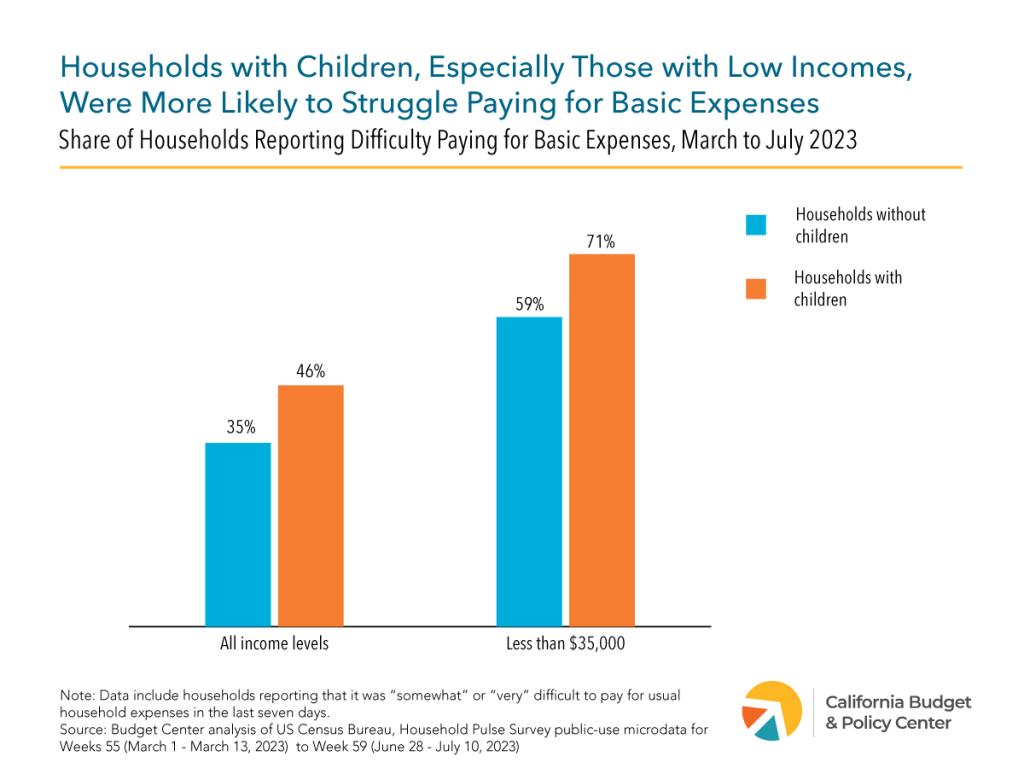
California businesses pay taxes on the smallest share of wages in the United States, leading to insufficient funds for unemployment benefits.
Unemployment benefits provide a critical safety net for many workers who lose their jobs, helping them to support their families while they search for new employment. Millions of Californians turned to unemployment benefits after losing work due to the economic effects of the COVID-19 pandemic. However, policymakers previously failed to require businesses to pay the true costs of unemployment benefits for their workers, leading California to borrow billions of dollars from the federal government to pay for benefits – a repeat of what happened during the Great Recession.
California is one of just four states that allow employers to pay unemployment insurance taxes on the smallest wage base permitted by federal law, despite the lessons of the last recession and the need for businesses to contribute more to support the workforce.
State unemployment benefits are financed through payroll taxes paid by employers, which generate revenues that are deposited into the state’s unemployment insurance trust fund. But California businesses don’t pay these taxes on their entire payroll — they pay based only on the first $7,000 of each employee’s annual pay. This low base limits the amount of revenue the state can generate for unemployment benefits. For example, a 4% payroll tax would raise just $280 per worker in California, compared to $2,500 per worker in Washington state, where the taxable wage base is $62,500. Even with the same payroll tax rate, Washington would generate almost nine times more revenue than California for each employee making at least $62,500.
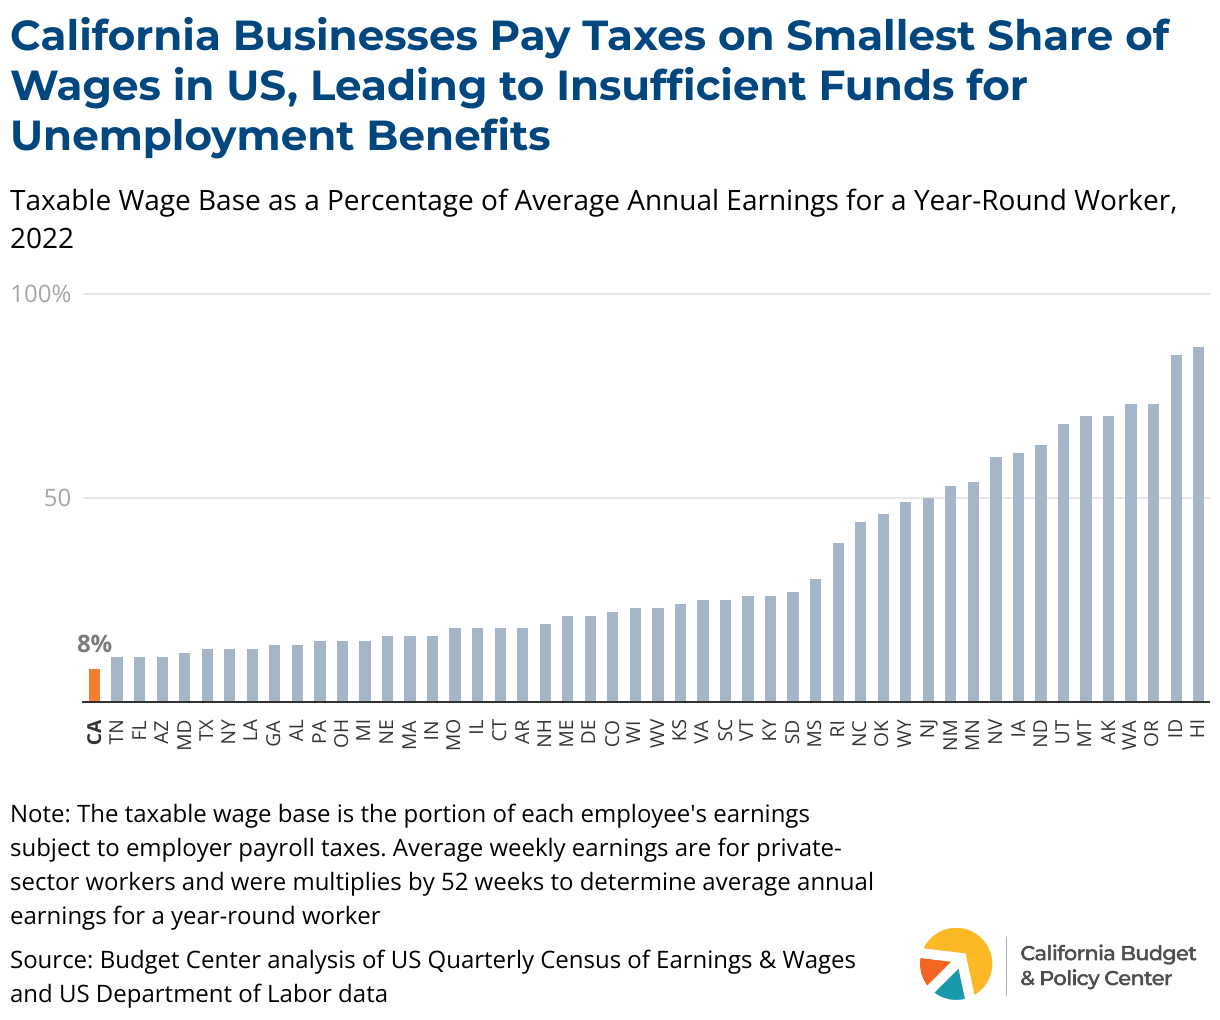
California’s taxable wage base has been frozen at $7,000 since 1983, failing to increase with rising wages. Consequently, the state’s base amounts to just 8% of the average annual earnings for a year-round worker – the smallest share in the US. In contrast, the taxable wage bases in 13 states are at least half of average annual earnings. Most of these states paid for unemployment benefits during the pandemic without federal loans.
California’s leaders must ensure that businesses uphold their responsibility to pay the true cost of unemployment benefits for their workers by increasing the taxable wage base for employer payroll taxes. This would not only prevent future debt, but also make it possible for California to increase unemployment benefits so that workers can meet rising costs of living as they seek to reenter the workforce and provide for their families.