key takeaway
California families have diverse child care needs and preferences, making it critical to expand access to publicly funded child care across centers, family child care homes, and family, friend, and neighbor settings.
Publicly funded child care promotes the healthy development of children and supports families in attending school, work, or other caregiving responsibilities. There are multiple reasons why families seek child care and a number of factors involved in deciding on a preferred child care setting. These decisions are shaped by both personal and societal factors, and access to the preferred setting can directly affect a family’s ability to attend work or school. To help ensure that California families have access to the type of care that works best for them, the California Department of Social Services (CDSS) offers a range of child care and development programs. These programs are available at low-to-no cost for eligible families across multiple settings: 1) licensed child care centers (LCC); 2) licensed family child care homes (LFCH); or 3) family, friend, and neighbor provider (FFN).
Publicly Funded Child Care can Occur in a Variety of Settings
Across CDSS child care and development programs, families can access care through the following options:
- Licensed Child Care Center (LCC): State-licensed and regulated provider that usually operates in commercial spaces or schools. Typically, LCCs offer a classroom environment and run during traditional business hours.
- Licensed Family Child Care Home (LFCH): State-licensed and regulated care for children in a provider’s home. These providers often have flexible hours for families.
- Family, Friend, and Neighbor (FFN): Exempt from state licensing, these providers often care for children they know through family, at the child’s home, or at their own home. These providers may only care for their own children and children from one other family at the same time. Often, they have flexible hours for families.
The term “home-based” setting/provider refers to both licensed family child care homes and family, friend, and neighbor settings. Additionally, some families use multiple settings to best meet their needs, schedules, and context.
Given families’ unique needs and preferences, this diversity of child care options is critical. Moreover, in recent years, enrollment in CDSS child care programs has grown, providing an opportunity to better understand the child care preferences of California’s families. Given recent federal and state threats to child care, the following Five Facts offer critical insights for strengthening child care in California and underscore the importance of continuing to expand access to California’s publicly funded child care programs across all settings in our mixed delivery system.
1. California families using publicly funded child care are increasingly choosing family, friend, and neighbor care.
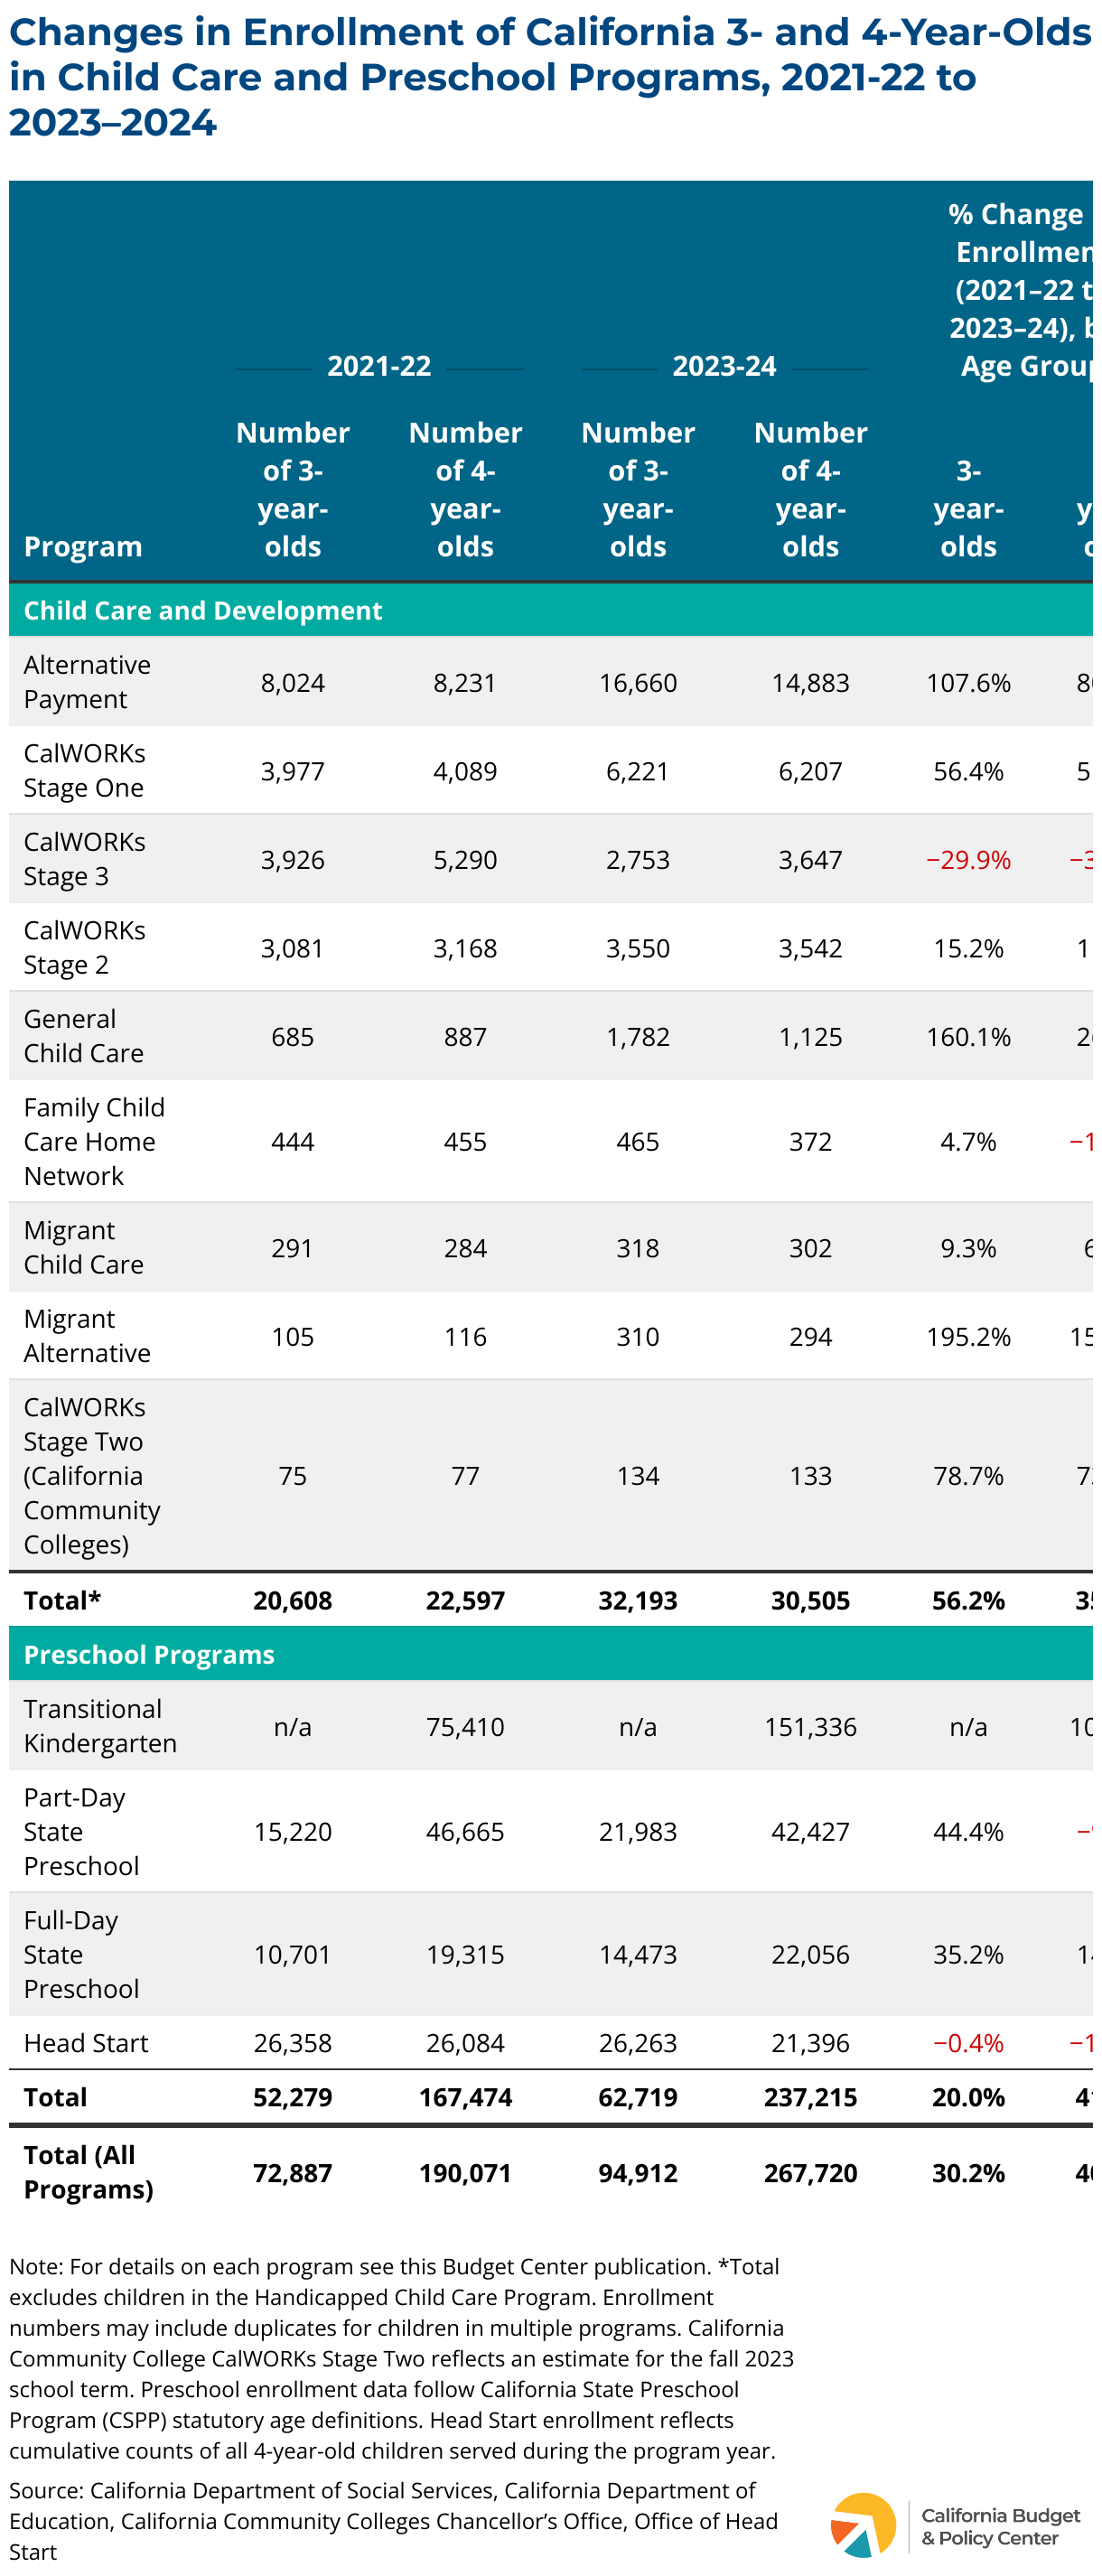
Largely driven by Governor Newsom’s 2021-2023 expansion of publicly funded child care, enrollment in CDSS child care programs increased between 2021 and 2024. By setting, enrollment across LCCs, LFCHs, and FFNs have all increased over time, but at different rates. Namely, as shown in the chart below, families are enrolling in FFN settings at a higher rate than LCCs and LFCHs. Notably, FFN enrollment has increased by over 100%, while LCC and LFCH increases were both around 65%.
These data show that California families value FFN care. This notable increase in FFN utilization may reflect a number of contextual factors, including the need for trusting care that is close to home. Moreover, a 2021 report from the Bipartisan Policy Center showed that FFN care is not a ‘last resort’ option for families. Specifically, 57% of surveyed parents using FFN care stated that they would continue to use it, even if formal care were free and convenient. Many parents value trust and safety when selecting the best child care option for their family, which often means FFN care.
What I like most is that the provider is my friend and she treats my daughter like her own which makes me feel comfortable.” – Parent of a toddler in FFN Care1Quotation collected through research conducted by the Child Care Resource Center as part of the Home-Based Child Care in Los Angeles County report, funded by First 5 Los Angeles.
2. Most children in California’s publicly funded child care are in home-based settings, with trends varying by age and race.
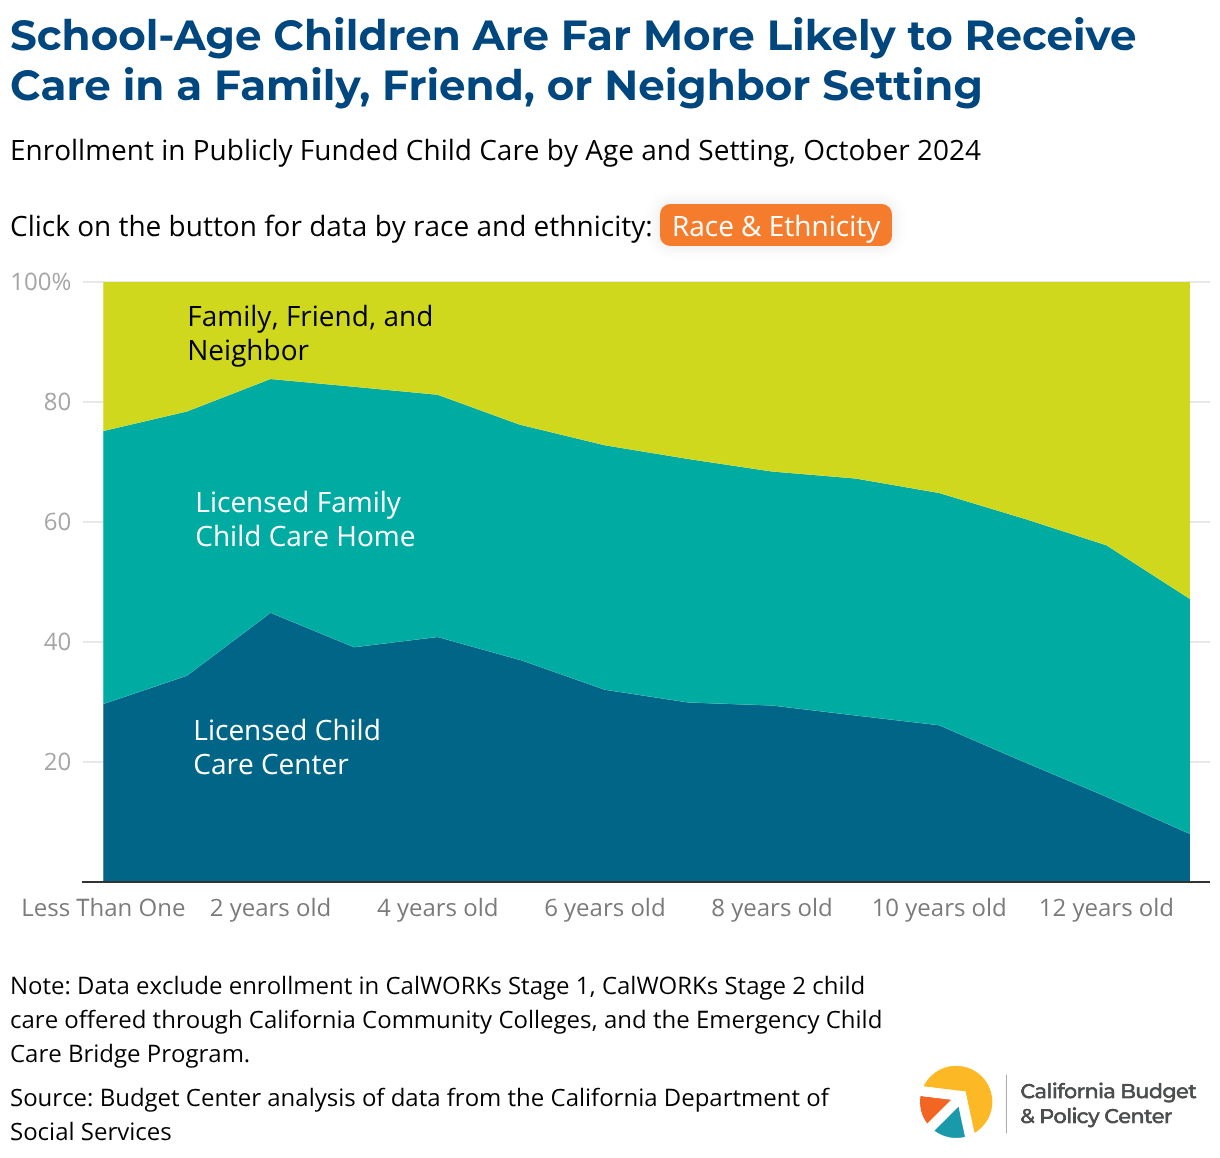
In 2024, two in three California children in publicly funded child care were enrolled in home-based settings.2Data for California includes CalWORKs Stage 1 data, but data disaggregated by age or race and ethnicity do not include Stage 1 due to data limitations. Parents’ and caregivers’ choices varied by the age of the child. Two-thirds of children under age two were in home-based care, either with an FFN provider (22%) or an LFCH (44%). School-age children were also more likely to receive home-based care than center-based care. Nearly 90% of children aged 13 or older with exceptional needs remained in home-based care. Conversely, children ages two to four were more likely to receive center-based care than children of other ages, particularly two-year-old children. For example, 45% of two-year-olds received care from licensed centers, compared to 32% of six-year-olds and 14% of twelve-year-olds.
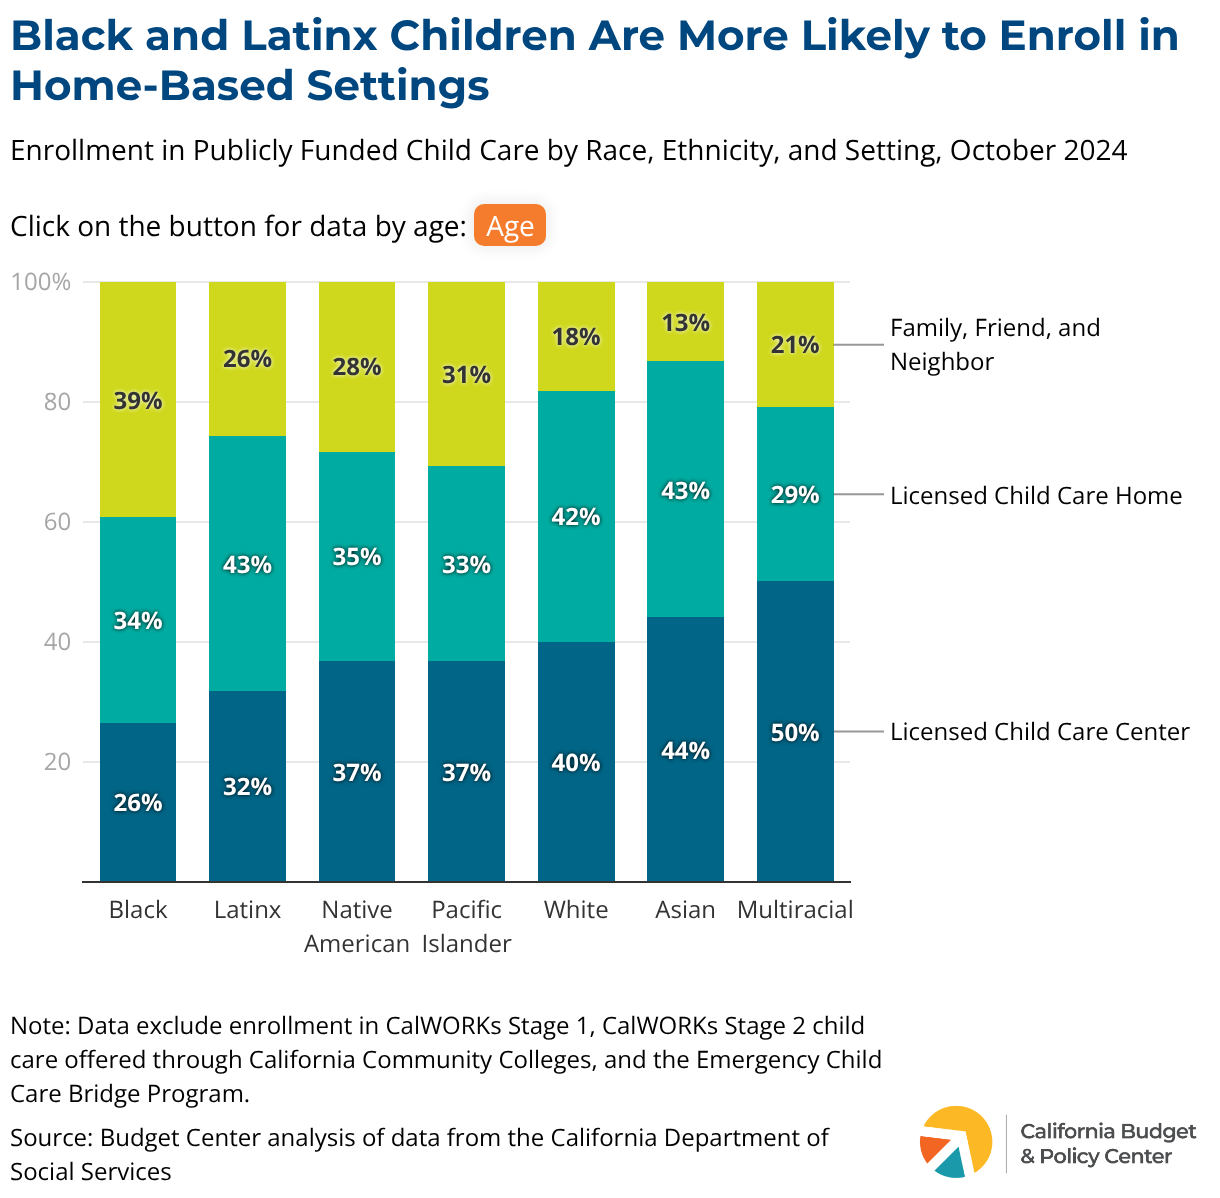
In October 2024, three in four Black children in California received publicly funded child care in home-based settings, with 39% cared for by FFN providers and 34% in LFCH settings. Similarly, two in three Latinx children received care in home-based settings: 26% with FFN providers and 43% with LFCH providers. Asian, multiracial, and white children were relatively more likely to enroll in center-based care, but even so, at least 50% of these children received care from an LFCH or an FFN.
Child care settings for families of color in California are aligned with recent research on families’ needs and preferences. For example, Black and Latinx parents with young children are more likely to work outside of “traditional” hours or on the weekends, which lends itself to FFN or LFCH care. In addition, Black and Latinx parents value providers with similar cultural backgrounds. In California, home-based providers are more likely to be Black and nearly half are Latinx. Finally, parents who use FFN care rate “language spoken” as an important factor in choosing their child care provider, which may explain why Latinx families who are more likely to speak a language other than English at home choose a home-based provider.
3. CalWORKs Stage 1 families are most likely to use family, friend, and neighbor care.
Families accessing CDSS child care through CalWORKs or the Alternative Payment (AP) program can access care across FFN, LFCH, and LCC settings, whereas families enrolling in General Child Care (Title 5 programs, including Family Home Education Networks) can only access LCC and LFCH providers. Notably, nearly 50% of CalWORKs Stage 1 families utilize FFN care while AP program families are most likely to access LFCH (44%).
CalWORKs Stage 1 families must be recipients of California’s cash aid program, and many of these families are just beginning welfare-to-work activities. These families can remain on Stage 1 child care until the family is considered stable at which point they transition to Stage 2 child care. As a result, many of these families may require care at non-traditional hours, given the dynamic nature of finding a job and the prevalence of “gig work” among people with low-incomes. A 2021 report from the Urban Institute on non-traditional hours reported that families requiring care during non-traditional hours are more likely to use FFN care, reflecting the importance of this option for CalWORKs Stage 1 families.
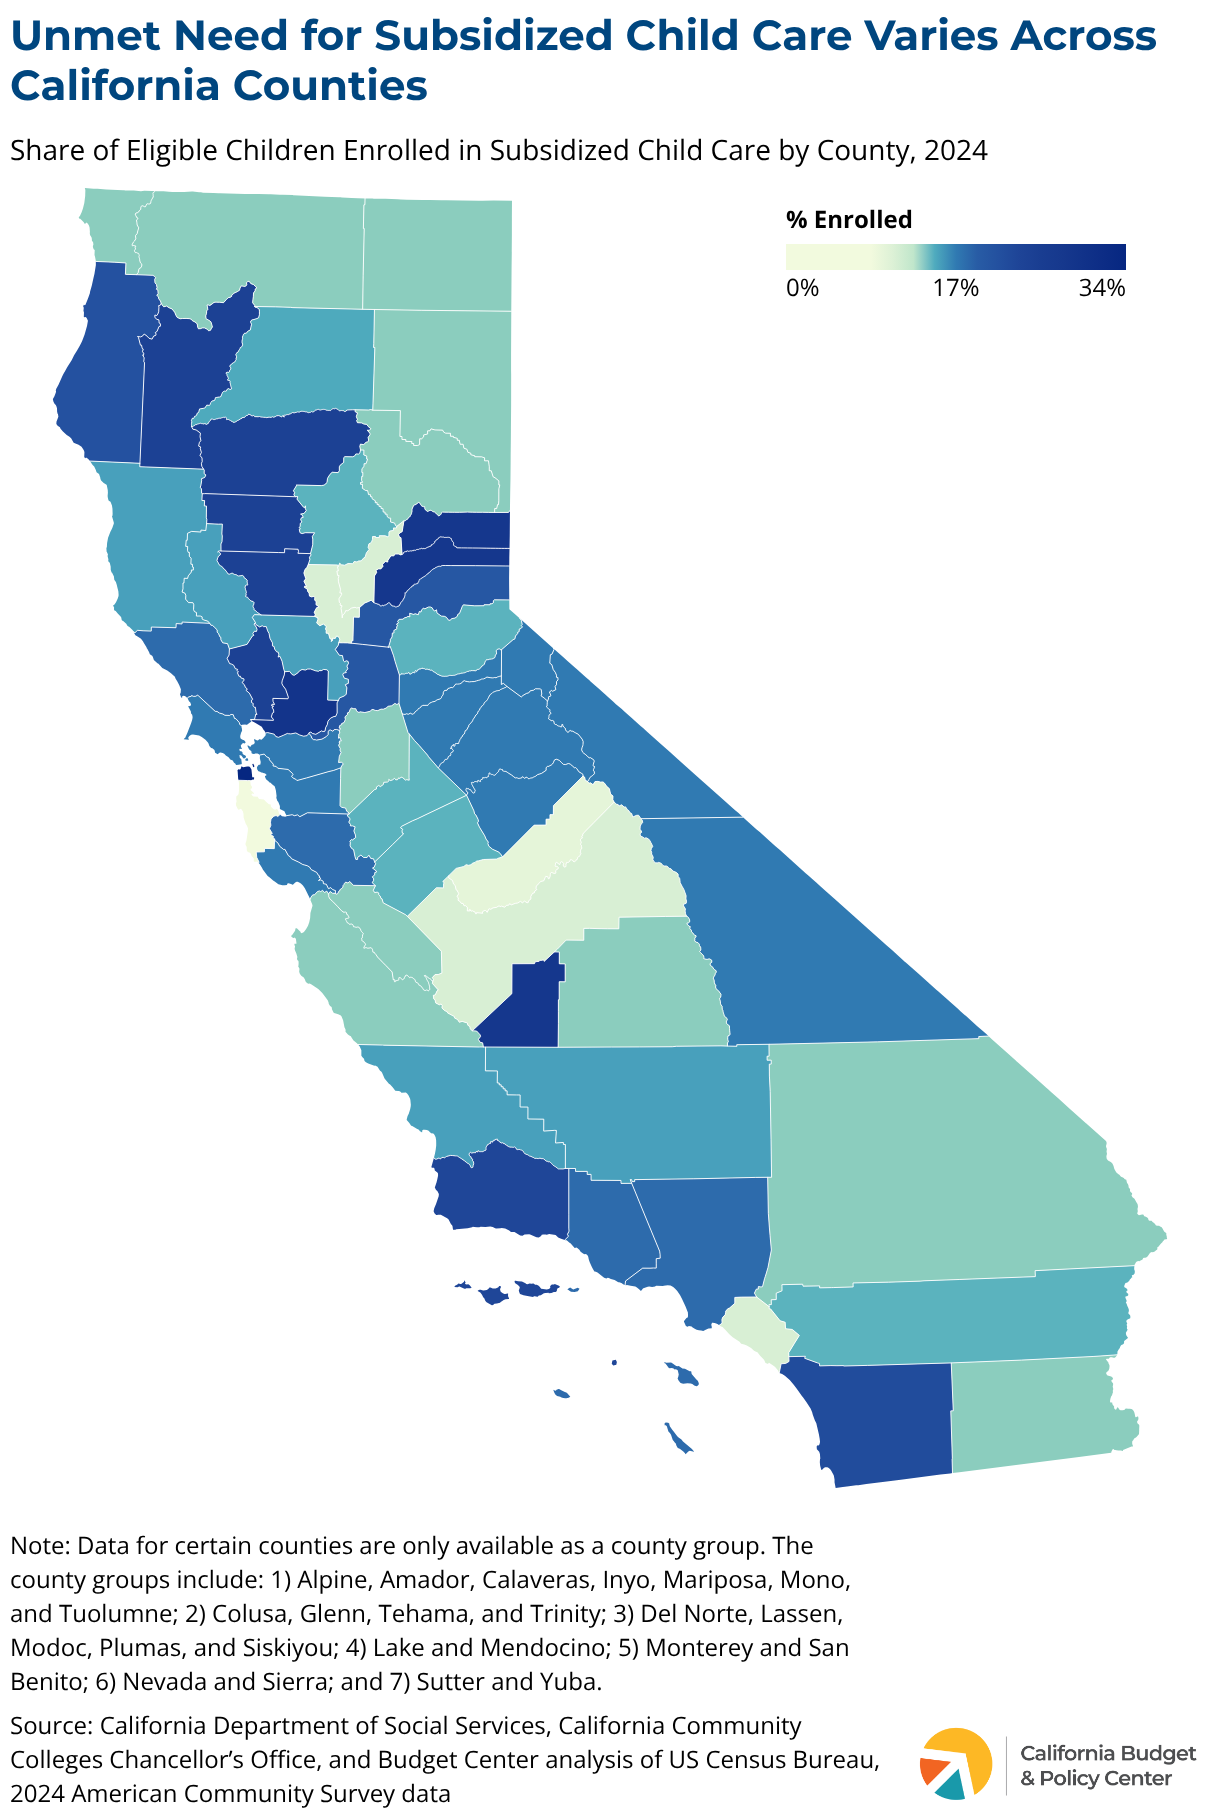
4. The majority of California counties saw large increases in family, friend, and neighbor care.
From 2021 to 2024, just over 158,000 additional children received publicly funded child care in California — an increase of 77% statewide, ranging from a 160% increase in Santa Barbara County to a 1% increase in Mariposa County. The increase in enrollment was driven by the 115% increase in children receiving care from FFN providers. In fact, in 48 out of 58 counties, enrollment in FFN settings increased more than in LFCHs or LCCs. This increase in FFN enrollment was greatest in Riverside County, which saw a 504% increase in FFN care enrollment. The northern California counties of Napa, Mendocino, and Tehama also saw a more than 300% increase in FFN enrollment. Mariposa County was the only county that experienced a reduction in FFN enrollment during this period (-7%).
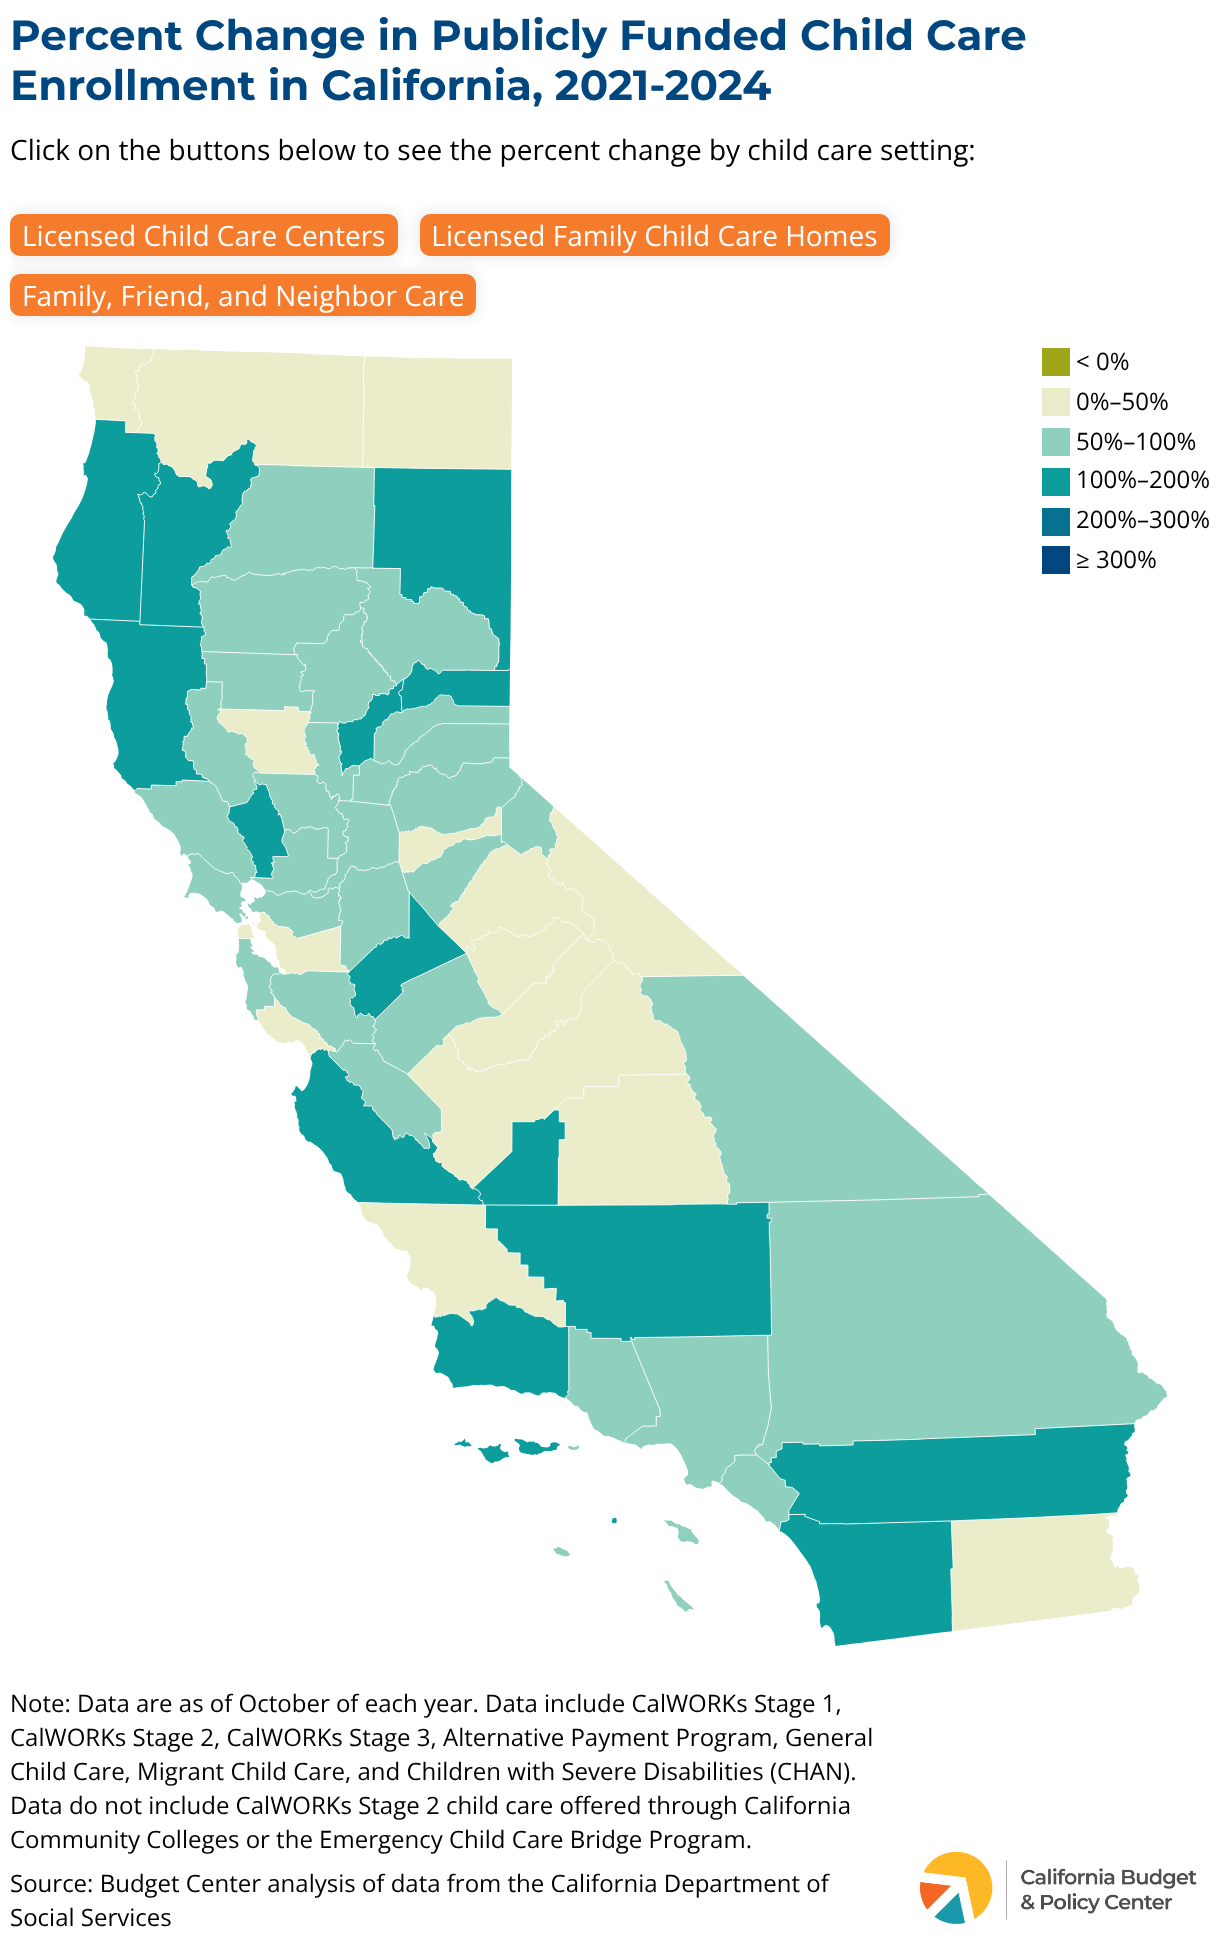
Enrollment in LFCH settings increased by 67% from 2021 to 2024 across California. In six counties, LFCH enrollment increased more than in FFN or LCC settings, including a 167% increase in LFCH enrollment in Sacramento County. No counties experienced a reduction in LFCH enrollment during this period.
Finally, LCC enrollment in California increased 62% over this three-year period. Four counties, including Imperial, Mariposa, Monterey, and Plumas, saw the largest increase in enrollment in publicly funded child care in LCCs, relative to other settings, ranging from 180% in Plumas County to 7% in Mariposa County. Mono, Siskiyou, and Tulare Counties saw a decrease in LCC enrollment. In very rural counties, decreased enrollment could result from the closure of just one or two providers in the community.
5. Licensed family child care homes had the highest share of enrollment in half of all California counties.
The most common setting in which children received publicly funded child care varied across California counties. Families weigh a complex set of factors when deciding who will care for their child while at work or school. These factors may include safety and quality, cultural or linguistic preferences, and practical considerations such as location, hours, and the cost of care, among other factors. In half of all counties, LFCHs were the child care setting with the largest share of children enrolled in October 2024. Colusa, Glenn, Monterey, Plumas, and Santa Cruz Counties all had more than 70% of children receiving publicly funded child care in an LFCH setting.
LCCs were the most prevalent setting in 19 California counties, including many in the Bay Area and the Lake Tahoe and Sierra regions. Alpine, El Dorado, and Orange Counties all had 60% or more of children receiving publicly funded child care in an LCC setting.
Furthermore, 10 California counties – including Los Angeles, which is home to one-quarter of all Californians – had the largest share of children receiving publicly funded child care in FFN settings. In addition to Los Angeles, these other counties are primarily located in California’s Central Valley and parts of the Inland Empire. Despite the large increase in FFN enrollment from 2021 to 2024 statewide, the share of children enrolled in FFN care in most counties — even in counties where it is the most prevalent setting — remained relatively low compared to LFCH and LCC settings combined. The county with the highest share of FFN enrollment was Lassen County, where 55% of children were in FFN care.
Implications & Policy Recommendations
The preceding Five Facts highlight the importance of ensuring access to child care across all settings, particularly given distinct family preferences by race and ethnicity, age of child, and county of residence. As California decisionmakers continue to grapple with the shortage of publicly funded child care and look for solutions to expand access, the following implications are important to consider.
- “Quality” care extends across all settings in California’s mixed delivery system.
- State decisionmakers should pay all providers — regardless of setting — the cost of care to create a system that truly centers family choice.
- Given differences in enrollment trends across counties, contract flexibility is important to maximize current child care investments.
California is facing an uncertain fiscal future, but investments in child care must remain a priority to support the well-being of families and the state’s economy. These investments must center parent choice, value fair pay for providers offering care in every child care setting, and protect all dollars appropriated to child care.
Opportunities for Child Care Data Improvements
The California Department of Social Services provides data on child care enrollment across all programs and settings. Some children enroll in multiple settings simultaneously; however, this duplication is not captured in the data. As the state continues to move forward with updating and improving internal data systems, it is critical that the state develop and implement an accessible early childhood data system that uniquely identifies children and the programs and services used by these children and their families in order to better inform policy decisions. The California Department of Social Services provides data on child care enrollment across all programs and settings. Some children enroll in multiple settings simultaneously; however, this duplication is not captured in the data.
As the state continues to move forward with updating and improving internal data systems, it is critical that the state develop and implement an accessible early childhood data system that uniquely identifies children and the programs and services used by these children and their families in order to better inform policy decisions.