At-a-Glance
Governor Gavin Newsom released the revised 2026-27 California state budget on May 14, projecting positive year-end balances for 2026-27 and 2027-28 and increasing state reserves. In contrast to the governor’s January proposal, which projected a small deficit for 2026-27, the May Revision reflects a stronger fiscal position for the state due to revenue projections that exceed the earlier forecast by $16.8 billion over the three-year budget window.
Stronger-than-expected revenues do not solve all of the state’s challenges. The 2026-27 state budget is Governor Newsom’s last opportunity to fully respond to the damaging federal cuts enacted through H.R. 1. The state is losing billions of dollars in federal funding and struggling with substantial new costs, and Californians are facing new restrictions on access to health care, food assistance, and more.
Despite improving revenues, the $246.6 billion General Fund spending plan is $1.8 billion lower than what the governor proposed in January and reflects concerns about economic uncertainties, geopolitical conflicts and impacts on energy prices, and other external factors that could change the overall fiscal outlook of the state. In addition, the administration and the Legislative Analyst’s Office (LAO) project that rising costs of maintaining state programs and services will outpace revenues in future years, resulting in structural deficits without other state actions. As a result, the May Revision proposes a mix of revenue, spending, and reserve solutions to balance the budgets for 2026-27 and 2027-28.
Revenue
The governor’s proposed revenue solutions include permanently capping business tax breaks at $5 million or 50% of total tax liability (whichever is higher) and adding a new digital software tax.
Reducing inequitable tax breaks that disproportionately benefit the largest and most profitable corporations and adding the new digital software tax are common-sense revenue solutions that modernize our state’s tax system, respond to external changes, and ensure the state can continue to make investments in Californians.
Spending
While the governor’s revenue solutions are a positive initial step, the May Revision mostly fails to address the harmful impacts of H.R. 1, which include well over 1 million Californians losing health coverage through Medi-Cal and more than 3 million households at risk of losing all or some of their nutrition assistance through CalFresh. Similar to this year’s budget (2025-26), the governor’s proposal would compound rather than mitigate that harm by making additional state-level cuts to Medi-Cal, targeting certain immigrants, increasing monthly premiums, and adding onerous paperwork and work requirements that make it more difficult for Californians with low incomes to access benefits for which they are eligible.
The lack of a robust state response to H.R. 1 adds to the ongoing affordability crisis confronting millions of Californians. While the May Revision purports to maintain many prior year expansions, it also allows an array of investments in housing affordability and homelessness to sunset, with no additional funding in 2026-27, and further delays expansion of needed child care spaces and rate reform for undercompensated child care providers.
The governor’s revised budget protects and maintains some of the progress made in prior budget years, including policy advances in behavioral health, cash assistance, food assistance, universal school meals, and expansion of before and after school programs.
Notably, one part of the revised proposal that would see significant new investments is education. The improving near-term state revenue outlook results in higher estimates for the Proposition 98 minimum funding guarantee for transitional kindergarten (TK), school-based state preschool, K-12 schools, and community colleges compared to the governor’s January proposal and the current year budget. In addition, the governor proposes nearly $10 billion in new or expanded investments in TK-12 and community colleges, on top of maintaining existing programs and services.
Reserves and Other Issues
The governor’s revised budget projects nearly $30 billion in reserves at the end of 2026-27. In addition, the revised budget proposes depositing nearly $10 billion into the Projected Surplus Temporary Holding Account in 2026-27, then allocating these funds in 2027-28 — assuming they materialize.
The administration projects that the state prison population will moderately increase in the near term due to the passage of Prop. 36 in November 2024, which increased penalties for certain drug and theft offenses, including by reversing some of Prop. 47’s (2014) sentencing reforms. However, the administration projects that the prison population will resume its long-term decline due to other justice system reforms that remain in effect. Yet, the May Revision does not include any additional closures of state prisons, as recommended by the LAO.
Outlook
In terms of future budget years, California’s projected structural budget imbalance reflects a revenue problem rooted in a decades-old tax and governance structure. The May Revision shines a light on how investing in the needs of Californians and protecting them from federal attacks will fall short without revenue solutions.
The governor’s proposed cap on business tax credits is a positive step toward addressing the state’s long-term revenue imbalance and reducing inequitable tax breaks that disproportionately benefit large, profitable corporations. The need for a cap underscores the inequities in the state’s ‘shadow budget’ that foregoes billions of state revenues that could otherwise be invested in the health and well-being of Californians.
In the near term, the governor and Legislature should also close the Water’s Edge tax break, which allows large multinational corporations to shift state profits to offshore tax havens, which could raise up to around $3 billion annually. As state leaders confront the challenges of federal cuts and economic uncertainty, they have a responsibility to make the state’s tax system more fair in order to invest in and protect the state’s communities.
This First Look report outlines key elements of the May Revision budget proposal and explores how the governor prioritizes spending, revenue, and reserve proposals amid ongoing federal cuts and affordability challenges. The report also highlights alternative proposals included in the Senate budget plan released in April.
Contents
Budget Overview
- Economic Outlook for the Economy and for People: Administration Projects Weaker Near-Term Economic Growth
- Revenue Outlook: Proposed Budget Assumes a $16.8 Billion Improvement in the Revenue Outlook Over the January Projections
- Tax Policy: Governor Proposes Tax Policy Changes to Generate Ongoing Revenue
- Reserves: Revised Budget Projects Nearly $30 Billion in Reserves, Sets Aside Nearly Another $10 Billion for Next Year
Health
- Overview: Governor’s Revised Budget Misses the Mark on Health Care
- Federal Policy: May Revision Reflects Impact of Federal Policy Changes
- Coverage, Affordability, & Access: Governor’s Revised Budget Continues Rolling Back Health Care for All
- Behavioral Health: Revised Budget Largely Sustains Behavioral Health Initiatives
- Medi-Cal Provider Taxes & Fees: Revised Budget Proposes New MCO Tax, Highlights Challenges to Hospital Fee
- County Administration: Counties Need More Support to Manage Federal Health Care Changes
- Protecting Health Coverage: State Leaders Can Protect Health Care Access Instead of Cutting Services
Housing & Homelessness
- Protecting Renters: May Revise Falls Short in Protecting California Renters
- Homelessness: May Revision Adds Red Tape to Homelessness Funding Without New Investments
- Affordable Housing: The Administration Fails Again to Prioritize Funding for Affordable Housing
Economic Security
- Food Assistance: Governor’s Budget Falls Short in Preparing for Significant CalFresh Cuts
- Family & Child Well-Being: Revised Budget Maintains Funding for CalWORKs and Refundable Tax Credits
- Californians with Disabilities & Older Adults: Revised Budget Plan Slashes Programs and Services for Older Adults and Californians with Disabilities
- Child Care: Child Care Expansion at an Indefinite Standstill Despite Substantial Need
- Immigrant Californians: Revised Budget Continues to Impose Harm on Immigrants
Education
- Overview: Growth in Education Funding Continues Resource Expansion for Schools
- Proposition 98: Growth in Revenue Estimates Significantly Increases the Prop. 98 Guarantee
- Early Learning & Pre-K: Transitional Kindergarten and State Preschool Largely Continue as Planned
- K-12 Education: May Revision Boosts Education Funding with Ongoing and One-Time Resources
- Community Colleges: May Revision Builds on Community College Investments
Justice System
- State Corrections: Budget Projects Drop in Prison Population, Fails to Propose Prison Closures
- Proposition 36 Impact: Revised Budget Includes No New Funding to Address Proposition 36’s Unfunded Mandate
- Proposition 47 Investments: May Revision Projects Decline in Proposition 47 Savings in Coming Years
- Other Justice System Issues: Revised Budget Includes One-Time Funds to Address Crime and Support Survivors
Other Key Issues
- Elections Funding: Governor Hints at Coming Effort to Protect Elections Against Federal Threats
Didn’t find what you were looking for? Reach out through our contact form and we’ll connect you with the right expert.
Budget Overview
Administration Projects Weaker Near-Term Economic Growth
The administration’s economic outlook is an important aspect of the budget because aggregate changes in economic indicators, such as jobs and wages, affect how much revenue the state will generate. The revised budget projects weaker economic growth in the near term for both California and the US due to new developments, such as higher global energy prices due to the Iran war, which are expected to lead to higher inflation and reduced purchasing power, weakening consumer demand and overall economic activity. The ongoing impact of tariffs, which are projected to continue to raise costs for businesses and consumers in the near term, is another key factor behind the administration’s weaker economic outlook. On top of this, the revised budget projects that California’s job market will remain weak, with essentially no aggregate job growth expected in 2026 or 2027.
Californians Begin to See Harm from Budget Cuts as Corporations Enjoy Massive New Tax Breaks
The administration’s outlook is useful for understanding how economic conditions might impact budget revenues, but it’s also important to consider how economic conditions and recent policy choices are affecting everyday Californians who count on services funded by the budget.
Communities across the state have been facing mounting affordability pressures for years due to persistently high inflation and insufficient investments in affordable housing, child care, and other essentials. Roughly 1 in 6 Californians struggle to afford food, housing, and other basic needs, based on the California Poverty Measure. Economic instability is especially common among young adults ages 18 to 24, with nearly 1 in 4 experiencing poverty, as well as older adults age 65+, with nearly 1 in 5 in poverty.
Now the economic challenges facing Californians are worsening as deep federal budget cuts to health care and food assistance, together with recent state cuts to health care, begin to take effect, targeting people with low incomes, immigrants, communities of color, and other marginalized communities. This includes:
- The elimination of CalFresh food assistance for Californians with humanitarian immigration statuses that began April 1, 2026 and the expansion of harsh time limits to more groups of Californians beginning June 1, 2026. These cuts will take food away from children, seniors, and people with disabilities and could lead to increased poverty and food insecurity across every legislative district.
- The elimination of full scope Medi-Cal and CHIP coverage for immigrants with humanitarian status starting October 1, 2026, with several additional cuts that will reduce access to health care starting January 1, 2027. This follows on the heels of state cuts taking effect this year that will reduce access to Medi-Cal, including an enrollment freeze applying to undocumented adults that began January 1. State and federal cuts to health care threaten to leave millions of people without coverage and harm Californians in every legislative district.
As Californians begin to feel the harm of deep federal budget cuts, large corporations are beginning to enjoy the benefits of $1 trillion in federal tax breaks over the next 10 years that are partly funded through those cuts. At least 88 of the largest corporations in the US paid no federal corporate income tax in their most recent fiscal year, including several headquartered in California, even though they had significant pretax profits, reflecting at least in part the federal corporate tax breaks enacted last year, combined with those enacted during president Trump’s first term. The richest 1% of US residents are also slated to receive $1 trillion in federal tax cuts over the next 10 years, while low- and middle-income families will pay higher taxes, at a time when affordability challenges continue to increase and income inequality in the US and California are already extreme.
These federal policy choices will widen already extreme inequities in California, making it even more imperative that state leaders take bold action to counter wealth and income concentration and safeguard essential services that contribute to the health, well-being, and economic security of all Californians.
Proposed Budget Assumes a $16.8 Billion Improvement in the Revenue Outlook Over the January Projections
The governor’s budget proposal assumes that state General Fund revenues across the three-year budget window — covering fiscal years 2024-25 through 2026-27 — will be $16.8 billion higher than projected in the January budget proposal, before accounting for the estimated $1.3 billion revenue increase from the governor’s tax policy proposals (see Tax Policy section). This largely reflects continued growth in personal income tax collections, driven mainly by a strong stock market, which results in income gains for high-income Californians, who pay higher tax rates under the state’s progressive tax system.
The administration’s revenue projections are lower than the Legislative Analyst’s Office (LAO) estimates, which recently projected that General Fund revenues from the state’s three largest revenue sources — personal income taxes, corporate taxes, and sales taxes — will be $25 billion higher than the governor’s January projections across the three-year budget window, also due mainly to personal income taxes.
Both the administration and the LAO acknowledge that the current stock market trends may not be sustained, particularly as stock market gains have been driven primarily by what may be an “AI bubble” that could burst, which would negatively impact the state’s revenues in the future. Additionally, the administration notes additional risks to the economic and revenue forecasts stemming from the Iran war and the potential for prolonged elevations in oil and gas prices as well as the impacts of tariffs.
The administration’s revenue forecast accounts for a moderation in stock market growth but not a significant downturn. If such a downturn were to occur this year, the administration estimates that revenues could be $15 billion to $20 billion lower than the current estimates across the budget window, even without an economic recession. However, revenue estimation is highly uncertain and there is no way of knowing with certainty when such a reversal in the stock market might occur and when the impacts on the California budget would materialize.
While the increased revenue projections improve the budget condition, it’s important to keep in mind that around half of new revenues are constitutionally required to go to K-14 education spending (see Proposition 98 section), budget reserves, and debt repayments (see Reserves section).

H.R. 1 and the Federal Budget
H.R. 1, the harmful Republican mega bill passed in July 2025, will deeply harm Californians by cutting funding for essential programs like health care, food assistance, and education.
See how California leaders can respond and protect vital supports.
Governor Proposes Tax Policy Changes to Generate Ongoing Revenue
Tax revenues are the foundation of a well-functioning state that ensures its residents can access the basics like affordable housing, health care, and child care, offers quality cradle to career education, and provides businesses with the resources they need to thrive, such as a skilled workforce and public infrastructure. But California’s revenue and governance structure hasn’t kept pace with a dramatically changed world.
California is facing multiple challenges that impact the state budget and the lives of Californians: growth in state revenues is projected to lag behind the growing costs of meeting the needs of Californians, and deep federal cuts to health care and food assistance enacted last year through H.R. 1 are continuing to go into effect, with many of the harshest policies set to begin later this year and in 2027. Meanwhile, profitable corporations and wealthy households have been gifted with federal tax breaks through H.R. 1 and the previous round of Trump tax cuts in 2017. The state will need significant additional revenues in order to maintain existing critical services, blunt the harms of the federal cuts, and continue making progress on better meeting Californians’ needs.
The governor’s revised budget takes steps to increase ongoing state revenues and ensure highly profitable corporations are paying their fair share in state taxes, but much more will be needed. The budget includes tax policy changes that, on net, are estimated to raise about $1.3 billion in 2026-27 and $2.5 billion in future years. This does not include the impacts of the Managed Care Organization tax, which allows the state to draw down additional federal funding to support the Medi-Cal program (see Medi-Cal Provider Taxes & Fees section).
The governor’s tax policy proposals include:
- Instituting a permanent limit on business tax credits.
- Applying the sales tax to software purchases downloaded or accessed online.
- Cutting the first-year $800 minimum franchise tax to $400 for certain businesses.
- Allowing the deferral of state taxes on gains in “Trump Accounts.”
- Maintaining the January proposal to extend the California Competes tax credit.
The governor’s tax proposals would generate greatly needed long-term revenue to support state services, and would ensure more profitable corporations are reasonably contributing to state tax revenues. But given the growing unmet needs of Californians, additional revenues will be needed to protect and expand critical state services. Another complementary reform to ensure large multinational corporations are not essentially zeroing out their state tax bills is eliminating the “water’s edge” loophole that allows corporations to avoid up to around $3 billion in state taxes each year by stashing profits in offshore tax havens.
Senate leadership has called for additional revenues, proposing to raise around $5 billion to $8 billion to support the Medi-Cal program by requiring large employers to make a “Fair Share Contribution” to support the costs of providing Medi-Cal for their workers when the employer is not offering them affordable health insurance.
Building a real California for All, and responding to federal cuts, will require policymakers to embrace bold revenue solutions to cover the increasing costs of providing existing services due to inflation and a changing population and better meet the growing needs of Californians.
Revised Budget Projects Nearly $30 Billion in Reserves, Sets Aside Nearly Another $10 Billion for Next Year
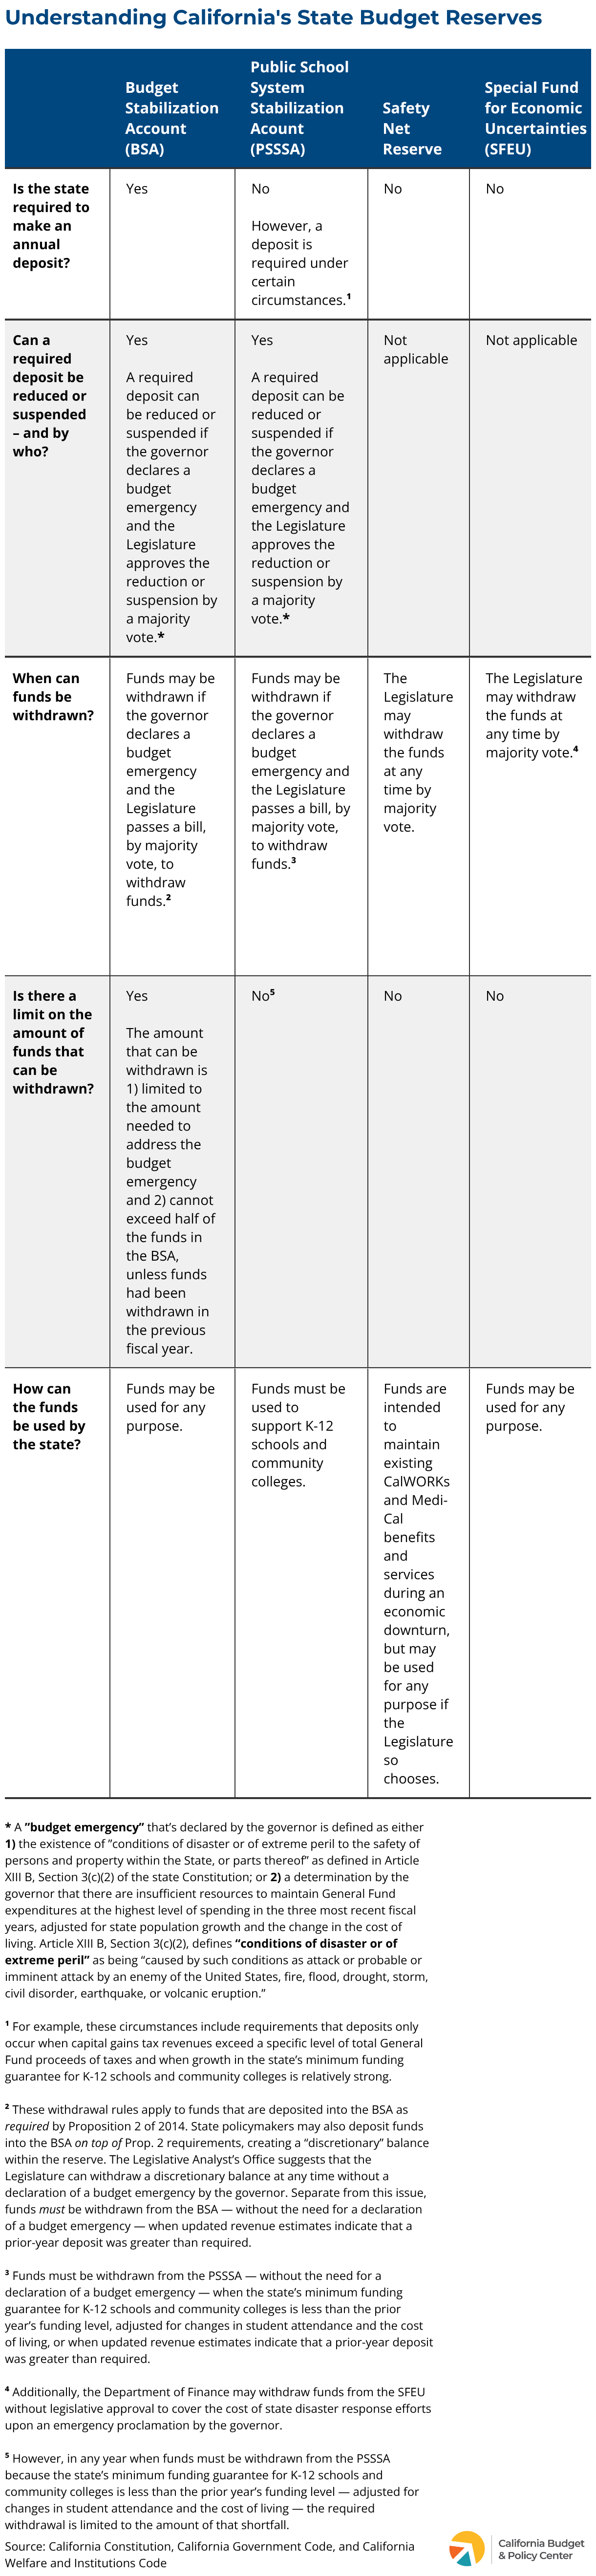
California has several state reserve accounts that set aside funds for a “rainy day” when economic conditions worsen and state revenues decline. Some reserves are established in the state’s Constitution to require deposits and restrict withdrawals, and some are at the discretion of state policymakers.
California voters approved Proposition 2 in November 2014, amending the California Constitution to revise the rules for the state’s Budget Stabilization Account (BSA), commonly referred to as the “rainy day fund.” Prop. 2 requires an annual set-aside equal to 1.5% of estimated General Fund revenues. An additional set-aside is required when capital gains revenue in a given year exceeds 8% of General Fund tax revenue. For 15 years — from 2015-16 to 2029-30 — half of these funds must be deposited into the rainy day fund, and the other half is to be used to reduce certain state liabilities (also known as “budgetary debt”).
Prop. 2 also established a new state budget reserve for K-12 schools and community colleges called the Public School System Stabilization Account (PSSSA). The PSSSA requires that when certain conditions are met, the state must deposit a portion of General Fund revenues into this reserve as part of California’s Prop. 98 funding guarantee.
In order to access the funds in the BSA and PSSSA, the governor must declare a state budget emergency — an action that was taken in the enacted current-year (2025-26) budget in response to the state’s projected budget deficit.
Dive Deeper Into California’s Budget Reserves
For a deeper understanding of California’s reserve accounts, explore the Budget Center’s companion resources:
The BSA and the PSSSA are not California’s only reserve funds. The 2018-19 budget agreement created the Safety Net Reserve Fund, which is intended to hold funds to be used to maintain benefits and services for CalWORKs and Medi-Cal participants in the event of an economic downturn, and which was completely spent down in response to recent years’ budget deficits. Subsequently, in 2024, the state created the Projected Surplus Temporary Holding Account, which is intended to hold anticipated surplus revenues for up to one year before spending them. Additionally, the state has a Special Fund for Economic Uncertainties (SFEU) — a reserve fund that accounts for unallocated General Fund dollars and that gives state leaders total discretion as to when and how they can use the available funds.
The governor’s revised budget projects $29.9 billion in reserves at the end of 2026-27. Specifically, the proposal:
- Projects a BSA balance of $15.1 billion;
- Projects the PSSSA balance at $10.3 billion;
- Leaves the Safety Net Reserve with a zero balance; and
- Projects an SFEU balance of $4.5 billion.
In addition, the revised budget proposes depositing $9.7 billion into the Projected Surplus Temporary Holding Account in 2026-27, then allocating these funds in 2027-28. As required by law, funds can only remain in this account for up to one year, after which they must be returned to the General Fund or spent. Senate democrats’ recent budget proposal also included setting aside $10 billion in 2026-27 to be used in 2027-28.
The revised budget also maintains the governor’s January proposal to suspend a “true-up” deposit into the BSA in 2025-26. State leaders suspended annual deposits into the BSA in 2024-25 and 2025-26 and withdrew funds to help address budget shortfalls. The state is now required to make a “true-up” deposit into the BSA, estimated at $5.4 billion in 2025-26, based on updated revenue estimates. The governor proposes suspending this deposit, but his revised budget reflects a deposit into the BSA of roughly $3.6 billion in 2026-27.
Finally, the revised spending plan makes the constitutionally required deposits into the PSSSA and includes a discretionary deposit of $1.6 billion (see section on Prop. 98).
Administration Highlights Ongoing Discussions Around Modifying the BSA
The governor’s revised budget highlights that the administration intends to continue discussions with the Legislature around potentially putting a constitutional amendment on the ballot to ask voters to make changes to strengthen the BSA. Both the Senate and Assembly democrats’ recent budget frameworks expressed the intent to increase the maximum size of the fund and make it easier to save more when state revenues are up. In addition, the Senate, which included significantly more detail in its plan, proposes to:
- Increase the maximum size of the fund to 30% of General Fund tax revenues, up from 10%.
- Reduce the annual revenue set-aside to 1% of General Fund tax revenue, from 1.5%, but require “additional spiking revenues” to be set aside.
- Modestly increase the share of set-aside revenues deposited into the rainy day fund, while modestly reducing the share going toward debt payments, but extend the required annual debt payments beyond the current 2030 date and allow federal unemployment insurance loans to be repaid from this source of funds.
- Change the relationship between deposits into and withdrawals from reserves and the state’s spending limit (Gann limit), making it easier for policymakers to build up reserves during years when state revenues are strong and the state is at risk of exceeding the limit.
Although building up reserves is important to protect against future downturns and manage fluctuations in state revenues, as state leaders further refine the specific changes to put before voters it will be important to balance saving for a rainy day with meeting the urgent needs Californians have today.
Health
Governor’s Revised Budget Misses the Mark on Health Care
Access to health coverage makes it possible for people to receive regular checkups, fill a prescription, and get treatment when they are sick or injured. Health coverage also supports financial security by helping people avoid high medical costs and debt.
Medi-Cal, California’s Medicaid program, provides free or low-cost coverage to more than one in three Californians, including children, pregnant individuals, seniors, and people with disabilities. As a cornerstone of the state’s health care system, Medi-Cal helps millions of Californians access care and maintain financial stability while also supporting hospitals, clinics, health care workers, and local economies across the state.
Last year, federal and state policymakers made deep cuts to Medi-Cal that reversed progress toward a more inclusive and equitable health system. Republicans in Congress and the Trump administration enacted the deepest health care cuts in US history. At the state level, policymakers approved significant cuts to Medi-Cal in the 2025 Budget Act that marked a major shift away from the state’s commitment to expanding health care access for all Californians. While the governor’s May Revision takes some steps to reduce harm caused by recent federal cuts, it continues policies that put Californians’ health coverage and access to care at risk.
May Revision Reflects Impact of Federal Policy Changes
The governor’s May Revision reflects implementation of new federal policy changes under H.R. 1 — the harmful Republican megabill signed by President Trump last year. The revised budget includes about $1.5 billion in new General Fund spending related to H.R. 1 in 2026-27 and reduced General Fund spending of $1.9 billion by 2029-30. The administration projects Medi-Cal disenrollment of 44,000 people in 2026-27, growing to 1.3 million people by 2029-30 due to H.R. 1.
The governor’s May Revision reflects the following actions and policy changes related to implementation of H.R. 1:
- Denying full-scope Medi-Cal coverage to immigrants with humanitarian status.
- Loss of federal funding for emergency care for immigrants.
- Implementation of work requirements.
- Reduced Medi-Cal retroactive coverage.
- Increased eligibility checks.
Another federal policy change will require California to transition about 2 million undocumented adults and certain other immigrants from managed care into a fee-for-service Medi-Cal delivery system beginning January 1, 2027. This change stems from federal guidance issued in September 2025 that restricts how states can use federal Medicaid funds for immigrants who are not eligible for federally funded Medicaid coverage.
A key consequence of this change is that these Californians will lose access to Enhanced Care Management and Community Supports. These services pair intensive care coordination with non-clinical supports such as housing assistance, medically tailored meals, recuperative care, and other services that help people meet basic needs. The May Revision reflects a reduction of $583.8 million ($471.6 million General Fund) in 2026-27 and $1.5 billion ($1.2 billion General Fund) ongoing tied to this federal policy change.
Governor’s Revised Budget Continues Rolling Back Health Care for All
The 2025 Budget Act included significant state-imposed cuts to Medi-Cal, including freezing new enrollment for undocumented adults, imposing new Medi-Cal premiums on certain immigrants, and reducing payments to Medi-Cal providers. The governor’s revised budget builds on those actions with additional cuts and cost-shifting proposals that are not required under federal law. Together, these changes would further reduce access to health care and supportive services for immigrants, seniors, people with disabilities, and individuals managing chronic health conditions.

case Study: How a Tax on Wealthy Households Funds Schools, Health Care & More
Voters asked the top 2% of earners to contribute more — generating $9 to $10 billion per year for education, tax credits for families with low incomes, and a stronger, more resilient state budget.
The revised budget includes cuts that specifically target immigrant Californians:
- Higher Medi-Cal premiums for certain immigrants from $30 to $50 per month. As part of the 2025 Budget Act, state leaders imposed $30 monthly premiums on undocumented adults and certain other immigrants effective January 2027 — a cost that would not apply to other Medi-Cal members. The governor’s revised budget increases this premium by $20 per month, making coverage unaffordable for many low-income Californians. This would reduce General Fund spending by $427.3 million in 2026-27 and $314.3 million annually in 2029-30.
- Applying federal work requirements to immigrants who receive state-funded Medi-Cal. The governor’s revised budget maintains his previous proposal to impose the harmful federal work requirements on immigrants who receive health care through state-only Medi-Cal — even though there is no federal requirement to do so. Instead of protecting immigrant Californians, the governor is choosing to impose additional harm.
The May Revision also includes cuts that would affect seniors and people with disabilities. Specifically, the revised budget:
- Reinstates Medi-Cal asset limits.
- Maintains cuts to In-Home Supportive Services (IHSS).
- Lowers payment rate caps for PACE providers (Program of All-Inclusive Care of the Elderly).
The revised budget also proposes broader cuts to Medi-Cal services and supports that many Californians rely on to manage chronic conditions, access care, remain safely housed, and meet daily health and basic needs, including:
- Eliminating acupuncture as a Medi-Cal benefit. This change would reduce General Fund spending by $5.4 million in 2026-27 and $13.1 million ongoing.
- Cutting Enhanced Care Management. New eligibility and utilization management rules would take effect January 1, 2027. These changes would reduce General Fund spending by $41.4 million in 2026-27 and $99.2 million ongoing.
- Reducing access to Community Supports. The revised budget would change referral pathways, eligibility criteria, service definitions, and utilization management rules for select Community Supports services effective January 1, 2027. These changes would reduce General Fund spending by $26.9 million in 2026-27, $58.8 million in 2027-28, and $51 million ongoing.
- Making changes to Applied Behavioral Analysis (ABA) services, transportation services, and a Medi-Cal managed care quality incentive. The revised budget proposes new utilization management requirements, including stricter reviews and prior authorization requirements, that would apply to ABA and Medi-Cal transportation services. The governor also proposes to eliminate an incentive program that rewards health plans for meeting quality benchmarks and improving care outcomes. Together, these proposals would reduce General Fund spending by $68 million in 2026-27, increasing to $552 million by 2029-30.
- Redirecting Medi-Cal funds to the General Fund. The governor proposes to move medical loss ratio remittances — funds returned by Medi-Cal managed care plans when they do not spend enough on patient care — away from Medi-Cal. This would reduce General Fund spending by $25 million ongoing beginning in 2027-28.
New Health Investments
Although the May Revision does not introduce bold new investments to reverse harmful state and federal actions, it does include smaller, but meaningful investments. Specifically, the revised budget:
- Maintains funding for reproductive health care providers. This one-time $60 million General Fund investment for the 2025-26 fiscal year would help reproductive health centers facing federal funding cuts tied to abortion services.
- Provides funding to maintain HIV services and support LGBTQ+ community centers. This one-time $60 million investment from the AIDS Drug Assistance Program Rebate Fund in 2026-27 includes support for HIV-related services affected by federal cuts and LGBTQ+ community centers experiencing funding losses.
- Invests in menopause awareness and education. This one-time $3 million General Fund investment would support a statewide public awareness campaign on perimenopause and menopause.
- Provides short-term support for struggling hospitals. The revised budget includes up to $50 million General Fund in 2026-27 for hospitals facing immediate financial distress. This proposal builds on recent state action to provide $25 million General Fund for this purpose.
- Supports Sickle Cell Centers of Excellence. The May Revise includes $30 million General Fund over five years to support treatment and care for individuals living with sickle cell disease.
Additional Support for Covered California Members
For those who earn too much to qualify for Medi-Cal, Covered California — the state’s health insurance marketplace established through the Affordable Care Act (ACA) — serves as a vital resource. Covered California allows individuals and families to purchase health insurance, often with financial assistance to lower monthly costs. Over 1.9 million Californians rely on the state’s health insurance marketplace for their health coverage.
Health care costs are rising for many Californians, particularly after the expiration of enhanced federal premium tax credits that helped lower monthly premiums. As costs increase, some enrollees are shifting to lower-premium plans with higher deductibles and out-of-pocket costs in order to maintain coverage, potentially making it harder to afford care when they need it.
The governor’s revised budget includes an additional $110 million from the Health Care Affordability Reserve Fund to expand the state premium subsidy program for Covered California enrollees with incomes up to 200% of the federal poverty level. This proposal builds on actions state leaders took last year, when the governor and Legislature approved $190 million in state premium assistance for people with incomes up to 165% of the federal poverty level.
Federal policymakers should restore enhanced premium tax credits to help keep health coverage affordable at a time when many individuals and families already struggle with high health care costs. State leaders should also continue pursuing strategies to improve access to affordable coverage through Covered California.
Revised Budget Largely Sustains Behavioral Health Initiatives
Millions of Californians rely on services for mental health and substance use treatment, known as behavioral health care. Many of these individuals face housing insecurity, justice system involvement, or child welfare placement. Strengthening the state’s behavioral health system is essential to guaranteeing that every Californian can access the care they need, regardless of race, age, gender identity, sexual orientation, or where they live.
State policymakers have significantly invested in behavioral health treatment, workforce capacity, housing supports, and care coordination in previous years. The May Revision largely maintains these initiatives and continues implementation of Proposition 1, while relying heavily on non–General Fund funding sources and shifting some future costs to counties. At the same time, federal cuts and threats to behavioral health waivers create uncertainty for the long-term stability of California’s behavioral health system.
Maintaining Previous Behavioral Health Initiatives
In recent years, the state has invested about $8.5 billion across multiple departments to expand behavioral health treatment capacity and infrastructure. These investments include:
- $4.2 billion for the Children and Youth Behavioral Health Initiative.
- $2.9 billion for the Behavioral Health Bridge Housing and Behavioral Health Continuum Infrastructure programs.
- $1.4 billion for Mobile Crisis Response.
Policymakers have also committed nearly $8 billion over five years to Behavioral Health Community-Based Organized Networks of Equitable Care and Treatment (BH-CONNECT), a multi-year initiative focused on improving access to behavioral health services for Medi-Cal members with significant needs, including children and youth involved in child welfare, people involved in the justice system, and individuals at risk of or experiencing homelessness. The May Revision largely maintains these major behavioral health initiatives, but does not propose significant new investments to further expand the system.
Proposition 1 Implementation
The revised budget continues implementation of Proposition 1 (Prop. 1), which voters approved in March 2024. Prop. 1 amended California’s Mental Health Services Act — now Behavioral Health Services Act (BHSA) — and authorized a $6.38 billion bond to fund behavioral health treatment, residential facilities, and supportive housing for veterans and Californians with behavioral health needs. Counties will begin operating under the revised funding structure under the BHSA in July 2026.
The May Revision proposes $315.9 million from the Behavioral Health Services Fund (BHSF) in 2026-27 for several state departments to implement the state-directed activities. These funds support behavioral health prevention and workforce programs and continue implementation of the BH-CONNECT Workforce Initiative. Of the $315.9 million BHSF proposed for 2026-27:
- $174.8 million is for the Department of Public Health,
- $131.1 million is for the Department of Health Care Access and Information, and
- $10 million is for the Commission for Behavioral Health.
The revised budget relies on the BHSF in place of the General Fund for BH-CONNECT workforce activities, shifting $211.9 million in 2026-27, $229.1 million in 2027-28, and $226.4 million by 2029-30.
Crisis Response and Behavioral Health Care in Prisons
The May Revision includes behavioral health proposals related to community-based crisis response services and mental health care in state prisons. Specifically, the revised budget:
- Maintains a proposal to make Medi-Cal mobile crisis services optional for counties beginning April 1, 2027.
- Includes funding for court-appointed receivership overseeing prison mental health services.
Protecting and Strengthening California’s Behavioral Health System
County behavioral health departments continue to warn that Prop. 1 largely redirects existing mental health funding rather than providing significant new ongoing resources. At the same time, federal cuts under H.R. 1 and threats to federal behavioral health waivers could destabilize funding for behavioral health care, housing supports, and recovery services while increasing demand for county-based services. As California continues implementing major behavioral health reforms, state leaders should ensure counties and providers have the stable, ongoing resources needed to maintain access to care and support Californians with behavioral health needs.
Revised Budget Proposes New MCO Tax, Highlights Challenges to Hospital Fee
A key source of funding for Medi-Cal comes from taxes and fees assessed on health care providers, including private hospitals and health plans (also called managed care organizations, or MCOs). These taxes and fees are used to draw down additional federal funding for Medi-Cal, which allows California to reimburse providers, cover basic Medi-Cal costs that would otherwise be funded by General Fund dollars, and fund higher Medi-Cal payments to health care providers.
Provider taxes and fees need federal approval and must be periodically renewed. In California, most of the revenue raised by provider taxes/fees comes from two sources:
The MCO tax
- The MCO tax currently generates over $7 billion per year in net revenue. MCO tax proceeds are used to boost Medi-Cal provider payment rates as well as to cover basic Medi-Cal costs, reducing California’s General Fund costs for the program.
The Hospital Quality Assurance Fee
- The hospital fee raises over $5 billion per year. These revenues support supplemental payments to private hospitals and also cover basic Medi-Cal costs, reducing the state’s General Fund costs.
H.R. 1 changed federal rules to limit states’ use of provider taxes and fees. California’s current MCO tax expires at the end of 2026, and if the state receives federal approval for a new tax — which is not guaranteed — MCO tax revenue will decline substantially due to H.R 1’s restrictions as well as constraints imposed by Proposition 35, which California voters approved in 2024.
In addition, California’s hospital fee is in flux in the near term, but ultimately, revenue from the fee will also decline over the long term due to H.R. 1.
The governor’s revised 2026-27 spending plan acknowledges challenges to both the MCO tax and the hospital fee and proposes respective actions for each program. Specifically, the May Revision:
- Proposes a new MCO tax to comply with H.R. 1 restrictions.
- Highlights the Trump administration’s rejection of California’s recent proposal to update the Hospital Quality Assurance Fee program.
Counties Need More Support to Manage Federal Health Care Changes
The revised budget includes some additional funding to help counties implement major federal health policy changes tied to H.R. 1 and Medi-Cal eligibility operations, including new work requirements and more frequent eligibility checks. To help manage the increased administrative workload associated with these federal changes, the May Revision proposes a one-time increase of $262 million ($74 million General Fund) in 2026-27 for county administration. In addition, the May Revision includes $33 million for optional “surge staffing” support that counties could request for administrative activities such as data entry, application and renewal processing support, and responding to general call center inquiries. This funding is intended to provide supplemental administrative support capacity rather than directly expanding county eligibility staffing.
However, counties have indicated they will need significantly more funding to administer the new requirements effectively and help prevent eligible people from losing Medi-Cal coverage due to paperwork burdens or administrative barriers. Counties have also requested substantial additional support to address broader H.R. 1 impacts on county indigent care programs, public hospitals, behavioral health systems, and eligibility operations.
As more Californians lose Medi-Cal coverage due to new federal requirements and administrative hurdles, counties will likely face growing costs to provide care for uninsured residents who still need health services but can no longer access coverage.
State Leaders Can Protect Health Care Access Instead of Cutting Services
The governor and Legislature should work together to pursue alternatives to the harmful cuts that the May Revision outlines, many of which would disproportionately harm Californians who already face significant barriers to care, including immigrants, older adults, disabled people, and people with behavioral health needs.
Legislative leaders have already put forward proposals that would better protect access to health care and supportive services for Californians while helping address the state’s fiscal challenges. These proposals demonstrate that California has options beyond reducing coverage, limiting benefits, and shifting costs onto counties and low-income Californians.
At a time when federal policymakers are already undermining access to coverage and care, state leaders should prioritize policies that protect access to health care and support the long-term health and economic well-being of Californians.
Housing
May Revise Falls Short in Protecting California Renters
Access to a stable and affordable home is foundational to a healthy and prosperous life — especially for the more than 44% of Californians who rent their homes. Yet renters, predominantly Californians with low incomes, continue to face the greatest housing affordability challenges and are often left with little recourse when they’re on the brink of losing their homes or facing eviction. This hardship is also deeply unequal, as immigrants, and Black, Pacific Islander, and Latinx Californians are more likely to rent and have unaffordable costs due to longstanding racist and discriminatory policies that have blocked access to economic mobility and homeownership.
Yet the Governor’s May Revise does little to address California renters’ immediate housing stability needs or strengthen protections for those at risk of losing their homes. Notably, the May Revision:
- Does not provide funding for the expanded Renter’s Tax Credit included in the 2025-26 Budget Act.
- Provides no additional support for renters displaced by disasters, including the 2025 Los Angeles wildfires.
- Includes no new investments targeted for eviction legal defense or the judicial Homelessness Prevention program, even though formal evictions in California have surpassed pre-pandemic levels.
At the same time, the administration is proposing $100 million ($56 million General Fund and $44 million in existing National Mortgage Settlement Funds) for a new Disaster Rebuilding Fund to reduce borrowing costs and facilitate access to private financing for impacted homeowners. While these efforts are commendable, there is no comparable state assistance for renters who were also displaced or destabilized.
The May Revision does include six permanent positions and $838,000 in 2026-27, 2027-28, and 2028-29 for the Civil Rights Department (CRD) to reduce complainant wait time and increase settlements of employment and housing complaints. CRD enforces California’s Fair Employment and Housing Act (FEHA) which prohibits discrimination based on a protected characteristic, such as gender, race, national origin, sexual orientation, gender identity, or religion.
Still, the lack of investment in targeted legal eviction prevention is especially concerning given that evictions reached a high in 2024, the Homelessness Prevention program is nearly depleted, and more Californians are being pushed into homelessness faster than the state’s response systems can keep up (see Homelessness section). Plus, many legal aid providers that offer eviction defense are increasingly stretched, with some forced to shift limited capacity toward immigration-related legal services as federal enforcement pressures drive the need for assistance (see Immigration section).
May Revision Adds Red Tape to Homelessness Funding Without New Investments
California has both the resources and the responsibility to ensure every resident has a stable, dignified place to call home. In 2025, homeless service providers served over 358,000 Californians experiencing homelessness — demonstrating both the scale of need and the increased capacity of the state’s response systems. This progress was driven largely by prior one-time state investments that fund critical homelessness prevention and resolution services. These investments have produced real, measurable results, including the fact that over 110,000 Californians have been moved into permanent housing since 2023.
However, the May Revise maintains the administration’s stance from their January proposal on not including any additional or ongoing funding to address homelessness beyond what was promised last year. The revision reflects $500 million for Round 7 of the Homeless Housing, Assistance and Prevention Grant program (HHAP) in 2026-27. This is in contrast to the Senate’s budget plan which proposed an additional $500 million for HHAP Round 7, bringing the total to $1 billion. The Senate plan also went further by proposing an additional $1 billion for HHAP Round 8, for which the May Revise proposes no funding.
The administration stated HHAP Round 7 will require additional accountability measures, including having a pro-housing designation, local matching funds, and a compliant housing element. While encouraging local governments to become partners in addressing homelessness has merit, tying service provider funding to decisions outside of their control — such as a local government having a pro-housing designation or a compliant housing element — is problematic. Depending on the specific details of the proposal, a matching fund requirement may also be insurmountable for many localities currently facing budget deficits.
Additionally, the May Revision maintains the proposed reductions for the Bringing Families Home (BFH), Home Safe, and Housing and Disability Advocacy programs. Both BFH and Home Safe will sunset soon without additional funding, despite strong evidence they are effective.
Homelessness and Health Care
The revised budget proposes various cuts to the Medi-Cal program, a core pillar of California’s homelessness response for individuals with the most acute health needs (for more see Health Coverage, Affordability & Access section). Key changes include:
Federal Threats to Homelessness
Lastly, the administration does not address the ongoing threats to federal rental assistance programs or the Continuum of Care program. It also includes no funding for Californians holding Emergency Housing Vouchers set to expire by the end of the year as Congress failed to provide enough funding to fully transition all recipients onto standard housing vouchers.
The Administration Fails Again to Prioritize Funding for Affordable Housing
Every Californian deserves a safe, affordable home — an attainable reality in a state as resourceful as California. Over the past seven years, state policymakers have made notable progress in streamlining housing development and have invested in affordable housing. However, state General Fund dollars have comprised only a small share of funding to support affordable housing development, and this share has drastically declined in recent years. This harmful trend continues as the revised budget, as with the January proposal, once again proposes no new state funds for affordable housing.
Instead, the May Revision continues to emphasize the new California Housing and Homelessness Agency (CHHA), set to launch in July, as its answer to the housing shortage. The administration includes resources to support the continuity of operations as the agency reorganizes, including transferring positions and other needs. It also proposes:
- Statutory language making affordable housing projects ineligible for competitive state funding if the local government serving as lead or co-applicant imposes development impact fees on the project. These provisions would apply to funding notices issued after July 1, 2027.
- Reappropriating $7 million of unawarded Infill Infrastructure Grant Program funds to assist construction of additional infill infrastructure and housing projects.
This stands in stark contrast with the Senate’s budget plan which would provide $1 billion for affordable housing programs, including the Multifamily Housing Program and state Low Income Housing Tax Credits — both of which are critical to building homes for Californians with the lowest incomes. The Senate plan also proposes $1 billion for homeownership programs, including the California Dream for All program which provides shared appreciation loans for certain first-time homebuyers, and the CalHOME program to help in the construction of affordable housing. The governor’s May Revision fails to fund these programs.
The administration is also silent on the California Air Resources Board (CARB) proposed regulations for the Cap-and-Invest program, which would drastically reduce revenue for the Greenhouse Gas Reduction Fund, effectively zeroing out funding for the Affordable Housing and Sustainable Communities program (AHSC). AHSC was restructured by the administration and the Legislature just last year to provide more funding for certain affordable housing projects. It also does not express support for the Affordable Housing Bond Act of 2026, currently moving through the Legislature, which can provide critical funds to several nearly depleted affordable housing programs — a bond Assembly Democrats explicitly support.
Economic Security
Governor’s Budget Falls Short in Preparing for Significant CalFresh Cuts
The Supplemental Nutrition Assistance Program (SNAP) — known as CalFresh in California — is the state’s most powerful tool in the fight against hunger. The federal Republican megabill, H.R. 1, introduced historic cuts to the SNAP program, which will reduce household monthly benefits for the 5.5 million Californians who depend on CalFresh to put food on the table.
Additionally, roughly 1 million Californians are at risk of losing their CalFresh assistance entirely due to expanded time limits and eligibility restrictions tied to immigration status. The revised budget proposes some funding to mitigate the harm, but falls significantly short of addressing the need. Specifically, the revised budget includes:
- $30 million one-time funding for counties to support additional workload associated with implementing the burdensome CalFresh time limits expanded by H.R. 1. This amount is less than one-third of what counties anticipate spending in the 2026-27 fiscal year, according to a recent budget hearing, to prepare for the time limit implementation that will begin June 1, 2026.
- $30 million one-time funding to support local food banks. The one-time funding would be in addition to the $8 million baseline funding the CalFood program receives, however it is a decrease from the annual $60 million allocation the program has received in recent years. In contrast, the Senate Democrats’ recent budget proposal included $100 million for CalFood to support local food banks.
The revised budget also maintains the commitment to expand the California Food Assistance Program (CFAP) to all income-eligible Californians ages 55 and older in October 2027, but makes no commitment to further expand the program to support humanitarian immigrants under the age of 55 and people impacted by the time limits. The May Revision also maintains full funding for universal school meals and the SUN Bucks program. However, the expected rise in food insecurity as people begin to lose their food assistance requires much bolder action than this revised budget provides.
Revised Budget Maintains Funding for CalWORKs and Refundable Tax Credits
California’s cash assistance programs provide critical support for families, youth, and children with low incomes across the state. As California continues to face high poverty rates and millions of people are struggling to afford basic needs, programs such as the California Work Opportunity and Responsibility to Kids (CalWORKs) program and the state’s refundable tax credits remain essential tools for promoting economic mobility and reducing hardship. The governor’s revised spending plan maintains funding for these key supports but does not propose significant new investments to further strengthen assistance for California families with low incomes.
CalWORKs remains one of California’s core anti-poverty programs, providing modest cash assistance and supportive services to families with low incomes, particularly Black and Latino families who face longstanding inequities in income and wealth. The revised budget largely preserves funding for this program at previous years’ levels, but does include a 1.8% increase to CalWORKs grants, estimated to cost $59.6 million in 2026-27. This increase is required under AB 85 (2013), which links annual grant increases to growth in certain 1991 realignment revenues deposited into the Child Poverty and Family Supplemental Support Subaccount, and does not require a General Fund appropriation.

case Study: Clever Strategy Allowed California to Raise New Revenue Following Federal Tax Cuts
In 2019, California selectively conformed to parts of the federal Tax Cuts and Jobs Act, enacted during President Trump’s first term, and raised over $1 billion in new, ongoing annual revenue — boosting K-14 education and expanding tax credits for working families.
The revised spending plan also maintains California’s refundable income tax credits, including the California Earned Income Tax Credit (CalEITC), Young Child Tax Credit (YCTC), and Foster Youth Tax Credit (FYTC), at current levels. Together, these credits help millions of families and individuals with low incomes afford basic needs in the face of mounting affordability challenges.
At the same time, recent federal attacks and proposals that threaten funding streams supporting CalWORKs and other basic needs programs, like sunsetting funding for key housing support programs (see Homelessness section), underscore the importance of protecting and strengthening California’s core supports for children and families with low incomes. As economic pressures persist, maintaining existing investments alone will not be sufficient to ensure families can meet their basic needs and achieve long-term stability, highlighting the need for California to strengthen its tax base over the long-term to support investments that build toward economic security for all Californians.
Revised Budget Plan Slashes Programs and Services for Older Adults and Californians with Disabilities
All Californians should be supported and treated with dignity in their communities regardless of their age, ability, race, gender, or economic status. However, Californians with disabilities and older adults face significant barriers, with increased risks of not meeting their basic needs, experiencing poverty, and becoming homeless. In addition, older adults and people with disabilities are already facing increased instability due to new harmful policies from the Republican megabill H.R.1 that threaten their access to health care and food assistance.
Despite this reality, the governor’s revised budget disproportionately reduces the funding for and accessibility of programs that support older adults and Californians with disabilities, even though the services provided through programs like In-Home Supportive Services (IHSS) provide a lifeline to hundreds of thousands of Californians.
Specifically, the May revision:
- Maintains multiple harmful cuts from the January proposal to In-Home Supportive Services (IHSS) totaling almost $240 million in reductions across 2026-27 and 2027-28.
- Reinstates Medi-Cal asset test limits for older adults and Californians with disabilities.
- Proposes multiple harmful provisions that will severely limit older immigrants’ access to Medi-Cal.
- Eliminates $70 million General Fund in 2026-27 and ongoing for the Adult Protective Services (APS) expansion.
- Enforces a lower rate cap for Program of All-Inclusive Care for the Elderly (PACE) organizations.
Other proposals in the revised spending plan include:
- Maintaining the current investment in the Supplemental Security Income/State Supplementary Payment (SSI/SSP) program.
- Investments in the Department of Developmental Services (DDS) to improve program administration.
Programs like Medi-Cal, IHSS, and SSI/SSP help to ensure that older adults and Californians with disabilities can receive the support they deserve and are able to meet their basic needs. The combined state and federal threats to multiple core programs could be devastating to the people in these communities that rely on them. The Senate budget framework reflects a stronger commitment to preserving these services and demonstrates the role state leaders should assume in protecting all Californians through the budget.
Child Care Expansion at an Indefinite Standstill Despite Substantial Need
Publicly funded child care plays an integral role in the healthy development of children and California’s economy. However, child care is a broken market in which families cannot afford to pay the cost of what it takes to provide care. As a result, child care is unaffordable for families, and pay is unsustainably low for providers.
California’s publicly funded child care programs play a critical role in helping to bridge this market failure by offering eligible families child care at low/no-cost, with family fees capped at 1% of a family’s income. The demand for these programs far exceeds the supply, with only 16% of children eligible for programs actually enrolled. Moreover, recent and ongoing federal threats to California’s child care funding increases the urgency for state leaders to provide needed resources to these essential programs.
Regarding child care funding and subsidized spaces, the governor’s revised budget:
- Funds California Department of Social Services (CDSS) child care and development programs at $7.5 billion.
- Does not fulfill promised 44,000 subsidized child care spaces.
- Includes modest funding for child care infrastructure.
In addition to funding for subsidized spaces, California needs a stable child care provider workforce to sustain and expand programs. However, California child care providers continue to receive low wages, exacerbating racial and gender inequities and threatening to destabilize the system. In an effort to improve child care provider pay, in April 2023 the state began the process of developing an alternative methodology to pay providers based on the “true cost of care.” The state’s version of the alternative methodology was completed during summer 2025, and the state has since moved on to a process for determining how the “cost of care” estimates will result in a “single rate structure” for paying child care providers. Fundamental to this process is ensuring that the final rates reflect fair and just pay for providers. Related to provider pay, the revised budget:
- Reduces the proposed cost-of-living adjustment (COLA) for child care providers.
- Halts implementing prospective pay for providers.
- Lacks clarity on timeline for implementing rates based on a single rate structure.
Revised Budget Continues to Impose Harm on Immigrants
Immigrants and their families are deeply ingrained in the state’s social fabric. They are members of the state’s workforce, pay taxes, attend schools, own businesses, and raise families who invest in local communities. Over one-half of all California workers are immigrants or children of immigrants, and more than 2 million Californians are undocumented, according to estimates. Undocumented immigrants in California make significant contributions to state and federal revenues, contributing $8.5 billion in state and local taxes in 2022, despite their exclusion from most public benefits.
Since 2025, state and federal policies have targeted immigrants, limiting their access to health care, food assistance, and other critical services, all while their lives have been severely under threat due to an unprecedented increase in immigration detention and deportation.
At a time when the federal government is increasingly attacking immigrant communities, it is more critical than ever that California state leaders ensure the safety and well-being of all people, especially undocumented immigrants, and maintain prior commitments to making an equitable state for everyone. In the revised budget, the governor continues to strip health care from immigrant Californians. Specifically, the 2026-27 revised budget:
- Increases Medi-Cal premiums for certain immigrants.
- Denies full-scope Medi-Cal to immigrants with humanitarian status.
- Applies federal work requirements to immigrants who receive state-funded Medi-Cal.
- Shifts certain immigrants to fee for service Medi-Cal.
In contrast to the governor’s revised budget, the Senate budget plan takes meaningful action to protect immigrant Californians. California Senate Democrats propose to delay both the elimination of dental benefits for certain groups of immigrants and the implementation of $30 monthly premiums to January 1, 2028. They also reject the governor’s proposal to deny full-scope Medi-Cal for immigrants with humanitarian status.
The governor’s revised budget does include some small, but meaningful, support for immigrants. The May Revision:
- Maintains previous commitments to expand the California Food Assistance Program (CFAP) to include undocumented adults age 55 and older beginning in October 2027. However, it does not include any expansion to other age groups or account for the immigrant exclusions in H.R. 1 (see Food Assistance Section).
- Provides one-time funding for immigration legal services. The governor’s revised budget includes $20 million in one-time General Fund dollars to help Californians who are facing immigration court proceedings. This legal aid comes at a critical time when immigrants’ lives continue to be under increased threat and immigration enforcement activity is heightened, though this is notably less than the $50 million in legal aid proposed in the Senate budget plan (see Protecting Renters section).

Want to Better Understand
the State Budget?
The Budget Center’s essential resources for understanding and navigating the California state budget — all in one place.
Education
Growth in Education Funding Continues Resource Expansion for Schools
Education begins in the earliest years, preparing children and youth to transition into the TK-12 and higher education systems. Publicly funded education programs play a critical role in the development, learning, and well-being of children and youth in California. Investing in them through these programs helps to ensure that children and youth are prepared for school and adulthood.
Growth in revenue estimates boosts funding to schools and community colleges through the Proposition 98 Guarantee. The revised budget proposal maintains significant new investments included in January and includes additional investments that expand services, help schools and colleges address rising costs, and strengthen prior initiatives. Given the instability of federal funds and other federal actions, these investments help ensure the state continues its commitment to addressing key educational challenges confronting Californians.
However, there are still major challenges ahead to ensure the state provides the resources to meet student needs, needs that also extend beyond education. Federal cuts to vital health care and safety net programs put students and families at greater risk of being able to make ends meet, thus putting their educational success at a greater risk. The May Revision does little to help address these federal cuts (see Health and Economic Security sections). Balancing across helping Californians meet basic needs and adequately funding TK-14 education is especially challenging considering the context of the current federal climate and state budget landscape.
Growth in Revenue Estimates Significantly Increases the Prop. 98 Guarantee
Approved by voters in 1988, Proposition 98 constitutionally guarantees a minimum level of annual funding for TK-12 schools, community colleges, and the state preschool program. The Prop. 98 guarantee reflects changes in state General Fund revenues, which means that increases or decreases to revenue estimates adjust the minimum guarantee funding levels. For example, when the state revenues increase due to policy changes or overall economic growth, funding available for TK-12 schools and the community colleges generally increases.
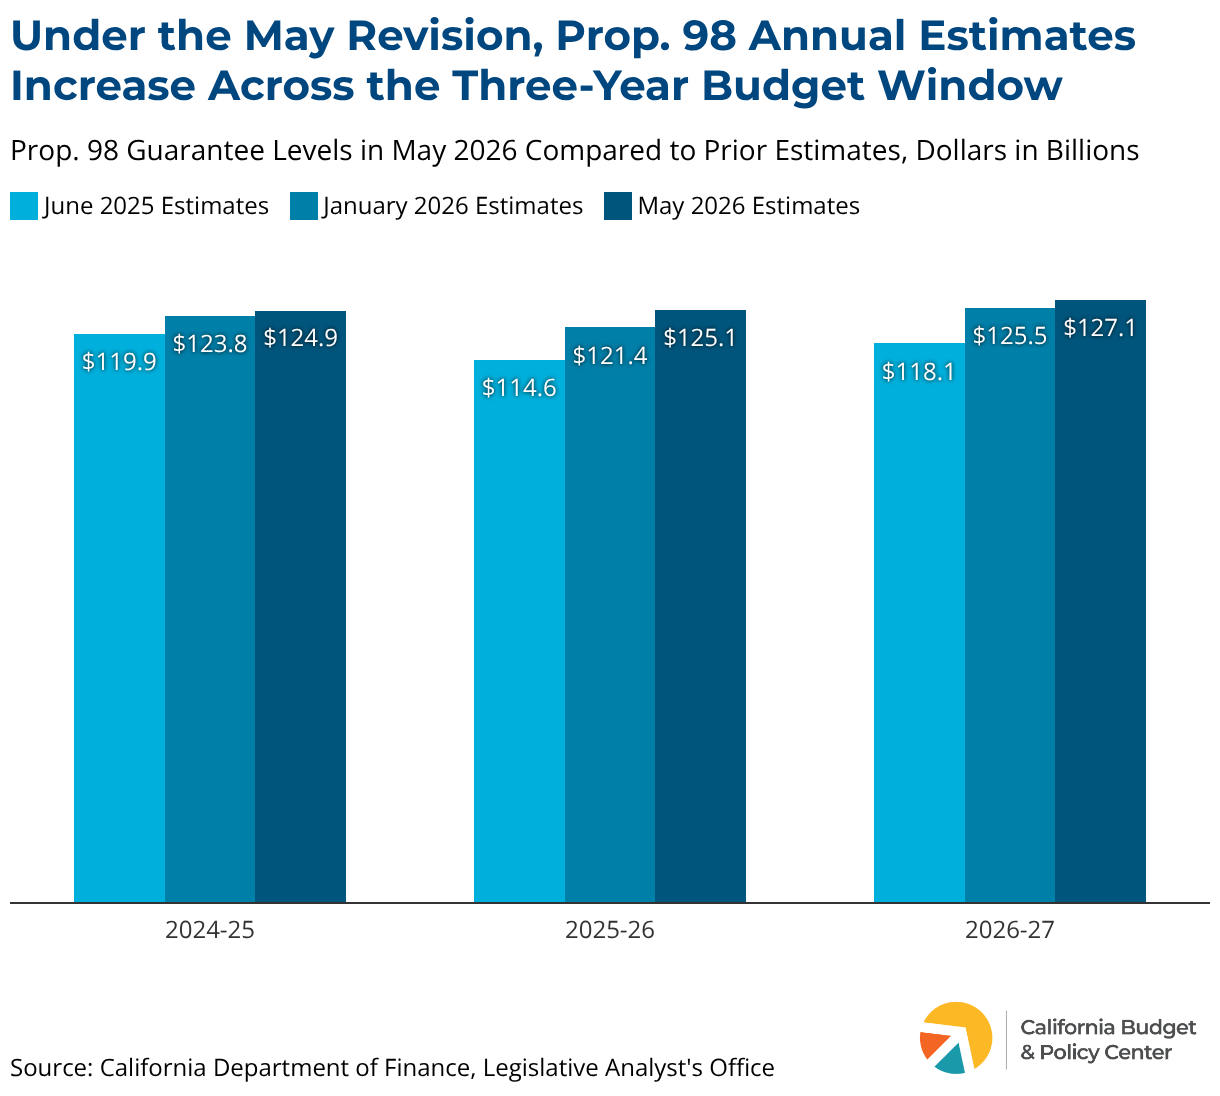
Under the 2026-27 revised budget proposal, Prop. 98 estimates increase by $24.5 billion across the three-year budget window compared to the estimates in the June 2025 enacted budget (this overall growth figure differs from Department of Finance’s figure of $28 billion because the Budget Center uses the 2026-27 projection from June 2025, as opposed to the 2025-26 estimate in June 2025). This growth is primarily driven by growth in revenues (see Revenues section), which also require the state to restore prior reductions and to increase deposit amounts into the Public School System Stabilization Account (also referred to as the Prop. 98 reserve).
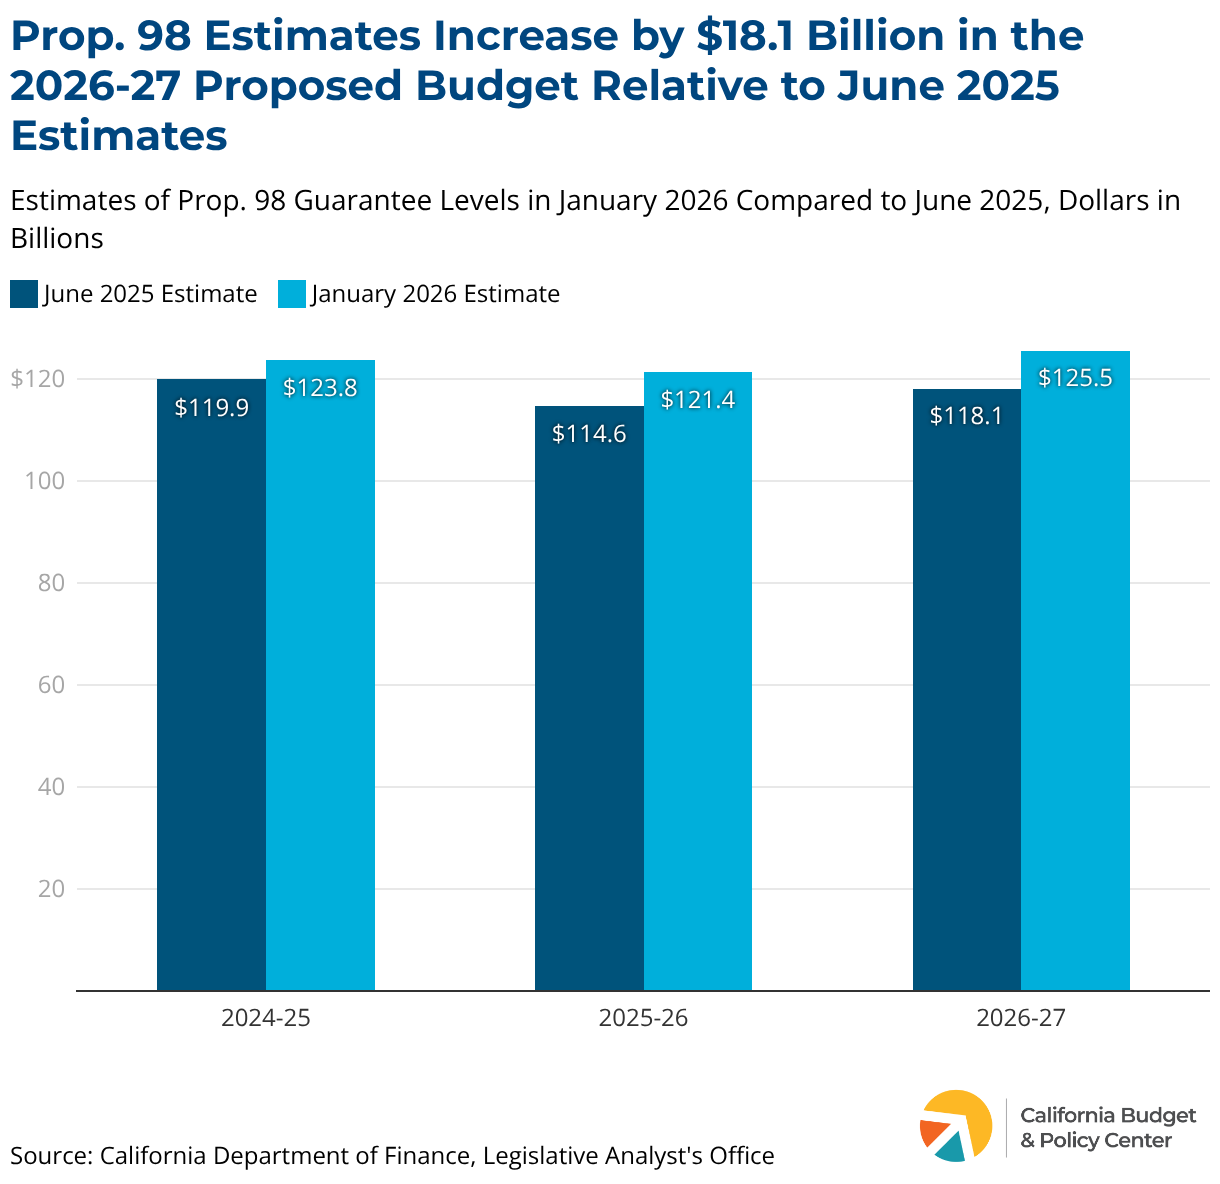
The chart below shows updated projections of the guarantee as of the 2026 May Revision compared to projections in the January budget proposal and the June 2025 enacted budget.
Prop. 98 updated estimates and proposed adjustments in the revised spending plan include the following:
- For 2024-25, the guarantee is revised up to $124.9 billion from prior estimates. Given revenue growth, this updated minimum guarantee level also reflects a higher maintenance factor payment, which is fully repaid under May Revision estimates. The maintenance factor represents the funding gap created when the state suspended Prop. 98 in 2023-24, and stronger revenues have allowed the state to fully close that gap.
- For 2025-26, the guarantee is revised up to $125.1 billion from previous estimates. The governor maintains a proposal to fund the guarantee at a lower level than what the formulas require. In the revised spending plan, the governor reduces the size of the “settle-up” payment to $3.9 billion from $5.6 billion, which would provide schools and community colleges $121.1 billion rather than $125.1 billion. This approach serves two purposes: it helps prevent an overappropriation if revenues drop, and it helps balance the budget on the non-Prop. 98 side.
- The 2026-27 estimate also increased compared to prior estimates — $1.6 billion higher in May compared to the January budget proposal. Also, compared to previous estimates, a withdrawal from the Prop. 98 reserve is no longer necessary to meet the guarantee in 2026-27.
The revised spending plan also adjusts deposits and withdrawals for the Prop. 98 reserve. Across the three-year budget window, the constitutionally required deposits increase to $8.7 billion. Moreover, the revised proposal also includes a discretionary deposit of $1.6 billion for a total reserve balance of $10.3 billion. See Reserves section for more on budget reserves.
Transitional Kindergarten and State Preschool Largely Continue as Planned
The California Department of Education (CDE) hosts two early learning and care programs: Transitional Kindergarten (TK) and the California State Preschool Program (CSPP). CSPP provides preschool to children ages 3 and 4 for families with low to moderate incomes (and temporarily to 2-year-olds until July 2027). TK serves 4-year-olds, and eligibility is based on age and is not dependent on family income. Together, CSPP and TK are cornerstones of CDE’s Universal Preschool plan, intended to bring more early learning and care options to 3- and 4-year-olds in California. However, as California strives to create a mixed delivery system that centers the needs of families, the administration has the opportunity to spend resources and implement policies in a way that integrates CSPP and TK with the broader early learning system to best support families with young children.
The governor’s revised budget:
- Fully funds Transitional Kindergarten and maintains commitment to reduced ratios.
- Augments but generally maintains CSPP funding for both community and school-based programs.
- Aligns with the California Department of Social Services (CDSS) child care and development programs on changes to provider pay.
May Revision Boosts Education Funding with Ongoing and One-Time Resources
The largest share of Proposition 98 funding goes to California’s school districts, charter schools, and county offices of education (COEs), which provide instruction to 5.9 million students. Education funding flows primarily through the Local Control Funding Formula (LCFF), an allocation mechanism that provides school districts, charter schools, and COEs a base grant per student, adjusted to reflect the number of students at various grade levels, as well as additional grants for the costs of educating English learners, students from low-income families, and foster youth. Other funds flow through a number of categorical programs such as the Expanded Learning Opportunities Program, special education, and other shorter-term investments.
Given growth in available resources for schools, the May Revision expands the investments included in the January budget proposal. The revised spending plan provides a higher than required cost-of-living-adjustment (COLA) to the school funding formula, provides a higher increase to special education, and substantially increases a one-time discretionary block grant for school districts. Notable adjustments in the May Revision include:
- $2.5 billion to fund COLAs for the LCFF and other non-LCFF categorical programs.
- $2.2 billion to further increase per student funding for special education.
The May Revision also maintains other major ongoing investments, including $1 billion to sustain the California Community Schools Partnership Program and $62.4 million to further strengthen the Expanded Learning Opportunities Program (ELOP).
The revised spending plan also includes additional investments to support districts with increased costs and strengthen the education workforce, mostly through one-time investments. Those include:
- A $5 billion one-time discretionary block grant for schools.
- More than half a billion dollars to support the education workforce through a mix of different investments.
Overall, the May Revision directs substantial additional resources toward California’s schools, with investments spanning ongoing increases to the school funding formula, special education, and a range of one-time workforce and programmatic grants.
May Revision Builds on Community College Investments
A portion (about 11%) of Proposition 98 funding provides support for California’s Community Colleges (CCCs), the largest postsecondary education system in the country, which serves high percentages of students of color and students with low incomes. CCCs prepare more than 1.8 million students to transfer to four-year institutions or to obtain training and employment skills.
- Allocates $476 million to provide a higher COLA for the community colleges funding formula and other programs.
- Slightly increases funding for enrollment growth.
- Includes additional one-time investments.
The budget also maintains other one-time and ongoing investments from the January budget proposal. That includes $38.1 million to increase funding for Calbright College, California’s online community college and $78 million to further expand a common cloud data platform and continue implementation of credit for prior learning efforts as part of the Master Plan for Career Education.
Justice System
Budget Projects Drop in Prison Population, Fails to Propose Prison Closures
Roughly 89,500 adults convicted of a felony offense are serving their sentences at the state level, down from a peak of 173,600 in 2007. This sizable drop in incarceration is largely due to a series of justice system reforms adopted by state policymakers and the voters since the late 2000s, including Proposition 47, which California voters passed in 2014. (See Prop. 47 investments section.)
Despite this substantial progress in reducing incarceration, American Indian, Black, and Latinx Californians are disproportionately represented in state prisons — a disparity that reflects racist practices in the justice system as well as the social and economic disadvantages that communities of color continue to face due to historical and ongoing discrimination and exclusion.
Among all incarcerated adults, most — around 86,400 — are housed in state prisons designed to hold roughly 71,100 people. This overcrowding equals about 122% of the prison system’s “design capacity,” which is below the prison population cap — 137.5% of design capacity — established by a 2009 federal court order. California also houses around 3,200 people in facilities that are not subject to the cap, including fire camps, community-based facilities that provide rehabilitative services, and Department of State Hospitals facilities.
The governor’s revised spending plan:
- Provides $14.2 billion General Fund for the California Department of Corrections and Rehabilitation (CDCR) in 2026-27, up from $13.8 billion as proposed in January.
- Projects that the prison population will decline in the coming years.
- Fails to advance a plan to continue downsizing the state prison system.
Revised Budget Includes No New Funding to Address Proposition 36’s Unfunded Mandate
In 2024, voters approved Proposition 36, increasing penalties for certain drug and theft offenses. For example, Prop. 36 reversed some of the sentencing reforms put in place by Prop. 47 of 2014. In addition, Prop. 36 established a new process allowing prosecutors to charge people with a “treatment-mandated felony” for possessing illegal drugs. Yet, even with Prop. 36, most of the justice system reforms adopted by state policymakers and voters over the past couple of decades remain in effect.
By increasing punishment for drug and theft crimes, Prop. 36 has created new costs — including for incarceration, probation, and the courts — at the state and local levels. However, Prop. 36 amounts to a huge unfunded mandate that leaves state and local policymakers holding the bag. The measure provided no new revenue to pay for these additional state and local costs — even though Californians were promised that Prop. 36 would provide evidence-based treatment, housing solutions, and programs to increase community health and safety. Instead, Prop. 36 assumes that state and local officials can accommodate the measure’s costs in their already strained budgets.
As a result, state and local leaders have to decide how to pay for the unfunded costs created by Prop. 36 even as they struggle to close budget deficits for the upcoming fiscal year and beyond.
The governor’s revised budget:
- Does not provide new funds to help address Prop. 36’s unfunded costs at the state or local levels. Instead, the governor suggests that some of the savings generated by Prop. 47 could be used to pay for Prop. 36 court-ordered treatment programs (see Prop. 47 investments section). This approach — shifting Prop. 47 dollars to pay for Prop. 36 programs — would displace important mental health and substance use services that otherwise would be funded through Prop. 47.
May Revision Projects Decline in Proposition 47 Savings in Coming Years
Passed by voters in 2014, Proposition 47 reduced penalties for six nonviolent drug and property crimes from felonies to misdemeanors. As a result, state prison generally has not been a sentencing option for these crimes. Instead, people convicted of a Prop. 47 offense have served their sentence in county jail and/or received probation.
However, with the passage of Prop. 36 in November 2024, some of Prop. 47’s sentencing reforms have been reversed. Key changes enacted by Prop. 36 as well as their potential impact are described at the end of this section.
How Prop. 47 Savings Are Determined and Allocated
By decreasing state-level incarceration beginning in 2014, Prop. 47 reduced the cost of the prison system relative to the expected cost if Prop. 47 had not been approved by voters. The state Department of Finance is required to annually calculate these state savings, which are deposited into the Safe Neighborhoods and Schools Fund and used as follows:
- 65% for behavioral health services — which includes mental health services and substance use treatment — as well as diversion programs for individuals who have been arrested, charged, or convicted of crimes. These funds are distributed as competitive grants administered by the Board of State and Community Corrections.
- 25% for K-12 school programs to support vulnerable youth. These funds are distributed as competitive grants administered by the California Department of Education.
- 10% to trauma recovery services for crime victims. These funds are distributed as competitive grants administered by the California Victim Compensation Board.
California Has Allocated $908 Million in Prop. 47 Funds Through 2025-26
From 2016-17 through the current fiscal year (2025-26), California has allocated $908 million in state prison savings attributable to Prop. 47. These funds have been invested in local programs that support healing and keep communities safe.
For example, research has found that people who received Prop. 47-funded behavioral health services and/or participated in diversion programs were much less likely to be convicted of a new crime. Individuals enrolled in these programs had a recidivism rate of just 15.3% — two to three times lower than is typical for people who serve prison sentences (recidivism rates range from 35% to 45% for these individuals).
May Revision Estimates $89 Million in Prop. 47 Savings to Invest in Local Communities in 2026-27
The budget estimates $89.1 million in Prop. 47 savings due to reduced state-level incarceration — dollars that will be invested in local communities starting in 2026-27. (These savings are attributable to the 2025-26 fiscal year, but will become available for expenditure in 2026-27.) With these additional funds, Prop. 47’s total investment in California’s communities will reach almost $1 billion, up from the current $908 million (through 2025-26).
Prop. 47 Savings Will Decline Due to Prop. 36
With the passage of Prop. 36 in November 2024, voters increased penalties for certain drug and theft offenses, including by reversing some of Prop. 47’s sentencing reforms (see Prop. 36 Impacts section). For example, Prop. 36 allows simple drug possession, petty theft, and shoplifting to be charged as felonies in certain circumstances. Under Prop. 47’s rules, these crimes were generally misdemeanors.
The administration estimates that the longer sentences allowed by Prop. 36 will increase the prison population by 592 in 2025-26 and by about 1,550 upon full implementation. (The overall prison population is projected to continue to decline due to the offsetting impact of justice system reforms that remain in effect.) At the same time, the annual savings from Prop. 47 is expected to drop substantially, falling from $91.5 million in 2025-26 to $89.1 million in 2026-27 to $77.3 million in 2027-28 — a nearly 16% decline over this period. Prop. 36 is a key contributor to this sizable drop.
In short, because of Prop. 36, tens of millions of dollars that would otherwise have supported behavioral health treatment and other critical services over the coming years is expected to be shifted back to the state prison system.
Revised Budget Includes One-Time Funds to Address Crime and Support Survivors
The May Revision includes several one-time General Fund investments to support victims of crime, including:
- $25 million to backfill declining federal support for crime survivors. Federal funds provided through the Victims of Crime Act (VOCA) help to support critical services like counseling, emergency shelter, and financial assistance for crime survivors, including survivors of domestic and sexual violence. Declining federal VOCA funding has reduced support for organizations that provide these services. The governor’s proposed one-time funding would “significantly alleviate” the service reductions that “would otherwise be necessary,” according to budget documents.
- $10 million to combat human trafficking. These funds would be competitively awarded through a “vertical prosecution” grant program aimed at preventing human trafficking. In a vertical prosecution, a single prosecutor handles the case from the outset. This provides several benefits, including the opportunity for the prosecutor to establish rapport with the victims and better understand the details of the case.
- $10 million to help solve cases involving missing and murdered indigenous people (MMIP). These funds would be awarded on a competitive basis to federally recognized Indian tribes to support efforts to publicize, investigate, and solve MMIP cases. The state has provided $37 million to support MMIP grants in recent years.
Other Key Issues
Governor Hints at Coming Effort to Protect Elections Against Federal Threats
California faces unprecedented election threats. President Trump continues to lie about voter fraud and is pressuring states to turn over voter registration rolls, floating the possibility of stationing US Immigration and Customs Enforcement (ICE) agents at polling locations, and threatening to “take over” the 2026 midterm elections. Moreover, the US Supreme Court appears poised to prohibit states like California from counting mail-in ballots that arrive after election day, potentially disqualifying hundreds of thousands of late-arriving ballots in November.
Election threats are also coming from within California: The Riverside County Sheriff recently confiscated and attempted to recount 650,000 ballots citing baseless claims of voter fraud pushed by conspiracy theorists.
Countering these threats and protecting Californians’ right to vote requires a range of responses, including new state investments. The state typically provides only a small amount of funding to support elections, which are overseen by California’s 58 counties. (The state does pay most or all of the cost of one-off elections, such as a gubernatorial recall, but those are rare.) Instead, counties and other local governments cover most typical election expenses using property taxes and other locally generated revenues. In other words, even though the state reaps substantial benefits from county oversight of elections, it fails to pay its fair share of those costs.
The 2026 midterms won’t be a “business as usual” election, so state funding should not be stuck in the past. This year, additional state funds are needed to support:
- Outreach and education to encourage Californians to vote early,
- Expanded access to vote centers and ballot boxes,
- Expedited ballot processing,
- Statewide law enforcement coordination to protect against election interference, including attempts by rogue county sheriffs to seize ballot boxes, and
- Cybersecurity, election monitoring, and post-election litigation.
While the May Revision does not include additional state funding for elections, it does indicate that the governor and legislative leaders will — through the budget process — “identify ways to continue to protect democracy” in California. This suggests that in the coming weeks, state leaders will unveil new funding commitments and other changes that aim to defend against election interference, support county election administration, and protect Californians’ right to vote.