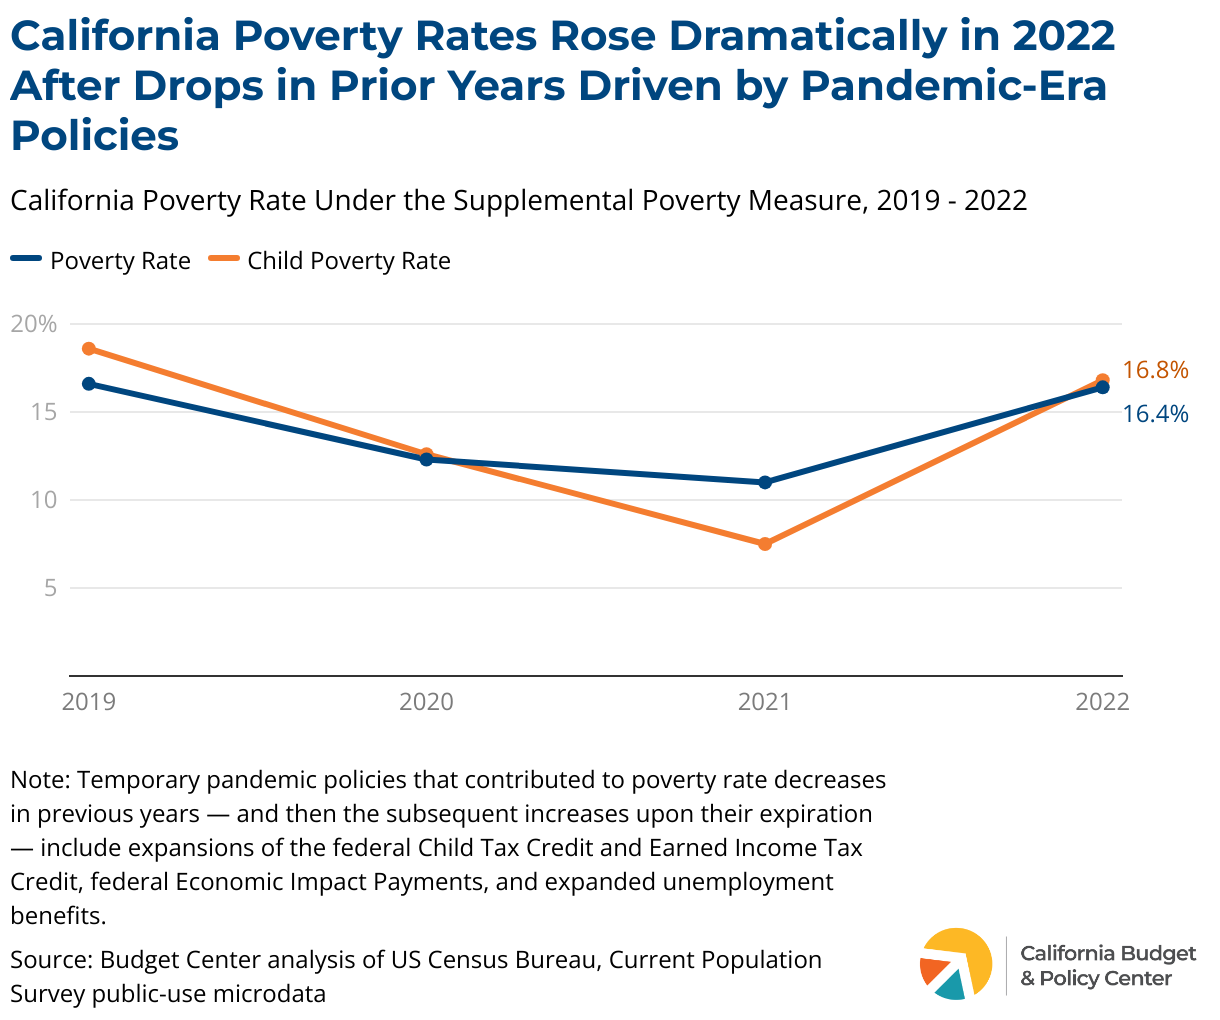
The end of the pandemic-era investments in the Child Tax Credit and other federal policies that help families make ends meet led to a huge increase in poverty in 2022 in California.
Nationally, 2022 marked the biggest increase in poverty in over 50 years, and California showed a similarly distressing trend. This increase marks a huge step backwards given the historic drop in child poverty in 2021 spurred by pandemic-era public investments in the Child Tax Credit (CTC) and other policies that help families make ends meet. The facts highlighted in the proceeding narrative draw on an analysis of the US Census Bureau’s Supplemental Poverty Measure to compare poverty rates from 2021 to 2022 and show how federal policy decisions have pushed more families into poverty.
Poverty Rose Dramatically, Exacerbating Racial Inequities
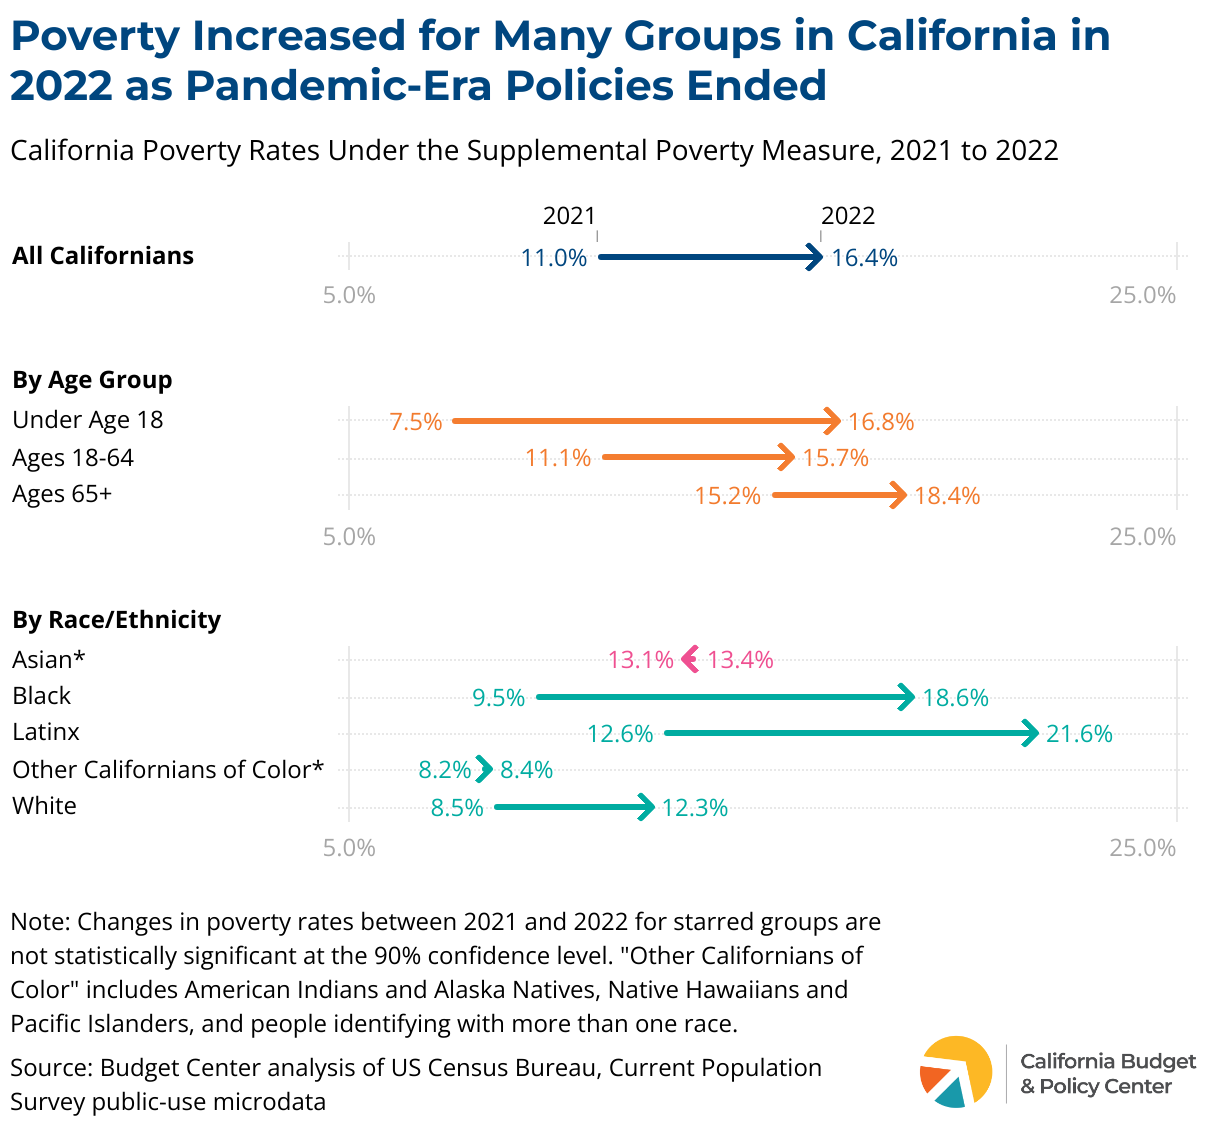
From 2021 to 2022, the poverty rate across all Californians increased from 11.0% to 16.4%. Among age groups, child poverty (under age 18) rose the most, with the 2022 rate over twice the rate of 2021. This increase comes after two years of declines in child poverty, illustrating a step backward in policies that support child economic well-being.
The increase in poverty was especially striking for Black and Latinx Californians whose poverty rates nearly doubled from 2021 to 2022. Since the expiration of key pandemic-era policies, recent analyses highlighted that Black and Latinx Californians have been more likely to struggle with paying basic expenses, underscoring that the end of pandemic supports have furthered racial inequities. Specifically, in 2022, nearly one in five Black Californians and more than one in five Latinx Californians are back in poverty.
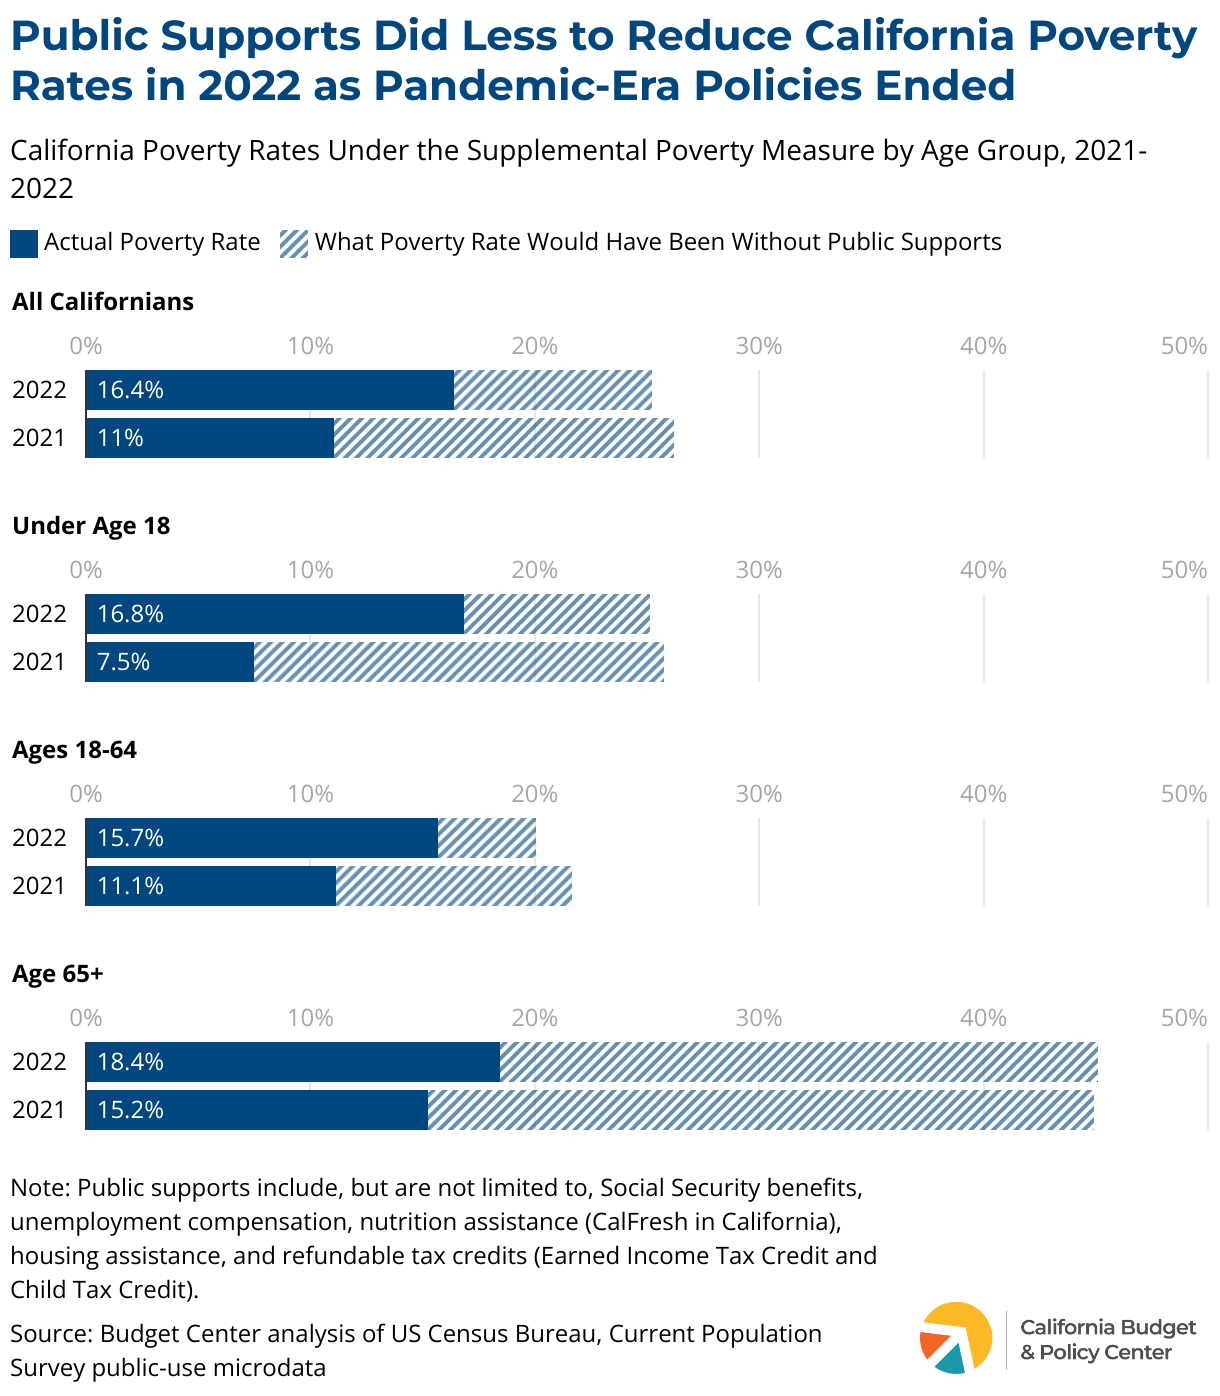
Rise in Poverty Reflects End of Anti-Poverty Investments
Major pandemic-era federal policies that lifted many Californians out of poverty in 2021 — including the expanded CTC — ended in 2022. This severely weakened our system of public supports that helps families and individuals meet basic needs, pushing more Californians — particularly children as well as Black and Latinx Californians — into poverty.
Specifically, public supports cut California’s child poverty rate by more than two-thirds in 2021 when major pandemic-era policies like the expanded CTC were in place. This helped push the child poverty rate down to 7.5%. But in 2022, when those policies ended, public supports reduced the child poverty rate by only one-third, contributing to a more than doubling of the child poverty rate to 16.8% that year.
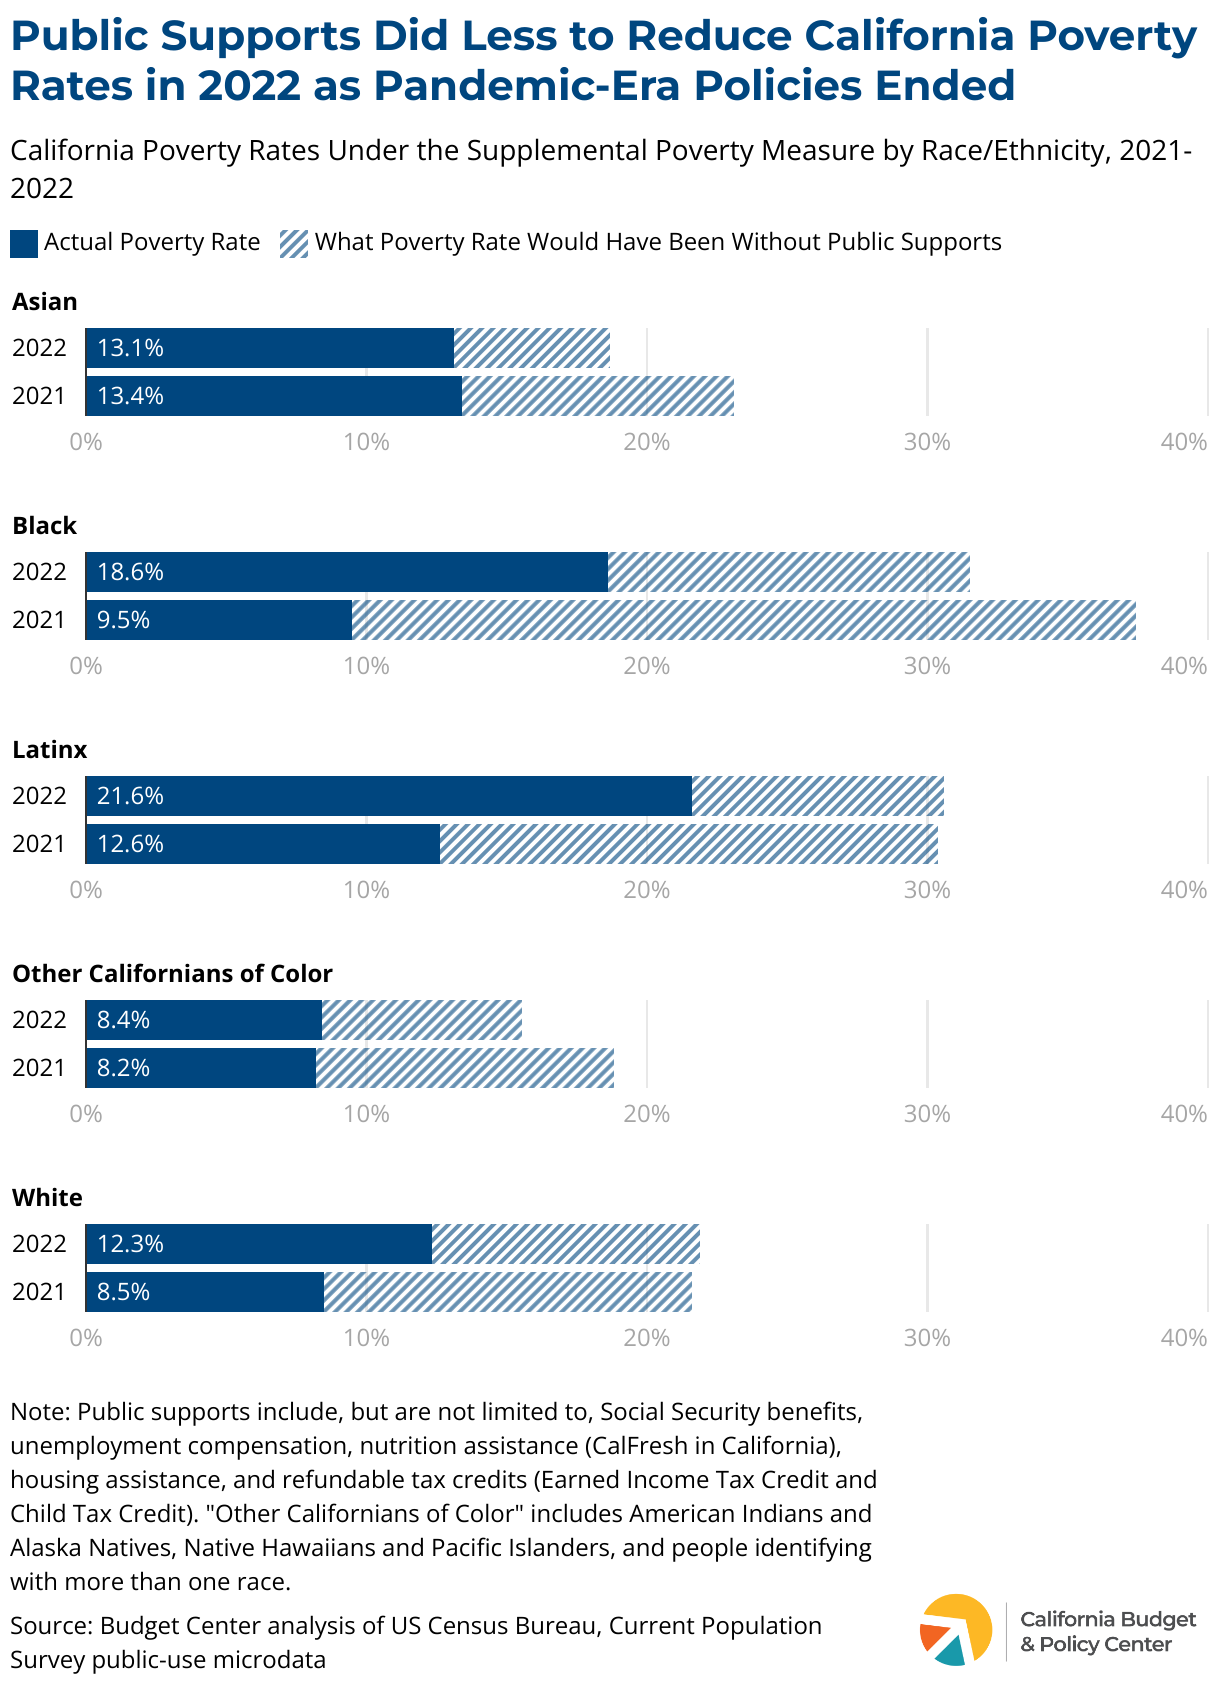
Similarly, the end of major pandemic-era federal policies also helped drive up the poverty rate for Black and Latinx Californians. While public supports cut the poverty rate for Black Californians by three-quarters to 9.5% in 2021, they only reduced poverty for Black Californians by well under half the following year, contributing to a near doubling of the poverty rate to 18.6%. For Latinx Californians, public supports cut the poverty rate by about 60% in 2021 when major pandemic-era policies were in place, but by only about 30% in 2022 after those policies ended, contributing to a substantial rise in the poverty rate from 12.6% to 21.6%.
Policymakers Can Reverse the Rise in Poverty
The dramatic rise in poverty following the end of major pandemic-era investments shows that policymakers play a significant role in determining the economic well-being of Californians. This means they can reverse the spike in poverty by investing in policies that help families and individuals meet basic needs and thrive in their communities. At the federal level, these include:
Restoring the enhanced federal CTC and allowing all children, regardless of immigration status, to benefit;
Strengthening SNAP nutrition assistance (CalFresh in California), including by ending harsh and arbitrary time limits that prevent certain individuals from accessing the nutrition and health benefits of the program, and ensuring equitable college student access;
Continuing pandemic-era child care relief funds that supported providers with keeping their doors open and families with accessing affordable care.
California policymakers can also do more to cut poverty across the state, including by:
Expanding refundable tax credits, such as California’s Earned Income Tax Credit (CalEITC) and Young Child Tax Credit;
Ensuring that all Californians, regardless of immigration status, can benefit from supports that help families and individuals meet basic needs, such as nutrition assistance and unemployment benefits; and
Strengthening vital supports that improve families’ economic well-being, such as by increasing the minimum CalFresh nutrition benefit and reimaging CalWORKs as a family-first, anti-racist program.
California’s early learning and care system can be improved by expanding access to affordable and reliable programs that meet families’ needs.
Introduction
Children and their families deserve access to affordable and reliable early learning and care options that promote whole-child development and support overall family well-being. Families should also have the opportunity to choose early learning and care programs that best meet their needs and goals — families have the expertise on what their children need and know what’s best for them.
However, inequitable and fragmented funding structures, misaligned programs, workforce challenges, and other barriers in state-funded early learning and care programs prevent children and their families from accessing the benefits of early learning. These barriers limit early learning and care opportunities and leave families with few or no options in their communities. This can have immediate and long-term implications for children’s development and overall well-being.
California’s state leaders can strengthen and expand access to early learning and care opportunities by fully developing a mixed delivery system tailored to the needs and diversity of California families. A mixed delivery system allows families to choose programs for their children that best meet their needs and preferences such as location, hours, and curriculum. Moreover, with a mixed delivery system the state can leverage resources and infrastructure across programs and also strengthen conditions for early learning educators.
This report explores California’s early learning and care system and provides key considerations to designing a mixed delivery system that meets families’ needs. California’s early learning and care system can be revamped by:
Increasing investments that align with children and family needs.
Strengthening the entire early learning and care workforce.
Aligning programs at the state and local level, especially as Transitional Kindergarten (TK) is expanded and becomes universal over the next few years.
Early Learning and Care Options for California Families
The state offers — through a system of early learning providers — several early learning and care programs at reduced or no cost to families based on specific eligibility requirements. These programs aim at supporting families with the lowest incomes. The following table shows the key programs included in California’s current early learning and care system.1Child care and early learning programs not in this table include: the Migrant Alternative Payment Program, Migrant Child Care and Development Program, Emergency Child Care Bridge Program for Foster Children, and Children with Severe Disabilities. Key points from this table include:
Early learning options vary in terms of setting, schedule, ages, payment, and eligibility.
Programs included as part of California’s subsidized child care system are housed within the California Department of Social Services (CDSS).
CDE considers preschool-age programs (as well as Head Start) to be under the umbrella of “Universal Prekindergarten (UPK),” which includes TK.2A complete description of CDE’s definition of Universal Prekindergarten can be found here: https://www.cde.ca.gov/eo/in/ts-universalprek.asp.
Programs specifically focused on preschool-age children (3 and 4 years of age) are housed within the California Department of Education (CDE). This is aside from Head Start which is federally funded.
The following CDSS programs are voucher-based programs (serving children ages 0-12) and are referred to throughout this brief as “voucher programs:” CalWORKs Stage One, CalWORKs Stage Two, CalWORKs Stage Three, and the Alternative Payment Program.
No or Reduced Cost Child Care and Early Learning Options
As shown in the table, the state’s early learning and care system is complex. Families seeking early learning and care programs confront a complicated set of options and requirements that can be challenging to navigate.
Early learning and care providers have to follow rules and regulations from different programs and contracts and compete for enrollment and funding.3Prior to 2020, early learning programs were administered by CDE. The 2020-21 budget act transitioned most programs, except for CSPP, to CDSS. The expansion of TK that began in 2021-22 and that will be available to all four-year-olds by 2025, free of charge, adds additional complexity to the system. Alignment with other programs is crucial to ensure the system as whole works toward a mixed delivery system that centers the needs of children and families.
Programs can be revamped into a mixed delivery system tailored to the needs of California’s families and children that takes into account the diversity in background, household structure, as well as the inequities many of these children and families face. Some key facts that highlight the diversity of children and families include:
Nearly a quarter of children live in a single-parent household.
Approximately 20% of children ages 0-5 live in a multigenerational household.
More than 50% of children ages 0-5 live in a home that speaks a language other than English.
A higher proportion of Black and Latinx children ages 0-5 live in lower income households, as detailed in the chart below.
A mixed delivery system is also attentive to children’s needs across all ages. The chart below shows the population of children ages 0-3 and ages 4-5 across time. As shown, there are millions of infants, toddlers, and preschool-age children. Notably, while the population of 0-3 year olds has declined over the past decade, there are still over one million non-preschool-aged children in California with early learning and care needs.
Given the variety of early learning options offered by thousands of early learning providers across various settings (including centers, family child care homes, and schools), California has an opportunity to create a mixed delivery system that attends to the diversity of children and families. By developing this system, the state can also leverage resources and infrastructure to strengthen opportunities for the workforce to expand and grow their career and businesses.
Program Examples
The following examples highlight ways in which communities are utilizing current early learning programs to resemble a mixed delivery system that meets families’ needs. These examples illustrate how providers design programs, how programs benefit families, as well as some implementation challenges.
Special thank you to Early Childhood Discovery Centers and Tulare County Office of Education for providing the information included in these examplesand the photos used in this report.
Community Based Preschool and Care
Early Childhood Discovery Centers, Inc. (ECDC), an organization that runs early learning programs in Selma, California, serves multiple age groups in school-based and non-school-based settings using a variety of funding sources. ECDC programs receive most of their funding from the state through contracts with CDE and CDSS. They also receive funding from a federal program specifically to provide meals. ECDC offers part-day and full-day preschool programs for children ages 3 to 5, and they offer a full-day toddler program. ECDC serves around 250 families from diverse backgrounds, needs, and preferences. Families want safe and enriching spaces where their children can learn. ECDC strives to offer programs designed along those overarching goals.
ECDC programs support children and families in several ways, including:
Families have the opportunity to choose between full-day or part-day services, depending on their specific situation.
Many of the teachers are bilingual. Families served by ECDC speak languages other than English, including Spanish and Punjabi.
Families have flexibility to drop off their children at various times of the day. For example, parents who work early can drop off their children as early as 6 a.m.
For families with children of various ages, they could enroll their children at the same location and only have one drop-off.
Families who choose TK but need additional hours of learning beyond what is offered through TK, can also choose ECDC programs once the TK day is over.
ECDC also has two preschool programs located at local elementary schools that can enable TK children with additional hours of care and learning after the TK program ends for the day.
Where there are limitations
Fragmentation in rules and regulations between the two agencies that administer early learning and care programs at the state level — this means, for example, having two different interpretations (and therefore rules and regulations) of the same legislation affecting early learning and care programs.
Collaboration between public schools and providers such as ECDC, who are serving the same families, is still developing. While school districts may be encouraged to coordinate with local providers, structures are not currently in place to ensure this collaboration.
Issues such as transportation from elementary schools to other early learning and care programs for families who need longer hours of learning still need to be addressed in collaboration between school districts and other early learning providers.
School Based Preschool
Lindsay Unified, in Tulare county, offers a combination of programs for preschool-age children for families who prefer services through a school district. In addition to the TK program, the district also holds a CSPP contract, which allows them to stack UTK classrooms with CSPP classrooms to create a more seamless preschool experience for families. For example, TK can be offered in the morning for 3 hours and CSPP in the afternoon for another 3 hours. This approach to deliver programs prioritizes families and helps break down the silos that exist between these early programs due to funding, rules, and various other aspects.
Leveraging resources from more than one funding source. School districts with CSPP contracts receive funding through that program and also from the Local Control Funding Formula (LCFF) for TK enrollment.4The Local Control Funding Formula (LCFF) is the state’s TK-12 education funding formula. The LCFF provides school districts, charter schools, and county offices of education a base grant per student, adjusted to reflect the number of students at various grade levels, as well as additional grants for the costs of educating English learners, students from low-income families, and foster youth.
Lowering teacher to student ratios by having a third adult in the classroom as CSPP requires a 1:8 ratio. Utilizing the combination of funds allows districts to offer the potential of full-time positions for the additional adults in the ever competitive job market.
Offering children and families at least a 6-hour educational day. In addition to supporting child development, a longer day also supports the family’s work schedule.
Where there are limitations
Districts need to have CSPP funding to allow this stacking with TK approach to work.
Districts will need to dedicate funds for the TK students not eligible for CSPP given the specific income and other eligibility requirements.
State Spending and Enrollment for California’s Early Learning and Care Programs
As mentioned, there are a variety of early learning programs available to children and families in California. Each of these programs, except for Head Start which is federally funded, receives funding from the state to provide care at reduced or no cost to families. Generally, funding for General Child Care, voucher programs, and non-school-based CSPP come from the state’s General Fund. Funding for TK and school-based CSPP comes from the Proposition 98 General Fund — Prop. 98 guarantees a minimum level of funding specifically for TK-12 schools, the CSPP program, and the state’s community colleges.
State spending on early learning has varied over time, as shown in the chart above. Since 2014-15, funding for voucher programs, CSPP, General Child Care, and TK has increased greatly. The largest increases have been in the CSPP and TK programs, with those two programs receiving 3.5 times and 3 times more funding in 2022-23 than they did in 2014-15, respectively.
From 2014-15 until 2021-22, enrollment for early learning programs has remained relatively steady, or even decreased, as shown in the enrollment chart above.5Enrollment data for 2022-23 was not not available for most programs at the time of publishing. Enrollment in voucher programs has grown slightly since 2014-15, but the other programs are at enrollment levels almost identical to 2014-15 or even slightly less. Spending on General Child Care, for example, is 2.5 times higher than what it was in 2014-15, but enrollment is below 2014-15 levels. While there are many reasons for changes (or lack thereof) in enrollment across programs — ranging from COVID-19 challenges, administrative challenges, public awareness, etc. — trends do provide insight into family preferences and needs.
A mixed delivery system requires spending and investments in programs that align with the needs of California’s diverse families. However, currently funding is not matching enrollment levels, such as in UTK where spending has tripled since 2014-15, while enrollment has decreased over a similar time period. As further detailed in the implications that follow, significant and ongoing state investments are necessary to address key aspects of a mixed delivery system, including a well-compensated and trained workforce, outreach and family inclusion, and well-coordinated structures for collaboration.
Implications for Children, Families, and the Early Learning and Care Workforce
With the ongoing expansion of TK and the integral role of child care for supporting families recovering from economic hardships experienced during the COVID-19 pandemic, the state faces an urgent need to work toward a mixed delivery system that supports the needs of all of California’s children and families. As the state and local governments move forward with planning for a mixed delivery system — through mechanisms such as the UPK Mixed-Delivery Quality and Access Workgroup and the UPK Mixed-Delivery Planning Grants — the following implications will be important for consideration.
Implications for equitable and accessible care
Overall, the unmet need for early learning and care in California is high. Earlier analyses show that eight out of nine children eligible for subsidized early learning and care in California do not receive services. Within this context, the funding and enrollment trends highlighted previously point to key implications for families’ ability to access child care.
Funding for early learning and care and programs does not align with family preferences and needs.
Although funding trends show the highest increase in funds for TK and CSPP, enrollment trends do not match. Specifically, enrollment trends show that voucher programs have the highest positive change in enrollment in recent years. This misalignment suggests that programs are not being funded in a way that matches the preferences and needs of families. Moreover, funding trends show that investments in early learning have increased the most for four-year-olds, even though infants and toddlers have historically faced higher costs of care.
TK expansion has left families confused on how to enroll and if they are eligible.
While funding for TK has increased, enrollment has not kept pace. This may be explained by the challenges families face when navigating the early learning and care system, as explained further in the subsequent bullets. Although TK is free, TK enrollment requirements (i.e., which four-year-olds are eligible and when) have been confusing for families.6Ana Powell and Tobi Adejumo, Why is Transitional Kindergarten Enrollment Lagging? A Look at Parent Survey Data(Center for the Study of Child Care Employment, June 2023).
Additionally, while TK will become universal for all four-year-olds by 2025, some families will still choose other programs, or a combination of programs, due to families having a diverse set of child care needs.7Powell and Adejumo, A Look at Parent Survey Data. With this in mind, California must equitably invest in all of their early learning and care programs to meet the needs of all California families and children.
Current efforts to expand TK do not align with the diversity of California’s children and families.
TK teachers are predominantly white (71%) and only approximately one-fifth of teachers are multilingual.8Elena Montoya et al., Teaching Transitional Kindergarten: A Snapshot of the Teacher Experience Before UTK Expansion(Center for the Study of Child Care Employment, December 2022), 2. However, as shown previously, California’s children and families are diverse; thus, their racial/ethnic and linguistic backgrounds do not match the TK teacher demographics — a trend that mirrors the K-12 system. The state’s investments in early learning and care should promote options that meet the cultural and linguistic needs of all California families. As TK continues to expand, ensuring alignment in cultural and linguistic diversity will promote a successful mixed delivery system.
Systems Coordination
California’s early learning and care programs are fragmented. Each program has specific rules and requirements that can create barriers for providers enrolling children and families trying to access services. Moreover, programs are administered by two different state agencies, which makes it difficult to coordinate implementation through a 0-5 lens.
Early learning and care programs are misaligned.
Many programs have the same income eligibility, schedule, payment structure for families, and serve similar age groups. However, they also differ slightly in terms of setting, funding mechanism, and the overall intent of each program (see table above). This fragmentation has implications for both families and providers. Providers, for example, are required to hold various contracts with state agencies, which impacts the design and delivery of programs.
With the development of a more equitable and unified funding mechanism already underway, the state could consolidate and streamline — as proposed by the Master Plan for Early Learning and Care and the Blue Ribbon Commission on Early Childhood Education Report — several of these programs to remove barriers for providers as well as families navigating the system and still offer families choice in terms of setting and other preferences.
Furthermore, the expansion of TK does provide more options for families. However, it must be well aligned and coordinated with other early learning and care programs that also serve four-year-olds to meet the needs of children and families. This includes access to a full day of early learning and care services.
Data on early learning at the state level are not centralized.
Data needed to track program participation, funding, and other key measures are fragmented or unavailable. This has significant implications for the entire system. For example, enrollment data are split between two state departments and it’s difficult to find the unduplicated number of children participating in each of the programs. Moreover, the state doesn’t maintain a centralized list on the number of families waiting for a child care voucher.
As a result, the state does not know how many families are waiting to receive child care assistance. Additionally, the state not have the reliable data needed to assess where to invest additional resources to improve services.
A more centralized data system can support a mixed delivery system by helping to:
Administration and governance at the local level is uncoordinated.
There are various entities at the local level that provide early learning and care services, administer funding, provide professional development or technical assistance, and other responsibilities. Each of these entities, such as school districts or Family Child Care Home Education Networks, serve similar communities but are not set up to work in partnership.
The state has implemented several efforts to coordinate early learning programs at a more local level. One example is the Local Planning Councils, which are tasked with supporting access to programs at the county level. Another example is the UPK efforts led by CDE to support localities in implementing a mixed delivery system for preschool-age children. These efforts are an initial step in developing collaborative relationships, however, it is not clear what entity is accountable and has the authority to ensure programs are well coordinated to make services available to families.
As a result, a robust mixed delivery system may be challenged by local coordination issues as families may not have clarity on all the programs they can access and how to access them.
Workforce Implications
California’s child care system includes 116,800 members of the early learning and care workforce. Funding and enrollment trends hold direct implications for the workforce. This, in turn, impacts the ability for California to develop a true mixed delivery system.
The increased investment in TK may result in K-12 teachers transitioning to TK, as opposed to staffing TK classrooms with educators who have a background in early learning.
With the increase in funding for TK and the anticipated increase in enrollment, school districts will need more teachers to lead and support TK classrooms. As a result, many schools may move teachers with the needed credentials into teaching TK, even if they lack experience with appropriate age groups. A TK instructor currently needs a Multiple Subject Teaching Credential and 24 credits in early childhood education. However, this requirement is not mandated until 2025. Thus, as TK continues to expand, classrooms are likely to be filled with K-12 teachers and not early educators with specific child development experience.
Focusing state resources on preschool-age children leaves out key parts of the workforce and exacerbates pay inequities.
Pathways to teaching TK require early educators to obtain higher education units and credentials. Specifically, the PK-3 credential mandates a bachelor’s degree and the completion of a PK-3 ECE Specialist Instruction Credential preparation program.9More information about the PK-3 credential and its requirements can be found here: https://www.ctc.ca.gov/docs/default-source/commission/agendas/2022-04/2022-04-3h.pdf?sfvrsn=5afb27b1_3Current providers — such as family child care providers and center-based providers — often do not have the time or resources to enter into the higher education system. Their years of experience cannot support a transition to a TK lead teacher without obtaining a degree, thus presenting barriers for many providers with accessing these opportunities.
Family child care providers and center-based providers (who also teach four-year-olds) earn lower wages than a TK lead teacher and have faced enduring challenges with receiving a fair and just wage.10Detailed analyses on the pay gap between TK teachers and child care providers was produced by the Center for the Study of Child Care Employment: https://cscce.berkeley.edu/publications/data-snapshot/double-or-nothing-potential-tk-wages-for-californias-early-educators/. Moreover, recent efforts to reform the amount child care providers are paid have been met with one-time funding increases, as opposed to an ongoing funding commitment similar to TK. Thus, creating narrow pathways to becoming a TK provider may contribute to inequities in the early learning workforce with regards to compensation.
State leaders continue to fail in making significant investments in linguistically and racially diverse educators working in 0-5 settings.
While early data shows that TK lead teachers are majority white and monolingual English speakers, family child care providers are predominantly people of color (71%) and over half (52%) speak non-English languages.11Early data on the TK workforce was collected and analyzed by the Center for the Study of Child Care Employment: https://cscce.berkeley.edu/publications/report/teaching-transitional-kindergarten/. However, as mentioned previously, family child care providers face barriers to becoming TK lead teachers. By narrowing investments in TK, the state is inherently disinvesting in promoting and developing more diverse parts of the early learning workforce that better match the demographics of California’s children.
Conclusion
California can strengthen and expand access to early learning opportunities by investing in and fully developing a mixed delivery system that prioritizes the unique needs and preferences of children and their families. These needs and preferences include non-traditional hours, multilingual environments, preferred learning settings, among others. Current funding, especially for programs outside of schools, is not sufficient to fully realize a mixed delivery system. Inadequate funding to support California’s youngest learners has significant drawbacks that impact families’ access — particularly for those with lower incomes and from diverse cultural and linguistic backgrounds — to programs in their communities as well as early learning providers and educators trying to make a living wage in this field. As the state continues to focus on efforts to create a stronger mixed delivery system, state leaders should consider:
Spending proportionately to increase investments in children 0-3.
With the expansion of TK, there have been significant and needed investments aimed at four-year-old children. In future budgets, the state should plan to increase funding for programs serving infants and toddlers that is predictable and ongoing and matches the need for accessible infant and toddler care.
Targeting resources that prioritize family choice.
These efforts should target outreach and information sharing with families so they are aware of early learning options in their communities, streamline eligibility, as well as understand and remove obstacles that prevent families from enrolling in programs.
Creating structures for collaboration and accountability.
Additional resources and policy changes are needed to develop structures for authentic collaboration between early learning and care programs, especially between schools and community-based organizations. Clear and accessible platforms for collaboration as well as accountability mechanisms — especially at the local level — should be defined so that the needs of children and families are met.
Strengthening the early learning workforce.
Ensuring livable wages for all early educators is crucial to maintain a strong early learning and care system. As the state works toward a mixed delivery system, one way to support the workforce is to ensure pay parity across all providers. This will require addressing inequities in requirements that block many educators from a TK teacher salary.
This report highlighted that the early learning system is complex and in many ways does not meet families’ needs and preferences — as shown through misalignment in spending and enrollment. The expansion of TK adds another layer of complexity to the system that can serve as an opportunity to align and redesign programs that serve children 0-5 and move toward a universal mixed delivery system equipped to serve millions of children and families who have little or no opportunity to enroll in a program.
Support for this report was provided by the Ballmer Group.
Child care and early learning programs not in this table include: the Migrant Alternative Payment Program, Migrant Child Care and Development Program, Emergency Child Care Bridge Program for Foster Children, and Children with Severe Disabilities.
Prior to 2020, early learning programs were administered by CDE. The 2020-21 budget act transitioned most programs, except for CSPP, to CDSS.
4
The Local Control Funding Formula (LCFF) is the state’s TK-12 education funding formula. The LCFF provides school districts, charter schools, and county offices of education a base grant per student, adjusted to reflect the number of students at various grade levels, as well as additional grants for the costs of educating English learners, students from low-income families, and foster youth.
5
Enrollment data for 2022-23 was not not available for most programs at the time of publishing.
More information about the PK-3 credential and its requirements can be found here: https://www.ctc.ca.gov/docs/default-source/commission/agendas/2022-04/2022-04-3h.pdf?sfvrsn=5afb27b1_3
10
Detailed analyses on the pay gap between TK teachers and child care providers was produced by the Center for the Study of Child Care Employment: https://cscce.berkeley.edu/publications/data-snapshot/double-or-nothing-potential-tk-wages-for-californias-early-educators/
11
Early data on the TK workforce was collected and analyzed by the Center for the Study of Child Care Employment: https://cscce.berkeley.edu/publications/report/teaching-transitional-kindergarten/
You may also be interested in the following resources:
Policymakers avoided major cuts to critical services in the 2023-24 California state budget, but additional revenues are needed to make meaningful investments for Californians in the future.
The ink is now dry on the 2023-24 California state budget agreement. The Legislature has passed and the governor has signed the budget bills and a package of budget-related trailer bills. Policymakers avoided major cuts to critical services, but additional revenues are needed to make meaningful investments for Californians in the future.
The enacted budget includes $225.9 billion in General Fund spending, down from $234.6 billion in 2022-23. Surpluses turned to deficits as revenue estimates fell, creating a $30 billion budget problem. The enacted budget includes a variety of solutions to close this shortfall without any major cuts to core services. These solutions include delaying or reducing some previously committed spending, shifting some spending between state funds, and internal borrowing.
The budget also extends the Managed Care Organization (MCO) tax, which will draw down additional federal dollars and offset state Medi-Cal spending (see Health section). Some spending items that were reduced in the budget may be restored if sufficient resources are available in 2024. The governor’s administration can delay one-time spending items until March 1, 2024, if a major revenue shortfall arises when the Legislature is not in session. However, the Legislature must approve further delays or reductions. State leaders must address significant budget shortfalls in the coming years, despite the balanced nature of the 2023-24 budget.
This report highlights key components of the budget agreement that help to improve the social and economic well-being of:
Californians with low incomes,
Californians of color,
women,
immigrants,
and others historically excluded from economic opportunities.
Areas where the budget agreement misses opportunities to support Californians are also highlighted.
Budget Overview
Revenues
What does the state budget include?
The enacted budget assumes General Fund revenues, including transfers, of $208.7 billion for 2023-24, in line with the governor’s May Revision estimates. Revenues for the 2022-23 fiscal year were also revised down significantly from the 2022 budget estimates. This reflects economic challenges including:
High inflation
Interest rate increase
Collapse of the Initial Public Offering (IPO) market
The final budget did not adopt the more conservative revenue estimates of the Legislative Analyst’s Office (LAO). According to the LAO, the state’s primary General Fund revenue sources would be about $11 billion lower across 2021-22 to 2023-24 than the administration’s estimates. So if revenues fall short, budget amendments may be needed.
How can state leaders better support Californians?
Making tax policy changes to significantly increase revenues. This would be needed to make substantial new investments to improve the lives of Californians. Such changes could also make the tax system more fair. The Senate’s April proposal to restructure corporate taxes and raise revenues was not included in the final budget. This would have addressed some of the state’s most pressing challenges.
Reserves
What does the state budget include?
The budget does not withdraw any funds from the state’s budget reserves. This leaves them fully available to help prevent budget cuts in the future during an economic downturn or budget emergency. This is in contrast to the governor’s May proposal to withdraw $450 million of the current $900 million balance of the Safety Net Reserve, which is intended to be used to maintain CalWORKs and Medi-Cal benefits during economic downturns.
Under the enacted budget, the 2023-24 combined balance of the state’s four budget reserves — the Budget Stabilization Account, the Public School System Stabilization Account, the Special Fund for Economic Uncertainties, and the Safety Net Reserve — is estimated to total nearly $38 billion.
Health
Managed Care Organization (MCO) Tax
What does the state budget include?
The budget includes the renewal of the MCO tax, effective April 1, 2023 through December 31, 2026. The MCO tax essentially reduces — or “offsets” — state General Fund spending on Medi-Cal by well over $1 billion per year. The MCO tax renewal, which requires federal approval, would result in $19.4 billion over the proposed tax period. Of this amount, $8.3 billion would support the Medi-Cal program, and $11.1 billion would support provider rate increases to drive greater Medi-Cal provider participation. For 2023-24, the budget includes $237.4 million to increase Medi-Cal provider rates effective January 1, 2024 for primary care, maternity care (including doulas), and non-specialty mental health services.
How can state leaders better support Californians?
Increasing education and training to prepare health workers to meet California’s health needs. In 2019, the California Future Health Workforce Commission developed a strategic plan for addressing health workforce gaps. According to a recent progress report, policymakers have made progress on many of the priority recommendations. However, state leaders can do more to recruit and train students from rural areas and other historically underserved communities to practice in community health centers.
Access to Medi-Cal
What does the state budget include?
The budget maintains the commitment to expand full-scope Medi-Cal eligibility to undocumented immigrants ages 26 to 49 starting January 1, 2024. This builds on previous steps state leaders have taken to end the racist and exclusionary policy that blocks Californians from accessing vital health services. To provide Medi-Cal for adults age 26 and over, the state is estimated to allocate $1.4 billion ($1.2 billion General Fund) in 2023-24 and $3.4 billion ($3.1 billion General Fund) at full implementation, inclusive of In-Home Supportive Services costs.
How can state leaders better support Californians?
Removing barriers to Covered California — the state’s health insurance marketplace — based on immigration status. Undocumented Californians who are not income-eligible for Medi-Cal are unjustly excluded from accessing and purchasing health care coverage plans through Covered California.
Covered California Affordability
What does the state budget include?
The budget provides $82.5 million in 2023-24 and $165 million annually thereafter to reduce the cost of health coverage through Covered California. The budget also includes a $600 million loan to the General Fund to help address the state budget shortfall, which will be repaid in 2025-26. This compromise between the Legislature and the governor’s administration will provide affordability assistance to Californians who lack access to affordable health care.
How can state leaders better support Californians?
Providing greater financial assistance for Californians who are uninsured and struggling to purchase coverage. Additionally, providing assistance for those who are insured but can’t afford to access the care they need. Policymakers should ensure that dollars raised from the state’s individual mandate penalty help people afford health insurance through Covered California, as was intended when the penalty was established.
The budget upheld previously promised funds for critical homelessness services and supports, including another $1 billion one-time investment in local flexible funding to address homelessness in 2023-24. These funds will be contingent on local jurisdictions developing regionally coordinated homelessness action plans. Also allocated is $400 million one-time General Fund for local encampment resolution grants, and $265 million one-time for the Mental Health Services Fund in 2023-24 and $235 million General Fund in 2024-25 for bridge housing for people experiencing homelessness with serious mental illness. Funding adjustments were also made to support the CARE Act implementation starting in select counties this fall.
How can state leaders better support Californians?
Centering ongoing, at-scale funding to adequately resource local response systems and enable long-term planning for future years. Expanding affordable permanent housing, especially for Californians with the lowest incomes, is also needed to end to homelessness.
Affordable Housing
What does the state budget include?
The 2023-24 enacted budget largely maintains prior allocated funding for affordable housing development. It provides an additional $500 million for the state’s Low Income Housing Tax Credit program and supplemented $100 million for the Multifamily Housing program for a total of $325 million in 2023-24. Other allocations in 2023-24 include:
$250 million for adaptive reuse of underutilized commercial spaces
$225 million for infrastructure for infill housing
$82.5 million (for a total of $330 million over four years) to help preserve affordable housing and promote residential property ownership
The budget sustained $500 million one-time General Fund for the Dream for All program. It also reduced the CalHome program to $300 million one-time General Fund in 2023-24. Both of these programs promote first-time homeownership for low or moderate income Californians.
How can state leaders better support Californians?
Scaling affordable housing development and preservation investments to match our housing needs. Many Californians — especially those with low incomes, renters and people of color — continue to struggle to afford their homes. Addressing our housing shortage must be prioritized.
Economic Security
Safety Net
What does the state budget include?
The budget protects a 10 percent increase to the California Work Opportunity and Responsibility to Kids (CalWORKs) program grant. This grant increase was set to expire in 2024. Regarding food assistance, the budget allocates $47 million to phase in a Summer Electronic Benefit Transfer (EBT) program for children who qualify for free or reduced-price school meals, and $15 million for a pilot program that will increase the CalFresh minimum from $23 to $50 for selected participants.
The budget also moves up the expansion of the California Food Assistance Program (CFAP) to October 2025. This expansion will extend benefits to undocumented adults over 55. The budget also includes the governor’s proposal of an 8.6% increase to the Supplemental Security Income/State Supplementary Payment (SSI/SSP) grants.
How can state leaders better support Californians?
Reforming CalWORKs. The exclusion of the Reimagine CalWORKs effort from this year’s final budget was a significant missed opportunity. The effort could have impacted thousands of children by transforming the CalWORKs participation requirements to make the program more family-centered, anti-racist, and participant-inclusive.
Tax Credits
What does the state budget include?
The budget clarifies that recipients of the Foster Youth Tax Credit (FYTC) – in addition to recipients of the CalEITC and Young Child Tax Credit (YCTC) – cannot have their tax refunds intercepted for debt payments (with the exception of child or family support payments). This will provide critical relief for low-income foster youth once this provision goes into effect.
How can state leaders better support Californians?
Strengthening and expanding California’s refundable tax credits. Important next steps include:
Increasing the minimum CalEITC to provide a more meaningful credit to workers with low incomes.
Extending the YCTC to all CalEITC-eligible families with children, not just those with kids ages 0 to 5.
Increasing the renter’s tax credit and making it refundable. This would help Californians with the lowest incomes who are currently excluded from the credit, even though they have the greatest difficulty affording rent.
Senate Bill 220 (Committee on Budget and Fiscal Review) would implement these CalEITC and renter’s tax improvements as part of a broader package of policy changes.
Child Care
What does the state budget include?
The budget includes $56 million from the General Fund for permanent family fee reform beginning October 1, 2023. Under the new family fee structure, families below 75% of the state median income (SMI) will no longer pay a fee for subsidized child care. Additionally, families at or above 75% of the SMI will have fees capped at 1% of monthly income.
The budget also provides a total of nearly $1.4 billion in one-time funds for rate increases for providers reimbursed through the California Department of Social Services (CDSS). The agreement with Child Care Providers United, signed by the governor on September 14, 2023, specifies the amount of additional funds providers will receive per child, per month. The budget also authorizes CDSS to develop an alternative methodology for child care program reimbursement rates.
How can state leaders better support Californians?
Continuing to expand child care slots. While the slots created during the past two cycles (over 100,000) will be maintained, the budget delays 20,000 additional slots until 2024-25. Notably, the legislative budget agreement included these additional slots for 2023-24. However, this did not make it into the enacted budget.
Immigrant Californians
What does the state budget include?
The enacted budget maintains and further invests in funding for a variety of programs and services to support immigrant Californians. New investments include:
$150 million in funding for shelters and services for people at the border.
$5 million for organizations to provide education and employment services to all workers, regardless of immigration status.
$5 million in one-time funding to support unaccompanied undocumented minors.
Additional support for immigrant Californians include further investments in food assistance, health insurance, and worker services. More details are available in the Safety Net, Health, and Labor sections, respectively.
How can state leaders better support Californians?
Better supporting undocumented Californians. This year’s budget missed an opportunity to expand eligibility of the Cash Assistance Program for Immigrants (CAPI) to include immigrants who are undocumented. Another missed opportunity was failing to extend unemployment benefits to excluded immigrant workers (see Labor section).
state budget terms defined
What’s the difference between a trailer bill and a policy bill? And what exactly is a “Budget Bill Jr.”? Our Glossary of State Budget Terms answers these questions and more.
Education
Early Learning and Pre-K
What does the state budget include?
The family fee and rate reform changes described in the child care section also apply to the California State Preschool Program (CSPP). Specifically, $22.4 million is allocated for family fee reform and $1.47 billion is provided for CSPP provider rate increases. The budget also provides $597 million for Transitional Kindergarten (TK) enrollment growth — 42,000 new enrollments — in 2023-24.
How can state leaders better support Californians?
Following up on the delays noted in the 2023-24 budget, including:
Delaying the requirement to lower TK classroom ratios to 1:10 until 2025-26.
Extending the deadline for TK teachers to earn 24 units (or equivalent), a child development permit, or an early child childhood education specialist credential from August 2023 to August 2025.
Delaying $550 million to 2024-25 in facilities funding for TK, CSPP, and Kindergarten.
Delaying the requirement that at least 7.5% of enrollment in CSPP enrollment is reserved for children with exceptional needs to July 1, 2025.
K-12 Education
What does the state budget include?
The budget provides some notable investments in K-12 education, including:
An 8.22 percent cost-of-living adjustment (COLA) for the Local Control Funding Formula (LCFF). This is the largest COLA since the establishment of the LCFF a decade ago.
$300 million ongoing for an “Equity Multiplier” add-on to the LCFF. This will be allocated to school sites on a per pupil basis based on a metrical called the “nonstability” rate.1The definition of “nonstability rate” includes the percentage of pupils who are enrolled for less than 245 continuous days between July 1 and June 30 of the prior school year.
$20 million one-time for a Bilingual Teacher Professional Development program. This will provide professional learning opportunities to increase the number of teachers authorized to teach in bilingual settings.
Lastly, the budget reduces two one-time block grants provided in last year’s budget agreement:
A $1.7 billion cut to the Learning Recovery Emergency Block Grant,from $7.94 to $6.25 billion.
A $200 million cut to the Arts, Music, and Instructional Materials Discretionary Block Grant, from $3.56 billion to $3.36 billion.
How can state leaders better support Californians?
Targeting efforts to address major issues that impact student learning, including:
High rates of absenteeism, especially among students of color and students from low-income households.
Addressing staffing shortages in areas with high need.
Higher Education
What does the state budget include?
The budget maintains funding for the Higher Education Student Housing Grant program for the construction of affordable student housing at all three segments of higher education. However, funding for these projects will shift from the General Fund to bonds.
The 2023-24 budget also includes base funding increases for public colleges and universities. Specifically:
$790 million for the California Community Colleges (CCCs), reflecting an 8.22 percent cost-of-living adjustment for the Student Centered Funding Formula.
An increase of $227 million California State University (CSU) system.
An increase of $215 million for the University of California (UC) system.
Notably, the budget also includes:
An increase of $227 million one-time for the Middle Class Scholarship (MCS). This provides aid to eligible students who attend a UC or CSU university or those pursuing a bachelor’s degree at the CCCs.
Funding through the MCS and the Student Success Completion Grant program to cover the cost of college for current and former foster youth students.
How can state leaders better support Californians?
Ensuring next year’s budget enacts the Cal Grant reform. Additionally, making the state’s financial aid system more equitable for students from families with low incomes.
Other
Labor and Workforce
What does the state budget include?
The budget invests $35 million in the Domestic Worker and Employer Education and Outreach Program and makes this program permanent. This will help community based organizations ensure that domestic workers’ rights and protections are upheld throughout the state.
How can state leaders better support Californians?
Providing unemployment benefits to Californians who lose their jobs and are undocumented. Especially those who continue to be excluded from unemployment insurance benefits.
All California workers should have a financial cushion to help them stay housed and put food on the table when they lose a job. Establishing an Excluded Workers Program to provide this vital safety net was prioritized by the Senate, but was not included in the final budget deal with the governor. A joint house legislative agreement to establish a work group to explore options for establishing a permanent excluded workers fund was also left out of the final deal.
State Corrections
What does the state budget include?
The 2023-24 enacted budget continues plans to downsize the state’s prison system. The budget addresses prison closures by declaring an intent to shut down additional prisons. This is accompanied by a requirement for the California Department of Corrections & Rehabilitation (CDCR) to assess the state prison system’s capacity and needs and report back to the Legislature during 2023. This report should provide a foundation to understand where opportunities lie in closing more state prisons. Additionally, the enacted budget includes $361 million from the Public Buildings Construction Fund to build an educational and vocational center at San Quentin State Prison, which will be renamed the San Quentin Rehabilitation Center.
How can state leaders better support Californians?
Further downsizing the prison system. According to a report by the Legislative Analyst’s Office, the state can safely close up to five additional prisons, saving the state around $1 billion per year. These savings could be used to provide services and supports for individuals after they are released from prison in order to help them rebuild their lives in their communities.
Public Safety
What does the state budget include?
The enacted budget funds a variety of public safety measures designed to improve the safety of all Californians, including:
An additional $12 million to assist tribal police and prosecutors in cases of missing/murdered Indigenous persons.
$20 million in one-time funding to enhance security at nonprofits that are at risk of hate-motivated violence.
Restoring $40 million in one-time funding for the third year of a three-year Public Defense Pilot Program. This allocates funding to counties to provide public defenders for those who cannot afford legal services.
Restructuring a gun buyback program in order to more quickly address mass shootings.
Providing $113 million for the Safe Neighborhoods and Schools Fund (Proposition 47 of 2014) to help reduce recidivism, support truancy and dropout prevention programs, and fund services for crime victims. This funding reflects state-level savings due to declining incarceration following the implementation of Prop. 47.
Tax Policy Changes
What does the state budget include?
Although the budget agreement does not contain substantial tax revenue increases to support new spending, state leaders did take a positive step by limiting one strategy that wealthy people use to avoid state income taxes, which will increase state revenues by an estimated $17 million annually.
However, the enacted budget also commits the state to five additional years of the film tax credit starting in 2025-26 and will even allow businesses to get cash back if their credit amount exceeds the taxes they owe. The extension of this credit — which has not been shown to be very cost-effective — will cost the state around $1.6 billion over 12 years at a time when the state is facing budget shortfalls in future years.
How can state leaders better support Californians?
Meaningfully and equitably raising revenues to support the services that Californians need —including by reducing or eliminating tax breaks that mainly benefit highly profitable corporations and wealthy people.
The definition of “nonstability rate” includes the percentage of pupils who are enrolled for less than 245 continuous days between July 1 and June 30 of the prior school year.
You may also be interested in the following resources:
Governor Gavin Newsom released the May Revision to his proposed 2023-24 California state budget on May 12, projecting a $31.5 billion shortfall, up from a projected $22.5 billion shortfall in January. The administration proposes to resolve the shortfall through a series of spending reductions, trigger cuts, and delays or deferrals of spending authorized in earlier years as well as through internal borrowing and fund shifts. The $224 billion General Fund spending plan would protect many ongoing investments made in prior years, mostly maintains state reserves that are projected to total $37.2 billion, and rejects raising revenues to continue to invest in Californians.
Despite the growing shortfall, the governor’s revised budget manages to protect and maintain much of the progress made in prior years to help improve economic security and opportunities for Californians with low incomes, including investments in health care and behavioral health, safety net and cash assistance programs, homelessness and housing, and cradle-to-career education.
Each year the state budget provides state leaders with an opportunity to fund the vision of California they aspire to create. As Californians continue to experience the rising costs of basic needs like food, child care, and housing, our state’s leaders face increasing demands for essential services to meet the needs of our communities. This is especially important for Black, Latinx, and other Californians of color as well as for Californians with low incomes, who repeatedly bear the brunt of economic downturns, rising cost of living, and austerity policies.
Yet, the governor’s proposal misses an opportunity to consider additional revenues and ensure large and highly profitable corporations pay their fair share, as proposed in the state Senate’s budget plan. The Senate’s proposal proves that state policymakers can take steps to make critical investments to improve economic security, address homelessness and unaffordable housing costs, and support child care providers.
Budget shortfalls should not be addressed solely through spending solutions. State leaders should consider other tools, like raising revenues and redirecting spending that supports the wealthy and corporations, to further protect essential services and continue to make progress toward a more equitable California.
This First Look report outlines key pieces of the May Revision and explores how the governor prioritizes spending amid the first budget shortfall of his tenure.
WHat is the May Revision?
Released on or before May 14, the May Revision updates the governor’s economic and revenue outlook; adjusts the governor’s proposed expenditures to reflect revised estimates and assumptions; revises, supplements, or withdraws policy initiatives that were included in the governor’s proposed budget in January; and outlines adjustments to the minimum funding guarantee for K-14 education required by Proposition 98 (1988).
Governor’s Updated Economic Forecast Assumes Slow Growth but No Recession
The governor’s May Revision highlights several risks to the economic outlook — including the federal debt ceiling standoff, high interest rates, bank failures, and tech sector layoffs — but does not anticipate a recession. The forecast assumes nationwide economic growth to be slow but positive through most of 2023, then to recover to more normal rates (1.5% – 2%) beginning later in the year as inflation continues to moderate and monetary policy eases, continuing through the forecast period ending in 2026.
The administration notes several reasons for cautious optimism: inflation has been slowing, consumer spending is still strong, and the state is continuing to add jobs, albeit at a slower rate than during the recovery from the dramatic losses early in the pandemic. The revised budget also maintains that despite some high-profile tech layoffs, employment in the information sector is still above pre-pandemic level, many of the layoffs have occurred outside of California, and they likely represent a “correction to apparent over-hiring at some firms during the pandemic.” The forecast does not anticipate any major banking or tech sector crises that would disrupt the economy.
The forecast assumes that job growth will continue to slow throughout 2023 and 2024 and revert to its historical trend, and that the state’s unemployment rate will increase through 2025 to a peak of 5.2% due to the effects of higher interest rates and more cautious lending activity on business investment and the labor market.
Average wage growth in the state fell to almost zero in 2022 after strong growth in previous years, largely reflecting declines in the highest-paying sectors that have seen reductions in bonuses and stock options. The forecast anticipates that wage growth will recover to around 3% in 2023 and 2024 and 4% in 2025. Taking into account inflation, real average wage growth was negative in 2022 and the forecast doesn’t project positive real wage growth until 2025.
Revised Budget Downgrades Revenue Estimates, Includes No New Tax Proposals
The governor’s January budget proposal projected a $29.5 billion shortfall in state General Fund revenue relative to the estimates in the enacted 2022 budget. Since then, revenue collections have come in even lower than anticipated, reflecting weaker stock market performance and inflation-adjusted wage growth. Due to the weaker revenue collections and the risks to the economic outlook, the revised budget assumes General Fund revenues for the three-year budget window ending with the 2023-24 fiscal year will be $8.4 billion lower than expected in January.
Relative to the January projections, the revised budget anticipates revenues for the state’s “Big Three” revenue sources to be:
$14.3 billionlower for the personal income tax ($3.2 billion lower excluding the impact of the pass-through entity elective tax, which shifts some revenue from the personal income tax system into the corporate tax system),
$6.2 billionhigher for the corporation tax ($4.3 billion lower excluding the impact of the pass-through entity tax), and
$100 million higher for the sales and use tax.
These estimates are based on the assumption that the economy does not go into recession. The administration notes that in the case of a mild to moderate recession, General Fund revenues could fall below these estimates by $20 billion to $40 billion. Also notable, updated estimates of the state’s “Big Three” tax revenues across the budget window from the Legislative Analyst’s Office are $11 billion lower than the governor’s May Revision estimates, suggesting that the actual budget problem could be substantially larger than the governor is projecting.
The updated revenue estimate is subject to additional uncertainty this year as a result of the extension of tax payment deadlines for most Californians into October, giving estimators less complete information about the state’s revenue situation than they usually have at this point in the year. The May Revision assumes that these extensions will result in about $42 billion of personal and corporation income tax revenues being delayed until October. This uncertainty increases the likelihood that the 2023-24 budget will be subject to more substantial adjustments after being signed into law than in most years.
The governor does not propose any substantial revenue increases to protect or strengthen services and supports for Californians, nor does he propose any additional tax policy changes beyond his January proposals. These proposals included closing a tax loophole related to income from certain trusts, exempting forgiven student loan debt from state taxation, extending and making refundable the state’s film and television tax credit, and changing the rules for the state’s existing New Employment Credit.
In stark contrast to the governor’s proposal, the state’s Senate Budget Plan released on April 26 includes a proposal to move from a single tax rate on general corporations to a graduated tax rate where the first $1.5 million of a corporation’s state profits would be taxed at 6.63% while profits above that level would be taxed at 10.99%. This change is estimated to raise several billion dollars in state revenue and would support proposals to increase tax credits for Californians with low- and middle-incomes (see the refundable tax credits section), ongoing funding to address homelessness, child care provider rate increases, K-14 education funding, and shoring up the state’s Safety Net Reserve.
May Revision Mostly Maintains State’s Reserves, but Draws Down Safety Net Reserve
California has a number of state reserve accounts that set aside funds intended to be used for a “rainy day,” when economic conditions worsen and state revenues decline. Some reserves are established in the state’s Constitution to require deposits and restrict withdrawals, and some are at the discretion of state policymakers.
California voters approved Proposition 2 in November 2014, amending the California Constitution to revise the rules for the state’s Budget Stabilization Account (BSA), commonly referred to as the rainy day fund. Prop. 2 requires an annual set-aside equal to 1.5% of estimated General Fund revenues. An additional set-aside is required when capital gains revenues in a given year exceed 8% of General Fund tax revenues. For 15 years — from 2015-16 to 2029-30 — half of these funds must be deposited into the rainy day fund and the other half is to be used to reduce certain state liabilities (also known as “budgetary debt”). Prop. 2 also established a new state budget reserve for K-12 schools and community colleges called the Public School System Stabilization Account (PSSSA). The PSSSA requires that when certain conditions are met, the state must deposit a portion of General Fund revenues into this reserve as part of California’s Prop. 98 funding guarantee (see section on Prop. 98).
In addition, Prop. 2 increased the maximum size of the BSA to approximately 10% of estimated General Fund revenues. If this limit is reached, any dollars that otherwise would have gone into the BSA would have to be spent on infrastructure, including spending related to deferred maintenance. Similarly, Prop. 2 caps the size of the PSSSA at 10% of the estimated Prop. 98 minimum funding guarantee for schools and community colleges. If this limit is reached, state policymakers are required to use the dollars that would otherwise have been deposited into the PSSSA to instead support schools and community colleges.
The BSA is not California’s only reserve fund. The 2018-19 budget agreement created the Safety Net Reserve, which holds funds intended to be used to maintain benefits and services for CalWORKs and Medi-Cal participants in the event of an economic downturn. Additionally, each year, the state deposits additional funds into a “Special Fund for Economic Uncertainties” (SFEU) — a reserve fund where state leaders have a lot of flexibility and discretion as to when and how they can use the available funds.
The governor’s May Revision does not draw down the BSA to cover the projected state revenue shortfall and projects an increase in the PSSSA balance. For 2023-24, the proposal projects a BSA balance of $22.3 billion — the same as the 2022-23 level — and a PSSSA balance of $10.7 billion — up from $9.9 billion in 2022-23. The administration estimates the BSA in 2023-24 will continue to top out at 10% of estimated General Fund revenues, requiring that $2.3 billion that would exceed that level be spent on infrastructure projects. In addition, the PSSSA is expected to reach 10% of the Prop. 98 minimum funding guarantee.
The May Revision does propose to draw down $450 million from the Safety Net Reserve, leaving $450 million in that account. In contrast, the state’s Senate Budget Plan released in late April would increase the Safety Net Reserve to $1.9 billion.
The SFEU is projected to be $3.8 billion in 2023-24, down significantly from its current year (2022-23) projected total of $18.8 billion.
Taking into account the BSA, PSSSA, Safety Net Reserve, and SFEU, the governor’s proposal would include total reserves of $37.2 billion in 2023-24.
Health
Governor Maintains Commitment to Expand Medi-Cal to All Undocumented Californians
California has expanded access to health coverage in recent years, building on the federal Affordable Care Act (ACA). More than 15 million Californians with modest incomes — nearly half of whom are Latinx — are projected to receive free or low-cost health care through Medi-Cal (California’s Medicaid program) in 2022-23. Another 1.7 million Californians purchase health coverage through Covered California, our state’s health insurance marketplace. Nonetheless, many Californians — including immigrants who are undocumented — remain uninsured, while those with health coverage often face high monthly premiums and excessive out-of-pocket costs, such as copays and deductibles, when they seek health care services.
The governor’s revised budget protects major health care investments that were enacted in the 2022 Budget Act. Most notably, the budget maintains the commitment to expand full-scope Medi-Cal eligibility to undocumented immigrants ages 26 to 49 starting January 1, 2024.In recent years, California has expanded eligibility for comprehensive Medi-Cal coverage to certain immigrants who qualify for the program except for their immigration status, including children and young adults up to age 25 as well as adults age 50 and older. However, undocumented adults ages 26 to 49 continue to be excluded. The enacted 2022-23 budget began the process of closing this eligibility gap by extending full-scope coverage to these adults no sooner than January 1, 2024. The May Revision includes additional funding for the two most recent Medi-Cal expansions: $1.6 billion General Fund in 2023-24 and an estimated $2.4 billion General Fund annually. These figures include the cost of providing In-Home Supportive Services to newly eligible adults who are anticipated to enroll in the program.
In addition, the governor’s revised budgetmaintains the proposal to renew California’s Managed Care Organization (MCO) tax, effective April 1, 2023 through December 31, 2026. The May Revision advances the effective date nine months earlier than planned in the governor’s proposed budget. The MCO tax essentially reduces — or “offsets” — state General Fund spending on Medi-Cal by well over $1 billion per year. The renewal of the MCO tax, which requires federal approval, would result in $19.4 billion to maintain Medi-Cal funding. Of this amount, $10.3 billion, including $922.7 million in 2023-24, would be set aside for future use and $8.3 billion over the proposed MCO tax period would support the Medi-Cal program, offsetting General Fund spending. The remaining funding would be allocated as follows: $237 million ($98 million General Fund) in 2023-24 and $580 million ($240 million General Fund) annually thereafter to increase provider rates for primary care, obstetric care (including doulas), and non-specialty mental health services.
While the revised budget proposal would improve health care access and affordability for many Californians, it fails to use dollars raised from the state’s individual mandate penalty as intended when the penalty was established: to help people afford health insurance through Covered California. Penalizing Californians with low-to-moderate incomes for not obtaining health coverage and then failing to use the penalty revenue to address the high cost of coverage and care is an injustice. As outlined in the state Senate’s budget plan, the governor should provide greater financial assistance to Californians who are uninsured and struggling to purchase coverage given that premiums, deductibles, and other out-of-pocket costs are on the rise. Access to timely, quality, and comprehensive health care services is critical because it promotes overall physical and mental health. When people do not have access to health coverage, they are less likely to receive preventive care, less likely to receive treatment for chronic health conditions, and more likely to report a poor health status.
Revised Budget Sustains Major Behavioral Health Initiatives
Behavioral health services — mental health care and/or treatment for substance use — are primarily provided by California’s 58 counties, with funding from the state and federal governments. These services support millions of Californians who cope with mental illness or substance use disorders. Unfortunately, many Californians experience barriers to accessing the behavioral health care services they need in order to thrive, particularly individuals experiencing or at risk of homelessness. In addition, LGBTQ+ people and people of color disproportionately experience barriers to care due to the legacies of discrimination.
In recent years, the administration launched various behavioral health initiatives to transform California’s behavioral health system. This summer, the administration will seek approval of a new federal waiver called the Behavioral Health Community-Based Organized Networks of Equitable Care and Treatment (BH-CONNECT) Demonstration — previously known as California’s Behavioral Health Community-Based Continuum (CalBH-CBC) Demonstration. This initiative would complement the administration’s ongoing efforts to expand access to Medi-Cal behavioral health services with a focus on children and youth, individuals experiencing or at risk of homelessness, and justice-involved individuals. The waiver is estimated to cost $6.1 billion ($306.2 million General Fund) over five years and is expected to be implemented no sooner than January 2024. Major reforms to the Medi-Cal program as well as the level of federal funding that will be provided must be negotiated with the federal government through the Medicaid waiver process. As such, implementation of BH-CONNECT will depend on the availability of funding and federal approval.
The administration’s revised budget also includes the following:
$500 million from the Mental Health Services Fund to support the Behavioral Health Bridge Housing Program, which aims to address the immediate housing and treatment needs of people with serious behavioral health conditions who are also experiencing unsheltered homelessness.In January, the governor’s administration proposed to postpone $250 million for this program to 2024-25. The revised budget eliminates this delay by using Mental Health Service Fund dollars in lieu of General Fund support.(See the homelessness section for more information about supports for Californians who are experiencing or at risk of homelessness.)
$250.3 million Opioid Settlements Fund for opioid and fentanyl response. Of this amount, $220.3 million would be allocated over four years to support the Naloxone Distribution Project. Naloxone is a life-saving medicine that reverses an opioid overdose, which is urgently needed. Over 7,000 Californians died due to opioid overdose and nearly 6,000 Californians died due to a fentanyl overdose in 2021. The remaining $30 million would be available in 2023-24 to support the development of a generic naloxone nasal spray product.
$50.5 million Mental Health Services Fund to support the CalHOPE program, which provides crisis support for communities impacted by a national disaster.
$50 million General Fund over three years to support behavioral health for older adults. Specifically, the revised budget allocates $20 million General Fund in 2023-24, $20 million General Fund in 2024-25, and $10 million General Fund in 2025-26 to support a targeted media campaign for older adults as well as competitive grants to local governments to identify and address the unique behavioral health needs of older adults.
$40 million ($20 million General Fund) to support the governor’s proposal to modernize the state’s behavioral health system. This allocation reflects initial funding to support the governor’s proposed 2024 ballot initiative, which would authorize a general obligation bond to build mental health treatment residential settings for Californians with behavioral health conditions. It would also reform the Mental Health Services Act (Prop. 63 of 2004) by overhauling the funding structure, leading to at least $1 billion annually in local assistance for housing and residential services for people experiencing behavioral health conditions.
$15 million one-time 988 State Suicide and Behavioral Health Crisis Services Fund in 2023-24 to support the 988 Suicide & Crisis Lifeline, which helps connect Californians to trained crisis counselors who can help people experiencing a mental health crisis or emotional distress. This funding would support 988 call centers for a total of $19 million in 2023-24 and $12.5 million in 2024-25 and ongoing.
Investments in our behavioral health system are critical. The governor’s commitment to improving access to behavioral health services can support Californians who are coping with mental health conditions or substance use disorders. These investments can also reduce hospitalization or even incarceration due to behavioral health conditions.
May Revision Maintains Public Health Infrastructure Investment, Restores Funding to Rebuild Workforce
Everyone should have the opportunity to be healthy and thrive, regardless of their race, gender identity, sexual orientation, income, or zip code. The California Department of Public Health as well as local public health departments play a critical role in protecting and promoting Californians’ health and well-being. Their responsibilities include infectious disease control, chronic disease prevention, health promotion, and more.
The May Revision maintains $300 million ongoing General Fund to strengthen public health infrastructure at the state and local level. The governor’s revised budget also restores $49.8 million over four years for various public health workforce training and development programs. This is critical because public health funding has historically not kept pace with the cost of responding to ongoing and emerging health threats.
The governor’s revised budget scales back resources for COVID-19 response by $50 million General Fund due to the end of the state of emergencies at the federal and state level. It is important to note that reducing funding for COVID-19 response may have potential implications for managing the virus in the future. State leaders should continue to monitor COVID-19 and make funding adjustments as needed. This includes ongoing funding for state and local public health needs to ensure that California is better prepared to address current and future public health emergencies.
State leaders can do more to make sure all Califorrnians have the opportunity to be healthy and thrive. Given that structural racism continues to have a profound impact on the health and well-being of many communities across the state, the governor’s administration and other state leaders can employ a variety of strategies to combat the effects of historical and ongoing racist policies and practices. Such strategies include declaring racism a public health crisis at the state level and establishing dedicated funding to support community-based organizations, clinics, and tribal organizations in their efforts to advance health equity.
Homelessness & Housing
Proposal Keeps Previous Homelessness Commitments but Lacks Ongoing Funding
Having a safe and stable place to call home is core to living a dignified and healthy life. Yet, over 171,000 Californians were counted as experiencing homelessness at a point-in-time in early 2022. Over the same year, local homeless service providers made contact with more than 315,000 Californians needing to find a home or search for other life-sustaining services. While people of all ages and backgrounds are pushed into homelessness for varying reasons, deeply rooted inequities have placed Black, American Indian or Alaska Native, and Pacific Islander Californians, adults without children, older adults, and LGBTQ+ individuals at higher risk of facing homelessness and its destructive effects. Still, the May Revision does not build on the governor’s earlier commitments to address homelessness. The administration instead continues to focus on establishing stronger local accountability measures around homeless services and regional coordination.
Most notably, the administration sustains $1 billion one-time General Fund for the Homeless Housing, Assistance and Prevention (HHAP) Grant Program in 2023-24, which provides local jurisdictions with flexible funds to address homelessness. In conjunction, the administration will propose trailer bill language so these funds prioritize high need populations —specifically unsheltered individuals — through permanent housing supports and programs like Homekey and the Community Assistance, Recovery, and Empowerment (CARE) Act. This is in contrast to the state Senate budget plan that proposes $1 billion ongoing for HHAP which is needed as effectively addressing homelessness requires adequate capacity and services at a scale that meets the need as well as reliable ongoing funding so that efforts can be sustained.
Other maintained homelessness-related allocations in 2023-24 include:
$500 million one-time Mental Health Services Fund for the Behavioral Health Bridge Program, which supports people experiencing homelessness with serious behavioral health conditions through short-term bridge housing and services. This amount reflects a $250 million restoration that was not reflected in the January proposed budget but was included in the 2022 Budget Act. These funds were previously proposed through General Fund dollars (see Behavioral Health section).
$400 million General Fund for encampments resolution grants for local jurisdictions.
The May Revise also moves forward with the CARE Act that is set to start in select counties in October 2023 and expand statewide by 2024. The proposed budget augments funding for the Department of Health Care Services and the Judicial Branch for implementation. This includes $128.9 million General Fund in 2023-24, $234 million General Fund in 2024-25, $290.6 million General Fund in 2025-26, and $290.8 million General Fund in 2026-27 and annually ongoing after.
Lastly, the administration upholds proposals that leverage potential federal and state Medicaid funds for homelessness prevention and rehousing assistance for select populations if waivers are approved by the federal government. This includes various initiatives within California Advancing and Innovating Medi-Cal (CalAIM) , such as the Transitional Rent Waiver Amendment and the Behavioral Health Community-Based Organized Networks of Equitable Care and Treatment (BH-CONNECT) Demonstration (see Behavioral Health section).
Housing
May Revise Proposes No New Investments for Affordable Housing Production
Safe and stable housing is a basic need for all individuals, but many Californians are unable to maintain stable housing because of unaffordable housing costs. Renters, people with low incomes, Black and Latinx Californians, and Californians who are undocumented are especially likely to struggle to keep up with housing costs. Despite noting California’s serious housing affordability challenges, the governor proposes no additional or expanded investments to increase the supply of affordable housing.
The May Revision maintains the funding for affordable housing development that was included in the 2022-23 budget agreement for use in 2023-24. This includes $225 million for multifamily housing, $410 million over two years for adaptive reuse of underutilized commercial space, and $225 million infrastructure for infill housing. It also continues the $500 million boost to the state Low-Income Housing Tax Credit program, as in recent previous years, but no further increase is proposed. The governor also does not augment other state funding that directly supports the development of affordable housing.
The administration continues to propose a $350 million reduction in 2023-24 for homeownership programs and accessory dwelling units that were included in the 2022-23 state budget agreement. These reductions would be restored if sufficient General Fund is available in January 2024. One-time funds for the Foreclosure Intervention Housing Prevention Program are also newly impacted. The governor proposes deferring $345 million — of the $500 million included in the 2021 Budget Act — over four fiscal years for a revised allocation of $50 million in 2023-24, $100 million in 2024-25, $100 million in 2025-26, and $95 million in 2026-27. Additionally, the administration shifts and restructures funds included in the 2022-23 budget agreement that support affordable housing for public college students (see CSU/UC section).
In contrast, the Senate budget plan proposes allocating an additional $500 million towards the state Low-Income Housing Tax Credit Program as well as an additional $300 million flexible funding for affordable housing production programs. Additionally, the Senate budget plan proposes restoring or augmenting homeownership programs delayed by the governor. It also allocates $700 million to expand the Renters Tax Credit and makes it refundable, so that it would benefit renters with the lowest incomes (see Refundable Tax Credits section).
making sense of the governor’s may revision
Join us on May 18th as out Budget Center experts explore how the governor’s budget proposals adapt to the challenges facing the state and support the well-being of all Californians.
May Revision Makes No New Investments in Tax Credits for Low-Income Californians
California’s Earned Income Tax Credit (CalEITC), Young Child Tax Credit, and Foster Youth Tax Credit are refundable income tax credits that collectively help millions of families and individuals with low incomes pay for basic needs like food each year. These credits also promote racial and gender equity by targeting cash to Californians of color, immigrants, and women who face racism, sexism, and other structural barriers to advancement in the labor market.
The administration does not propose to make any new investments in these tax credits even though Californians’ need for cash support remains high. About 2 in 3 households with incomes under $35,000 reported difficulty affording basic needs like groceries last fall and the economic challenges facing millions of Californians have worsened since then with the expiration of federal supports, such as emergency SNAP/CalFresh food assistance. The end of this and other federal policies are key factors expected to push more Californians into poverty this year.
In contrast with the governor’s May Revision, the Senate’s budget proposal would invest $1.9 billion ($1.5 billion ongoing) in tax credits that would boost the incomes of millions of Californians with low and moderate incomes. This includes:
A $700 million expansion of the state’s renters credit that would help 3.25 million households better afford rent;
A $400 million increase in the amount of money provided through the CalEITC that would help more than 3 million low-paid workers pay for basic needs; and
A $400 million investment to begin providing California’s new Workers Tax Fairness Credit, which was signed into law last year and would extend a tax benefit to as many as 2.5 million union workers who are not eligible for an existing tax deduction that largely benefits high-income union workers.
No Significant Investments in CalWORKs Despite Safety Net Reserve Withdrawal
The California Work Opportunity and Responsibility to Kids program (CalWORKs) is a critical support that provides modest cash assistance for families with low incomes, particularly families of color.
The May Revision:
Includes a slight increase of 3.6% to CalWORKs grants (at an estimated $111.2 million cost in 2023-24), up from 2.9% in January, as is required by AB 85 of 2013, which links CalWORKs grant increases to projected sales tax revenues.
Proposes pulling back approximately $280 million in unspent funds from the 2021-22 CalWORKs Single Allocation, which funds employment services, eligibility determination, and administrative costs.
Delays the start of a previous proposal, which would redirect collected child support payments from the state back to former CalWORKs parents. Implementation is expected to begin April 2024. This delay results in approximately $70 million General Fund revenue — dollars that otherwise would have gone to families.
Withdraws $450 million from the Safety Net Reserve designed to maintain existing CalWORKs and Medi-Cal benefits and services during an economic downturn (see Reserves section for more).
The governor’s proposal falls short in meeting the minimal needs of CalWORKs families. In recent years, state policymakers have raised the maximum CalWORKs grant above the deep poverty threshold (50% of the federal poverty line) for some CalWORKs families, but not for many of those with an excluded family member, unfairly leaving these children and families behind with less assistance to meet basic needs. The governor’s revised budget again fails to raise CalWORKs grants above the deep poverty threshold for all families.
The initial proposal to redirect collected child support payments to formerly assisted families was a step forward from a policy that routed outstanding child support debt to the state, county, and federal governments as “reimbursement” for the costs associated with the CalWORKs program. The delay in redirecting collected child support to former CalWORKs families, however, perpetuates a racist policy that blocks Black, Latinx, and other families from economic security.
The governor’s proposal also misses an opportunity to provide funding to end the CalWORKs work participation rate penalty for counties, a racist and sexist policy that works against recent CalWORKs program reforms and hinders the CalWORKs program from helping parents address barriers.
Governor Proposes Investments in Anti-Hunger Programs, but More Is Needed
No Californian should have to worry about whether they’ll be able to put food on the table. But about 1 in 10 California households sometimes or often do not have enough to eat, according to a recent Census Bureau survey. The recent end of several federal programs that provided additional food assistance since the beginning of the COVID-19 pandemic has left many Californians on the brink of a hunger cliff.
The revised budget proposes several changes from the January proposal to improve food assistance programs, including:
Additional support for the Universal School Meals Program (see K-12 section).
$47 million ($23.5 million General Fund) to phase in a new federal Summer EBT program for children who qualify for free or reduced lunch. The program would begin in the summer of 2024.
An updated timeline for the expansion of the California Food Assistance Program (CFAP), which would extend benefits to undocumented adults over the age of 55, to begin in October 2025. This includes a $40 million investment for automation and outreach efforts.
While the May Revision makes some improvements to the January budget proposal, which proposed no new food assistance funding, it does not include any new commitments to further expand CFAP and fully end the exclusion of undocumented households from vital food supports. It also misses an opportunity to increase CalFresh monthly benefits. This is particularly important given the recent end of pandemic emergency allotment support, which had increased a household’s benefits to the maximum allotment for its family size. The recent end of this program means some households participating in CalFresh have seen their food assistance benefits plummet, from $281 to just $23 in some cases. The governor’s proposal does not include any additional food assistance to help support families during this transition.
Governor Maintains Increase to SSP, but Falls Short of Prior Commitments
Supplemental Security Income/State Supplementary Payment (SSI/SSP) grants help well over 1 million low-income seniors and people with disabilities to pay for housing and other necessities. Grants are provided to individuals and couples and are funded with both federal (SSI) and state (SSP) dollars. State policymakers made deep cuts to the SSP portion of these grants in 2009 and 2011 to help close budget shortfalls caused by the Great Recession. Except for a small increase provided in 2017, the recession-era cuts to SSP grants remained in effect for more than a decade.
State leaders changed course in 2021 and adopted a substantial (24%) increase to SSP grants that took effect on January 1, 2022. Also in 2021, state leaders committed to providing an additional increase to SSP grants in January 2024, subject to funding being provided in the 2023-24 state budget. Part of this increase has already taken effect, with state leaders raising the maximum monthly SSP grants for individuals from $160.72 in 2021 to $219.73 in 2023. For couples, the maximum monthly SSP grant rose from $407.14 in 2021 to $556.62 in 2023.
In line with the governor’s January proposal, the May Revision:
Increases the state’s portion of SSI/SSP grants in 2024, but not as much as previously committed. As noted above, an increase to the maximum monthly SSP grants took effect on January 1. The governor calls for an additional increase to take effect on January 1, 2024, raising the maximum SSP grants for individuals from $219.73 in 2023 to $238.62 in 2024. For couples, the maximum monthly SSP grant would increase from $556.62 in 2023 to $604.49 in 2024. These new maximum SSP grant levels would fall somewhat short of the 24% increase originally anticipated by state lawmakers. For example, assuming the January 2022 grant levels were raised by 24%, the maximum grant for individuals should rise to roughly $247 and the maximum grant for couples should go up to nearly $626 as of January 2024.
Does not commit to future increases that would allow grants to keep up with the cost of living and fully make up for prior grant reductions. Even with an increase in SSP grants in 2022, 2023, and 2024, the maximum SSP payment for individuals in 2024 — $238.62 — falls far short of the level it would have reached — more than $400 — if state leaders had consistently adjusted this grant for annual changes in the cost of living since 2008, according to Budget Center calculations. In other words, grants have not kept pace with the cost of living in California due to state policy choices, leaving many low-income seniors and people with disabilities less able to make ends meet.
Governor Extends the Family Fee Waiver but Does Not Boost Provider Rates
California’s subsidized child care and development system is a critical resource for families with low to moderate incomes seeking to access affordable, nurturing early care and education. Despite child care’s critical role for California families, too few families can access affordable child care options and many are unable to pay high family fees, prompting families to make sacrifices in other areas of need (i.e., housing and food). Furthermore, provider reimbursement rates have not kept pace with the rising minimum wage, resulting in many providers struggling to make ends meet. Child care providers are integral to supporting the development of California’s children and the economic well-being of families. Current provider rates do not reflect their vital profession.
The governor’s proposed budget:
Waives family fees for child care and development programs. The governor proposes to extend the 2022-23 policy to waive family fees using $29.4 million of one-time federal funds. The current fee waiver was set to expire on June 30, 2023, and the proposal extends the waiver until September 30, 2023. In fact, two bills recently passed by the Legislature — Assembly Bill 100 and Assembly Bill 110 — will waive family fees until September 30, 2023. The governor signed both bills into law on May 15, thereby implementing the policy change assumed in the May Revision.
Includes temporary stipends to state-subsidized child care providers. The governor will authorize the California Department of Social Services (CDSS) to use around $169 million in federal funds to provide stipends for state-subsidized providers. The 2023-24 stipends follow previous years of similar funding, allocated on a per child-basis. Specifically, state-subsidized child care provider stipends were also provided in 2022-23 ($1,442 per child) and 2021-22 ($600 per child). Assembly Bill 100 and Assembly Bill 110, referenced above, include the temporary stipends. With the governor’s May 15th signature, this funding will officially be implemented as planned.
Does not add any new child care slots for 2023-24. The governor indicated in January that the slots created during the past two cycles (over 100,000) will be maintained. The January budget proposed that 20,000 additional slots be added for 2024-25.
Does not increase child care provider rates for 2023-24. The Senate Budget Plan proposes over $1 billion to increase child care rates “to support and stabilize child care providers.” The Assembly’s Child Care Funding Budget Plan (“Care COLA”) proposes a $1 billion cost of living adjustment, increasing child care funding by 25.44%. This effort is intended to move providers away from poverty wages. Despite the Senate and Assembly’s plans, the governor’s proposed budget does not incorporate increases to provider rates. The Assembly described the Care COLA proposal as a “first step in a multi-year effort currently being collectively bargained by the Governor and Child Care Providers United.” The state plans to continue to work with Child Care Providers United (CCPU) to negotiate a successor agreement to the current contract, which expires on June 30, 2023. Rate increases could be considered as a part of these negotiations.
Includes over $184 million from the General Fund to support an estimated 8.22% statutory cost-of-living adjustment (COLA). This increase would be provided to child care and development programs ($183.3 million) as well as the Child and Adult Care Food Program ($840,000).
While the proposed budget includes a 8.22% COLA, this increase only applies to the rates received by providers that contract directly with the state. Providers that are a part of the state subsidy system will not see an increase in rates in the proposed budget, despite the roughly $1 billion for rate increases named in the Senate budget plan and the Assembly’s “Care COLA.”
May Revision Fails to Expand Paid Sick Leave
Most California workers are entitled to at least 24 hours of paid sick leave per year. State policymakers temporarily expanded the amount of paid sick leave available to California workers during the COVID-19 pandemic, providing up to 80 hours of annual leave for COVID-related reasons. However, this supplemental paid sick leave expired at the end of 2022, leaving many workers with just three days of paid sick leave to care for themselves or a family member.
The May Revision does not propose to expand paid sick leave. As a result, under the governor’s plan many workers would continue to have just three days of paid sick leave per year. In contrast, a bill moving through the Legislature would expand sick leave from three days to seven. California lags behind every other state that has paid sick leave — leaving workers with the impossible choice of going to work while sick or losing their paycheck. State leaders should require employers to provide additional paid sick days for workers so that all Californians are able to care for themselves or their loved ones when they are ill.
May Revision Boosts State’s Commitment to Addressing Needs of Migrants
California has the largest share of immigrant residents of any state, and over half of California workers are immigrants or children of immigrants. More than 2 million Californians are undocumented, according to estimates.
The May Revision boosts California’s commitment to addressing the needs of migrants along the border. Specifically, the governor proposes to spend $150 million from the General Fund in 2023-24 to provide respite sheltering for migrants and “support their safe passage through border regions.” This initiative will prioritize vulnerable groups, including families with young children and LGBTQ+ individuals.
The revised budget also maintains some recent key commitments to immigrant Californians. Specifically, the May Revision:
Continues to fund full inclusion in Medi-Cal for otherwise eligible Californians regardless of immigration status. This expansion is set to take effect beginning in January 2024 (see the Coverage, Affordability & Access section).
Moves up the start date for expanding food assistance to otherwise eligible undocumented Californians age 55+. These Californians are now anticipated to begin receiving benefits through the California Food Assistance Program in October 2025 rather than the initial date of January 2027 (see the Food Assistance section).
The May Revision does leave some urgent needs of immigrant Californians unmet, however. There is no funding to provide a basic safety net for California workers who lose their jobs and are undocumented, who continue to be excluded from unemployment insurance (UI) benefits despite their critical contributions to the state’s economy and our communities. In contrast, the Senate budget plan envisions extending UI benefits to these excluded workers.
Education
Governor Continues to Focus Investments in Transitional Kindergarten
The governor’s 2021-22 budget included a plan to implement universal transitional kindergarten (TK) for all 4-year-olds over a four-year period. The 2023-24 proposed budget aligns with year two of TK implementation (2021-22 was considered a planning year). TK eligibility is based on age alone in public schools and is not dependent on family income. In addition to TK, the state also funds the California State Preschool Program (CSPP). CSPP provides preschool to children ages 3 and 4 for families with low to moderate incomes. While CSPP and TK reflect the two state-funded pre-kindergarten programs, they are among several early learning options available to California families with low to moderate incomes (see section on Child Care).
The governor’s revised budget:
Continues to fund the implementation of TK expansion. The initial year one expansion took effect during the current fiscal year — 2022-23 — and covered children whose fifth birthdays fell between September 2 and February 2 (the previous cut-off was December 2). The year two 2023-34 expansion will provide eligibility to children who turn 5 between September 2 and April 2 (about 42,000 children). The governor proposes approximately $762 million for 2023-24 costs to expand TK access. Of this total, roughly $597 million will support expanded eligibility and $165 million will support one additional certificated or classified staff person in TK classrooms. The $597 million to support expanded eligibility is a reduction from the $690 million proposed in the January budget. This difference is due to reduced TK enrollment projections at the time of the May Revision (roughly 4,000 children).
Includes roughly $95 million to support an 8.22% statutory cost-of-living adjustment for the state preschool program. This increase reflects $60 million Proposition 98 General Fund and $35.3 million General Fund. The total funding amount is an $80 million reduction from the January 2023 estimates. The May Revision states that this reduction is due to a lower number of state preschool program contractors being reimbursed at the State Reimbursement Rate than originally expected.
Includes $9.7 million to waive family fees for the state preschool program. In addition to the proposal to waive family fees for child care and development programs (see Child Care section), the May Revision proposes to continue to waive family fees for CSPP from July 1, 2023 through September 30, 2023. The governor proposes that a total of $4.4 million non-Proposition 98 General Fund and $5.3 million Proposition 98 General Fund from the 2022 Budget Act be used to waive CSPP family fees.
Includes temporary stipends to state preschool program providers. The governor authorizes the California Department of Education (CDE) to use around $112 million in federal funds to provide stipends for CSPP providers. As mentioned in the Child Care section, Assembly Bill 100 and Assembly Bill 110 were recently signed by the governor, confirming temporary stipend funding for both state preschool and child care and development providers.
Continues to implement a multiyear plan to ensure CSPP serves a greater diversity of children. The 2022-23 budget package increased payment rates for certain children enrolled in state preschool, including children with disabilities, dual language learners, and 3-year-olds. In exchange, preschool providers have begun enrolling more children with disabilities and providing enhanced services to dual language learners. In January, the governor proposed to continue implementing this plan in 2023-24, at a cost of $64.5 million Proposition 98 General Fund and $51.8 million General Fund.
Delays a planned $550 million investment in preschool, TK, and full-day kindergarten facilities from 2023-24 to 2024-25. This delay was included in the governor’s January budget. Facilities investments are intended to help build new school facilities or retrofit existing buildings in order to provide appropriate spaces for preschool, TK, and full-day kindergarten.
Does not include funding for educator (including early educator) recruitment needs. The Senate budget plan includes $1.1 billion one-time Proposition 98 General Fund for resources such as incentives and staff training to support educators with earning units at institutions of higher education. The Senate budget plan states that this funding may support developing micro-credential programs for transitional kindergarten. The governor’s plan does not include funds for the Senate’s outlined educator recruitment needs.
K-14 Education’s Minimum Funding Level Drops Due to Lower Revenue Estimates
Approved by voters in 1988, Proposition 98 constitutionally guarantees a minimum level of funding for K-12 schools, community colleges, and the state preschool program. Changes in state General Fund revenues tend to affect the Prop. 98 guarantee, and the May Revision’s estimates of 2022-23 and 2023-24 revenues are lower than those estimated in January’s budget proposal. As a result, the May Revision assumes a 2023-24 Prop. 98 funding level of $106.8 billion, approximately $2 billion below the level assumed in the governor’s January budget proposal, and a 2022-23 Prop. 98 funding level of $106.8 billion, slightly lower than the $107 billion funding level assumed in January. The revised budget assumes a 2021-22 Prop. 98 funding level of $110.6 billion, slightly above the $110.4 billion funding level assumed by the governor in January.
Revenue projections in the governor’s January budget proposal would have required a deposit into the Public School System Stabilization Account (PSSSA) — the state budget reserve for K-12 schools and community colleges — raising the account balance to $8.5 billion. However, the May Revision projects an increase in capital gains revenues as a share of General Fund revenues. This increase would boost the required PSSSA deposit and bring the total account balance to approximately $10.7 billion in 2023-24, which would reflect its constitutional limit. (See Reserves section.) Moreover, because the PSSSA balance is projected to exceed 3% of the total K-12 share of the Prop. 98 minimum funding level in 2022-23, current law would prevent K-12 school districts from maintaining more than 10% of their budgets in local reserves beginning in 2023-24.
Revised Budget Funds a Large Cost-of-Living Adjustment for K-12 Education
The largest share of Prop. 98 funding goes to California’s school districts, charter schools, and county offices of education (COEs), which provide instruction to 5.9 million students in grades kindergarten through 12. The governor’s revised spending plan uses one-time dollars to help fund a large cost-of-living adjustment (COLA) to the state’s K-12 education funding formula — the Local Control Funding Formula (LCFF). Specifically, the May Revision:
Provides a $3.4 billion year-over-year increase for the LCFF. The LCFF provides school districts, charter schools, and COEs a base grant per student, adjusted to reflect the number of students at various grade levels, as well as additional grants for the costs of educating English learners, students from low-income families, and foster youth. The May Revision would fund an 8.22% COLA for the LCFF in 2023-24, up from the 8.13% COLA estimated in the January budget proposal. The revised spending plan proposes to use $2.7 billion in one-time dollars to help pay for the large increase in ongoing support for the LCFF. According to the Assembly Budget Committee, the May Revision would provide an estimated $79.8 billion in funding for the LCFF in 2023-24.
Cuts approximately $2.5 billion from the Learning Recovery Emergency Block Grant. The 2022-23 budget agreement provided $7.9 billion for a one-time block grant to K-12 school districts, COEs, and charter schools allocated based on the percentage of enrolled students who are English learners, students from low-income families, or foster youth. The May Revision proposes to reduce this funding to approximately $5.4 billion.
Cuts the Arts, Music, and Instructional Materials Discretionary Block Grant by approximately $600 million more than proposed in January. The governor’s January budget proposed reducing, from nearly $3.6 billion to approximately $2.3 billion, one-time funding for a per pupil discretionary block grant provided to local educational agencies (LEAs) in the 2022-23 budget agreement. The May Revision proposes to reduce funding for the block grant to approximately $1.8 billion.
Increases funding by approximately $300 million for school nutrition programs. For the 2022-23 school year, California established a Universal Meals Program that provides two free meals per day to any public K-12 student regardless of income eligibility. The revised spending plan includes an additional $110 million in one-time dollars and approximately $191 million in ongoing dollars to fully fund increased demand for the program in 2022-23 and 2023-24.
Provides $80 million in ongoing funding for COEs serving students in juvenile court. Therevised spending plan states these additional resources would be used to support staffing and programming requirements for students in alternative school settings. The May Revision also proposes to increase COEs’ LCFF base grants by 50% for the additional year of assistance they would provide, based on a proposal in the governor’s January budget, to school districts with performance issues.
Provides $20 million for the Bilingual Teacher Professional Development Program (BTPDP). The BTPDP was established in 2018, but it expired in June 2021. The May Revision would reinstitute the program and make funding available through 2028-29.
Funds an increase in the COLA for non-LCFF programs.The May Revision increases the COLA for several categorical programs that remain outside of the LCFF to 8.22% from the 8.13% COLA provided in January.
Maintains $300 million for a proposed “equity multiplier” add-on to the LCFF. The revised spending plan would continue to provide ongoing funding proposed in January for LEAs with large shares of students from families with low incomes. Additionally, the May Revision states that it reflects changes to the state’s K-12 accountability system to clarify those proposed in January “including additional assurances that all LEAs with low student performance address disparities in the preparation of their educators.”
Proposes to screen students in kindergarten through 2nd grade for risk of reading difficulties. The May Revision proposes to make these screenings mandatory by the 2025-26 school year and would require LEAs to provide services to identified students, including those at risk of dyslexia.
Extends the deadline for spending Expanded Learning Opportunities Program (ELOP) funds. The 2022-23 budget agreement provided $4 billion for the ELOP. The May Revision extends the June 30, 2023 deadline for spending ELOP funds received in 2021-22 and 2022-23 to June 30, 2024.
The Revised Spending Plan Reduces Several One-Time Investments for Community Colleges
A portion of Proposition 98 funding provides support for California’s Community Colleges (CCCs), the largest postsecondary education system in the country, which serves high percentages of students of color and students with low incomes. CCCs prepare approximately 1.8 million students to transfer to four-year institutions or to obtain training and employment skills.
The 2023-24 May Revision proposes reductions to several one-time investments and also provides additional funds for a cost-of-living adjustment (COLA) for apportionments. Specifically, the revised spending plan:
Reduces the COVID-19 Recovery Block Grant by more than half in 2022-23. The 2022 Budget Act included $650 million one-time Prop. 98 for a flexible block grant for community college districts to address the impacts of COVID-19 on students. The revised plan reduces funding for this grant by $345 million in the current fiscal year.
Reduces proposed funding to support student enrollment and retention. The revised budget includes a reduction of $100 million of the proposed $200 million one-time Prop. 98 that would support colleges in increasing enrollment and retention rates. While recent CCC enrollment rates have shown modest increases, the CCC system experienced significant drops in enrollment as a result of the COVID-19 pandemic.
Proposes additional reductions for deferred maintenance projects. The May Revision decreases funding for these projects by $239 million one-time Prop. 98 dollars, for a total reduction of $452 million.
Includes approximately $28 million for an 8.22% COLA for apportionments and other programs. These funds reflect an increase of $25.4 million ongoing Prop. 98 dollars for the Student Centered Funding Formula (SCFF) for a total of $678 million. The proposal also provides the same percentage COLA to other CCC categorical programs and the Adult Education Program, and allocates an additional $3 million ongoing Prop. 98 dollars for that purpose.
Allocates one-time dollars for apportionments in 2023-24. The spending plan also includes an increase of about $503 million one-time Prop. 98 dollars for the Student Centered Funding Formula in 2023-24.
The May Revision also includes details on proposed spending flexibilities for CCC districts. The revised spending plan proposes statutory changes that would allow CCC districts to spend flexibly among the Student Equity and Achievement Program, Student Financial Aid Administration, and Student Mental Health Resources. This expanded flexibility would begin in 2023-24. Districts not making “sufficient” progress toward the CCC roadmap goals that were established in the 2022 Budget Act would have that flexibility revoked.
May Revision Maintains Multiyear Funding Investments for the CSU and UC Systems
California supports two public four-year higher education institutions: the California State University (CSU) and the University of California (UC). The CSU provides undergraduate and graduate education to roughly462,000students on 23 campuses, and the UC provides undergraduate, graduate, and professional education to about290,000students on 10 campuses.
The revised spending plan maintains the 5% base increases to both the CSU and the UC, $227 million and $216 million, respectively. This increase is part of the multiyear funding investments established through the compacts between the administration and the CSU and UC systems. The compacts outline major goals, including increasing access; improving student success and advancing equity; increasing affordability; improving collaboration among systems of higher education; and supporting workforce preparedness.
To address the budget shortfall, both the CSU and UC budgets include funding shifts totaling approximately $1.8 billion. Specifically, the funding shifts include:
Approximately $856 million General Fund support to CSU-issued bonds for infrastructure projects and affordable student housing grants. The spending plan includes $61 million ongoing General Fund for debt service on those bonds.
Approximately $935 million General Fund support to UC-issued bonds for capital outlay projects and affordable student housing grants. The spending plan also includes $63.3 million ongoing General Fund for debt service on those bonds.
Other higher education proposals in the revised spending plan include:
$545 million for affordable student housing projects at the California Community Colleges (CCCs). This includes $450 million one-time General Fund in 2023-24 and $95.4 million one-time General Fund in 2024-25. The 2022-23 budget agreement allocated these funds to support all three segments of higher education for the construction of, or renovation of commercial properties into, affordable student housing. See CCCs section for other CCC proposals.
Maintains a delay — to 2025-26 — of $900 million in 2023-24 and $250 million in 2024-25 for the student housing revolving loan program that was established in the 2022 Budget Act to support all three systems of higher education.
A decrease of $480 million one-time General Fund in the current fiscal year to the Golden State Education and Training Program. This program supports Californians who lost their jobs as a result of the pandemic to reskill, upskill, or access educational or training programs.
Maintains an increase of $227 million one-time General Fund for the Middle Class Scholarship that the administration committed to in the 2022 Budget Act.
Workforce & Other Proposals
Governor Reverses Some Workforce Cuts Proposed in January
The May Revision proposes to restore funding to two programs the Administration proposed cutting in January. The first is a reversal of a proposed $49.8 million General Fund cut over four years to various public health workforce training and development programs. The second is a reversal of a proposed $30 million General Fund cut ($15 million in each of 2023-24 and 2024-25) to the Department of Industrial Relations’ Women in Construction Unit, which promotes and supports women and non-binary individuals in skilled trade careers.
May Revise Makes Modest Adjustments to CalKids Proposal
The California Kids Investment and Development Savings Program (CalKIDS) establishes college savings accounts for California children with an initial seed deposit provided by the state. All newborns receive a seed deposit of at least $25, while first graders living in low income families receive $500 seed deposits. First graders who are foster youth get an additional $500, and those who are homeless get an additional $500 for a maximum deposit of $1,500.
In January, the governor proposed increasing the seed deposit for all newborns from $25 to $100, funded by redirecting $30 million ongoing General Fund beginning in 2023-24 that was intended for seed deposits for first graders. The administration projected that there would be fewer eligible first graders than originally expected and that less money would be needed to provide seed deposits to them.
The May Revision includes a new adjustment that further revises down the number of eligible students, resulting in a decrease of $30 million in the General Fund in 2022-23. The administration does not propose a particular use of this savings.
Revised Spending Plan Maintains Delays for Broadband Infrastructure Projects
The pandemic exposed the inequities in access to computers and high-speed internet, also known as the digital divide. Access to such technology is necessary to participate in education and other essential activities, such as remote work, applying for jobs, virtual health appointments, and access to many other services. The digital divide disproportionately impacts low-income and Latinx households, as well as children and youth, seniors, and people with disabilities.
The 2023-24 revised spending plan maintains funding delays of more than $1.1 billion in funding to future years for last-mile infrastructure grants and the Loan Loss Reserve Fund. Both programs support the expansion of broadband infrastructure at the local level and are overseen by the California Public Utilities Commission (CPUC).
Last-mile infrastructure (wires, poles, cables, and other components) refers to the final section of a network that connects to middle-mile infrastructure (fiber-optic cables laid over hundreds of miles) and provides high-speed internet access to individual communities and households. The Loan Loss Reserve Fund supports local governments, tribes, and nonprofits in financing local broadband infrastructure development.
In contrast to the May Revision, the Senate budget plan proposed additional funding for infrastructure, including more than $1.1 billion for last-mile broadband projects and the Loan Loss Reserve Fund.
May Revision Does Not Propose or Plan for Additional Prison Closures
More than 96,200 adults who have been convicted of a felony offense are serving their sentences at the state level, down from a peak of 173,600 in 2007. American Indian, Black, and Latinx Californians are disproportionately represented in state prisons — a racial disparity that reflects implicit bias in the justice system, structural disadvantages faced by these communities, and other factors.
Among all incarcerated adults, most — 91,980 — are housed in state prisons designed to hold fewer than 80,000 people. This level of overcrowding equals 115.2% of the prison system’s “design capacity,” which is below the prison population cap — 137.5% of design capacity — established by a 2009 federal court order. California also houses more than 4,300 people in facilities that are not subject to the cap, including fire camps, in-state “contract beds,” and community-based facilities that provide rehabilitative services. The sizable drop in incarceration has resulted from both 1) a series of justice system reforms enacted by voters and state leaders and 2) changes adopted in 2020 to further reduce prison overcrowding in response to the COVID-19 pandemic, such as suspending intakes from county jails and implementing early releases.
The governor’s May Revision includes a previously announced plan to reduce prison capacity in the following ways:
By the end of 2023, the state will complete the deactivation of certain facilities within six state-owned prisons, generating ongoing annual General Fund savings of roughly $170 million.
By March 2024, the state will end its contract for the use of the California City Correctional Facility. California City is the last of several private prisons that the state began leasing to help alleviate overcrowding in state-owned prisons, generating ongoing General Fund savings of roughly $156 million.
By March 2025, the state will shut down the Chuckawalla Valley State Prison in Blythe.
Adults who are housed in these various facilities will be moved to “appropriate level” state-owned prisons.
This planned downsizing of the prison system follows the closure of one state prison in September 2021 — Deuel Vocational Institution in Tracy — and the anticipated shutdown of another state prison — California Correctional Center in Susanville.
But California can do more. The state can safely close up to five additional state prisons, according to a recent report by the Legislative Analyst’s Office. The ongoing savings from closing five additional prisons — around $1 billion per year — could be redirected to help people make the transition back to their communities more successfully and boost services to support survivors of crime, reduce poverty, increase housing stability, address substance use and mental health issues, and enhance the safety and well-being of our communities.
Revised Budget Doubles Funding to Address Missing Indigenous Persons
California is home to more people of American Indian/Alaska Native heritage than any other state in the country. There are currently 109 federally recognized Indian tribes in California, including several tribes with lands that cross state boundaries. There are also about 45 tribal communities of formerly recognized tribes that were terminated as part of the United States’ termination policy in the 1950s, as well as tribal communities that were never recognized by the federal government. The diverse array of tribal nations in California currently have nearly 100 separate reservations or rancherias and a number of individual Indian trust allotments. These lands constitute Indian Country.
American Indian/Alaska Native communities experience crime and victimization at higher rates than other populations. In particular, community members and researchers have long identified a crisis of missing and murdered Indigenous peoples, particularly among women. Community advocates describe this crisis “as a legacy of generations of government policies of forced removal, land seizures, and violence inflicted on Native peoples.”
In order to help address this crisis among tribal nations in California, the state recently provided $12 million from the General Fund over three years to help tribal police and prosecutors collect data and investigate cases of missing Indigenous persons. These funds may also be used for counseling services and other activities. The May Revision proposes an additional $12 million General Fund for these purposes — doubling the total allocation to $24 million.
In terms of other local public safety measures, the governor’s revised budget:
Proposes to restructure a new gun buyback program to get firearms out of circulation more quickly. In 2022, the state provided $25 million General Fund to buy back guns using a competitive grant model overseen by the Board of State and Community Corrections. However, citing recent mass shootings and the need for faster action, the governor proposes to shift these funds to the Office of Emergency Services to “work directly with local law enforcement agencies to expedite targeted, coordinated gun buybacks.”
Provides $10 million one-time General Fund to enhance security among nonprofits that are at risk of hate-motivated violence. This includes organizations that represent Asian American and Pacific Islander, Black, Jewish, Latinx, and LGBTQ+ communities. The funds could be used for reinforced doors, alarms, and other security improvements.
Projects state savings of nearly $113 million in 2023-24 due to reduced incarceration stemming from Proposition 47, with these dollars required to be invested in a broad array of services. Approved by voters in 2014, Prop. 47 reduced penalties for six nonviolent drug and property crimes from felonies to misdemeanors. Consequently, state prison generally is no longer a sentencing option for these crimes. Instead, individuals convicted of a Prop. 47 offense serve their sentence in county jail and/or receive probation. By decreasing state-level incarceration, Prop. 47 reduced the General Fund cost of the state prison system (relative to the expected cost if Prop. 47 had not been approved). The state Department of Finance is required to annually calculate these savings, which are then deposited into the Safe Neighborhoods and Schools Fund and allocated as follows: 65% to mental health and drug treatment programs, 25% to K-12 public school programs for at-risk youth, and 10% to trauma recovery services for crime victims.
There was a problem processing your signup. Please try again. Or contact us
Please check your email to confirm your signup.
Health care should be accessible and affordable to all Californians. No one should ever have to skip or delay health care due to the cost. Forgoing preventive care or treatment for health conditions is harmful to health and well-being.
Unfortunately, many Californians lack access to affordable health care. For some, monthly health insurance premiums are too high, and so they go without coverage. But even when people have health insurance, steep out-of-pocket costs — such as copays and deductibles — often deter individuals from obtaining the care they need. The impact of unaffordable care falls disproportionately on Californians of color due to a legacy of racist policies and practices:
Latinx Californians are most likely to experience problems paying medical bills, followed by Black, white, and Asian Californians.
Latinx and Black Californians are more likely to report having medical debt.
Black and Latinx Californians are most likely to skip health care services due to the cost.
Ensuring that all Californians have access to affordable health coverage and that they can access care when they need it will require additional state investments. In fact, funds are already available to make coverage more affordable for hundreds of thousands of Californians. Yet, Governor Newsom has blocked efforts to use these funds to boost affordability assistance.
California’s Individual Mandate Penalty: A Funding Source to Help Make Health Coverage More Affordable
In 2019, state policymakers created a penalty that applies, with certain exceptions, to people who lack minimum essential health coverage. This penalty is formally called the “Individual Shared Responsibility Penalty,” but is more commonly known as the “individual mandate penalty.”
The individual mandate penalty has two primary purposes:
Encourage young and healthy people — who might be inclined to go without health insurance — to enroll in coverage in order to ensure a more balanced “risk pool” and prevent premiums from spiraling upward.
Provide a funding source to reduce the cost of health insurance for people who buy coverage through Covered California, our state’s health insurance marketplace.
The individual mandate penalty can be costly. An adult who lacks coverage for an entire year and doesn’t qualify for an exemption must pay at least $850 plus $425 per dependent child under 18 in the household. This means that a family with two adults and two children could face a penalty of at least $2,550.
Many Californians with low-to-moderate incomes are penalized for lacking health coverage. Specifically, nearly 2 in 5 households who reported that they owed the penalty for tax year 2020 had incomes at or below 266% of the federal poverty level (FPL). In 2020, 266% FPL reflected an annual income of around $34,000; for a family of four, it was about $69,700.
Individual Mandate Penalty Revenue Has Not Been Used for Its Intended Purpose
California is expected to raise a total of $1.4 billion in individual mandate penalty revenue across four state fiscal years: 2020-21 through 2023-24, which begins on July 1, 2023. (The penalty revenue is deposited into the state’s General Fund.) However, none of these dollars have been specifically budgeted to reduce the cost of insurance purchased through Covered California. Instead, some penalty revenue appears to have been absorbed by the state’s General Fund and used to support other public systems and services.
Notably, state leaders did agree in 2021 to deposit $334 million in penalty revenue into a new Health Care Affordability Reserve Fund. These dollars were explicitly set aside to fund affordability assistance for Covered California enrollees.
However, last year the governor halted implementation of an affordability assistance program that would have been supported with the penalty reserve funds. This program would have eliminated deductibles and reduced copays for hundreds of thousands of Californians who purchase health insurance through Covered California — including people with low-to-moderate incomes.
Moreover, the governor now proposes to transfer all $334 million in penalty revenue from the Health Care Affordability Reserve Fund to the state’s General Fund in order to help address the projected budget shortfall. With this proposal, the governor makes clear that he does not prioritize using the penalty revenue for its intended purpose: further reducing the cost of health coverage for Californians who are struggling to afford the cost of care.
The governor also has failed to outline a plan for how to use the hundreds of millions of dollars in penalty revenue that the state will continue to receive each year from Californians who lack minimum essential health coverage. Without a plan, penalty dollars will end up supporting general state budget costs rather than being targeted to assist Californians struggling with the high cost of health care.
Penalizing Californians with Low-to-Moderate Incomes Without Addressing Health Care Affordability Is an Injustice
Penalizing Californians with low-to-moderate incomes for not obtaining health coverage and then failing to use the penalty revenue to address the high cost of coverage and care is an injustice. Additional financial assistance is critical for Californians who are uninsured and struggling to purchase coverage as well as for those who are insured but can’t afford to access the care they need. Governor Newsom should ensure that dollars raised from the state’s individual mandate penalty help people afford health insurance through Covered California, as was intended when the penalty was established.
There was a problem processing your signup. Please try again. Or contact us
Please check your email to confirm your signup.
Californians from all corners of the state — of all races and ethnicities, genders, ages, and abilities — deserve to be able to afford the basics and thrive in their communities, and a more equitable tax and revenue system would help make that a reality. All Californians share in the responsibility of paying taxes to support public services that keep the state running and help families to be financially secure. This responsibility also extends to the corporations earning profits in the state. These corporations benefit from the fruits of the state’s public investments, which provide them with an educated workforce; a transportation infrastructure to transport goods; a functional legal system, and much more.
As millions of people struggle with the high costs of living and recovery from the health and economic effects of the pandemic, corporate profits have surged to historic new highs in recent years. However, corporations now pay just about half of what they did in the early 1980s in California taxes as a share of their income. This decline is a result of cuts to the corporate tax rate and the creation and expansion of corporate tax breaks. In addition, corporations were granted significant federal tax cuts as part of the “Tax Cuts and Jobs Act” of 2017, and some corporations even manage to pay nothing in federal taxes.
Policymakers have many options to ensure that profitable corporations are adequately contributing to California’s tax revenues and supporting the services that we all benefit from. These options include — but are not limited to — increasing tax rates for the most profitable corporations, ensuring that all profitable corporations pay a minimum level of taxes, and combating corporate tax avoidance. Increasing tax rates and limiting tax breaks for corporations only affects those corporations that make profits in California, so these actions will not harm struggling businesses that are operating in the red.
Increasing corporate tax revenues would provide more resources to support solutions to the most significant challenges facing Californians, such as unaffordable housing, child care, and health care costs.
1. Raise Corporate Tax Rates for the Most Profitable Corporations
When individuals and families pay their taxes, higher levels of income are subject to higher tax rates. This is not the case for corporations, which generally pay the same official tax rate regardless of the size of their profits.1Some types of corporations are subject to different rates, such as banks and other financial institutions, which pay an additional 2% in state tax because they are exempt from local taxes that other businesses pay. Corporations that are organized under Subchapter S pay only a 1.5% rate, but their shareholders pay personal income taxes on their shares of the business’ income. Additionally, the effective tax rate — the share of overall income paid in tax — varies from corporation to corporation based on the extent to which they are able to take advantage of corporate tax breaks. Just as a small share of households receive an outsized share of total income in the state, a small share of corporations earn the majority of profits in California. Corporations with California profits of more than $10 million represented 0.3% of corporations operating in the state but made 62% of all statewide corporate profits in 2019, according to Franchise Tax Board data.2Franchise Tax Board, Corporation Tax Annual Report, Tax Year 2019, Table C-8, https://data.ftb.ca.gov/California-Corporation-Tax/CORP-Annual-Report-2020/6mcf-cr69 Adding a surtax — a higher tax rate — on just these corporations could raise substantial revenues without affecting the vast majority of businesses.3Jonathan Kaplan, Why Aren’t Large Corporations Paying Their Fair Share of Taxes and What Can California Policymakers Do About It?, (California Budget & Policy Center, April 2021), 6, https://calbudgetcenter.org/app/uploads/2021/03/IB-FP-Corporate-Taxes.pdf.
Of course, policymakers could set the threshold for a surtax lower than $10 million, or move to a graduated corporate tax structure where higher increments of profits are subject to higher rates. Several states already have graduated corporate tax structures and a few states have enacted temporary surtaxes on highly profitable corporations. Asking those corporations that are immensely profitable to contribute more to support state services would improve tax fairness and protect small and struggling businesses.
2. Ensure That Corporations Pay an Adequate Minimum Level of State Taxes
Based on the premise that corporations that take advantage of certain tax preferences should still pay a minimum level of taxes, the state put into place different rules to compute tax liability for these corporations.4This alternative minimum tax system is in addition to the $800 “minimum franchise tax” that must be paid by all corporations incorporated in, registered in, or doing business in California. However, state law still allows corporations to use many tax credits to reduce the minimum tax they would owe under these rules. This includes the research and development credit — the state’s largest credit, representing about 4 in 5 dollars of the total cost of California’s corporate tax credits.5Franchise Tax Board, Corporation Tax Annual Report, Tax Year 2019, Table C-7. As a result, California does not actually ensure that profitable corporations pay an adequate minimum level of tax. Policymakers could strengthen the minimum tax by not allowing credits to reduce a corporation’s tax liability below the minimum tax.6Specifically, credits could not be allowed to reduce taxes owed below the “tentative minimum tax,” which is the amount resulting by applying a 6.65% tax rate (or 8.65% for financial institutions) to an alternative income calculation which removes certain tax preferences. Credits could also not be allowed to reduce the “alternative minimum tax,” which is the additional amount that a corporation generally must pay when their tentative minimum tax exceeds their regular tax liability.
Another approach would be to simply limit the extent to which a corporation can use tax credits to reduce their tax bill in any given year. For example, California temporarily prohibited businesses from using more than $5 million in tax credits — excluding the low-income housing credit — to reduce their tax liability in 2020 after the COVID-19 pandemic hit when the state’s finances were expected to suffer. Policymakers could institute such a limit on a permanent basis, or limit the credits that can be claimed in a given year to a specific percentage of the tax that a corporation would otherwise owe. For example, credits could be limited to one-half of a corporation’s pre-credit tax liability in any given tax year.
3. Limit the Ability of Corporations to Avoid State Taxes by Using Tax Havens
Corporations doing business in multiple countries can minimize or even eliminate the taxes they owe to the US federal and state governments by shifting their profits into subsidiaries in jurisdictions with low or zero tax rates, known as tax havens. One recent estimate suggests that about one-quarter of the profits of US multinational corporations are booked abroad, and that about half of these foreign profits are booked in tax havens.7The authors also estimate that around 13-15% of the total worldwide profits of US corporations were booked in tax havens across 2015-2020, which they note represents a historically high level. Javier Garcia-Bernardo, Petr Janský, and Gabriel Zucman, Did The Tax Cuts And Jobs Act Reduce Profit Shifting By US Multinational Companies? (National Bureau of Economic Research, Working Paper 30086, May 2022), 3, https://www.nber.org/system/files/working_papers/w30086/w30086.pdf. Much of these shifted profits are not actually earned in these foreign jurisdictions, but have been artificially shifted out of the United States using creative accounting techniques.8One such technique is transferring intellectual property rights — such as patents and trademarks — to their foreign subsidiaries, which can then charge the US parent company for the use of that intellectual property. See, for example, Ana Maria Santacreu and Jesse LaBelle, “Profit Shifting Through Intellectual Property,” Federal Reserve Bank of St. Louis, Economic Synopses, no. 22 (July 2022), https://doi.org/10.20955/es.2022.22.
California and many other states allow corporations to take advantage of a loophole known as the water’s edge election, which enables this type of tax avoidance. This provision allows corporations to choose whether or not to include the income held by their foreign subsidiaries in their overall income when calculating the share that is taxable in California.9Generally, corporations determine the share of their total income that is taxable in California based on the share of their total sales that are made to California customers. This gives these corporations an incentive to shift profits abroad to avoid state taxes, and also gives them the option of choosing whichever of the two methods will result in the lowest tax liability. The water’s edge election is projected to cost the state an estimated $4.4 billion in 2022-23.10Department of Finance, Tax Expenditure Report 2022-23, 11, https://dof.ca.gov/wp-content/uploads/sites/352/Forecasting/Revenue_and_Taxation/TaxExpenditureReport.pdf.
The most comprehensive option to address this type of tax avoidance would be to eliminate the water’s edge election and require corporations to include their worldwide income as a starting point when calculating the share of their income subject to California taxes. This approach is known as “worldwide combined reporting,” and was used by California and other states in the past.11See, for example, Darien Shanske, White Paper on Eliminating the Water’s Edge Election and Moving to Mandatory Worldwide Combined Reporting (August 2, 2018), https://dx.doi.org/10.2139/ssrn.3225310. There are also less comprehensive measures that policymakers could consider. One approach that some other states have taken is requiring corporations to just include the profits they have booked in known tax havens for the purpose of computing their state taxes.12See Richard Phillips and Nathan Proctor, A Simple Fix for a $17 Billion Loophole How States Can Reclaim Revenue Lost to Tax Havens (Institution on Taxation and Economic Policy, U.S. PIRG Education Fund, SalesFactor, and American Sustainable Business Council, January 17, 2019), 7-8 and 11-13, https://itep.org/a-simple-fix-for-a-17-billion-loophole/. Another is to explore following the approach that the federal government adopted in 2017 of taxing “global intangible low-taxed income” or “GILTI.”13See Darien Shanske and David Gamage, “Why States Should Tax the GILTI,” State Tax Notes (March 4, 2019), https://papers.ssrn.com/sol3/papers.cfm?abstract_id=3374987; and Darien Shanske and David Gamage, “Why States Can Tax the GILTI,” State Tax Notes (March 18, 2019), https://papers.ssrn.com/sol3/papers.cfm?abstract_id=3374991. The GILTI regime is, however, complex and imperfect, so this option requires careful consideration and potential modifications to ensure the policy is effective and legally permissible.
Corporate Tax Transparency, Corporate Tax Breaks, and Barriers to Raising Revenues
Beyond the three options discussed here, policymakers should also increase corporate tax transparency, scale back corporate tax breaks, and address barriers to raising revenues. These steps would help make the state’s corporate tax system — and the state’s revenue system as a whole — more fair and effective.
First, greater transparency is needed to shed light on the extent to which corporations are engaging in questionable tactics to minimize or wipe out their state liability. This includes stronger data reporting requirements, which can be structured to avoid jeopardizing taxpayer privacy.
Policymakers should also examine the specific corporate tax breaks that already exist in the state’s tax code. These tax breaks should be regularly reviewed and subject to nonpartisan evaluation to determine if and how well they are achieving their policy goals, what types of corporations receive the most benefits, and whether they should be retained, reformed, or eliminated.
Finally, the state’s constitutional spending cap (the Gann Limit) poses challenges to any policy change that raises significant revenues, since substantial new revenues will push the state closer to or above the spending cap, and revenues above the cap are restricted to being spent in specific ways. This limits the ability of state leaders to use revenues to address the most pressing challenges faced by Californians. Policymakers could raise significant revenues and avoid this limitation by using the new revenues for tax benefits that improve the economic and social well-being of Californians with low and middle incomes — such as expanding the California Earned Income Tax Credit and Young Child Tax Credit. With this approach, revenues would not increase on net, allowing the state to avoid going over the spending cap and facing a restriction on how those revenues could be used. For policymakers to have more flexibility in spending significant new revenues — beyond investing them in tax benefits for people with low or moderate incomes — it will be necessary to reform the Gann Limit.
Some types of corporations are subject to different rates, such as banks and other financial institutions, which pay an additional 2% in state tax because they are exempt from local taxes that other businesses pay. Corporations that are organized under Subchapter S pay only a 1.5% rate, but their shareholders pay personal income taxes on their shares of the business’ income. Additionally, the effective tax rate — the share of overall income paid in tax — varies from corporation to corporation based on the extent to which they are able to take advantage of corporate tax breaks.
This alternative minimum tax system is in addition to the $800 “minimum franchise tax” that must be paid by all corporations incorporated in, registered in, or doing business in California.
Specifically, credits could not be allowed to reduce taxes owed below the “tentative minimum tax,” which is the amount resulting by applying a 6.65% tax rate (or 8.65% for financial institutions) to an alternative income calculation which removes certain tax preferences. Credits could also not be allowed to reduce the “alternative minimum tax,” which is the additional amount that a corporation generally must pay when their tentative minimum tax exceeds their regular tax liability.
7
The authors also estimate that around 13-15% of the total worldwide profits of US corporations were booked in tax havens across 2015-2020, which they note represents a historically high level. Javier Garcia-Bernardo, Petr Janský, and Gabriel Zucman, Did The Tax Cuts And Jobs Act Reduce Profit Shifting By US Multinational Companies? (National Bureau of Economic Research, Working Paper 30086, May 2022), 3, https://www.nber.org/system/files/working_papers/w30086/w30086.pdf.
8
One such technique is transferring intellectual property rights — such as patents and trademarks — to their foreign subsidiaries, which can then charge the US parent company for the use of that intellectual property. See, for example, Ana Maria Santacreu and Jesse LaBelle, “Profit Shifting Through Intellectual Property,” Federal Reserve Bank of St. Louis, Economic Synopses, no. 22 (July 2022), https://doi.org/10.20955/es.2022.22.
9
Generally, corporations determine the share of their total income that is taxable in California based on the share of their total sales that are made to California customers.
See, for example, Darien Shanske, White Paper on Eliminating the Water’s Edge Election and Moving to Mandatory Worldwide Combined Reporting (August 2, 2018), https://dx.doi.org/10.2139/ssrn.3225310.
12
See Richard Phillips and Nathan Proctor, A Simple Fix for a $17 Billion Loophole How States Can Reclaim Revenue Lost to Tax Havens (Institution on Taxation and Economic Policy, U.S. PIRG Education Fund, SalesFactor, and American Sustainable Business Council, January 17, 2019), 7-8 and 11-13, https://itep.org/a-simple-fix-for-a-17-billion-loophole/.
There was a problem processing your signup. Please try again. Or contact us
Please check your email to confirm your signup.
Introduction
Every Californian deserves a safe and stable place to call home in order to have the opportunity to live a dignified and healthy life. Yet, over 171,000 Californians were counted as experiencing homelessness in early 2022.
These Californians were either residing in shelters or transitional housing — or considered unsheltered, residing on the street, in encampments, vehicles, or other places not meant for habitation. During calendar year 2021, local homeless service providers made contact with over 270,000 individuals needing to find a home or search for other life-sustaining services — and even more were likely served in 2022.1This publication utilizes two separate sources of data for our analysis: 1) US Housing and Urban Development Point-in-Time Count which provides the number of unhoused people counted on a single night in January, and 2) the California Homeless Data Integration System through which local Continuums of Care report data to the state collected by homeless service providers throughout a year. The terms homeless and unhoused are also used interchangeably.
As people of all ages and backgrounds are pushed into homelessness, understanding their diverse characteristics is fundamental to effectively addressing their housing needs. Unhoused individuals require interventions of different types and at different scales to become and stay housed. Californians who are unhoused are more than their current living situation. State policymakers have a responsibility to support all Californians and persist in ending homelessness across the state.
1. Homelessness is temporary for most who experience it, but some face long-term, chronic homelessness
Most unhoused individuals experience relatively short-term homelessness (64%), but over a third (36%) experience chronic homelessness exacerbated by a disability. Individuals and families are considered homeless if they do not have a fixed, regular, and adequate nighttime residence — for example, if they are living in a shelter, vehicle, or other places not meant for habitation. Unhoused individuals are considered chronically homeless if:
They have a long-standing disability that significantly impedes their ability to live independently.
They have been unhoused continuously for a year or on at least four occasions within a three-year period.
Different interventions are typically needed to ensure individuals experiencing temporary or chronic homelessness secure and remain in housing. For the majority of unhoused Californians who are experiencing short-term homelessness and have extremely low incomes, deeply affordable permanent housing is needed. For those who are chronically homeless, effective evidence-based strategies are needed. This includes supportive housing that combines robust housing interventions with wrap-around supportive services.
2. Single adults make up the vast majority of unhoused Californians
Adults not with children make up 80% of the people experiencing homelessnessin California at a point in time, followed by families with children (14%) and unaccompanied youth (7%). Adults (aged 25 and over) in households not with children include sole individuals, couples, and groups of adults and can include noncustodial parents.2In the data presented here, “adults not with children” excludes young adults aged 18 to 24 who are only with other individuals under age 25 (and so are considered “unaccompanied youth”). “Adults not with children” includes a small number of young people aged 18 to 24 who are accompanied by adults aged 25 or older. They are particularly vulnerable to experiencing severe housing insecurity since they do not often qualify for many social safety net programs or are only eligible for short-term, small-sum assistance.
Unhoused families with children often fall into homelessness because of the lack of affordable housing and compounding economic challenges. Unaccompanied youth, aged 24 and younger, include youth that left home due to neglectful or unsafe family dynamics, including many LGBTQ+ youth and some parenting youth. Experiencing homelessness at any age causes trauma and negative health, educational, and economic outcomes, and these are especially exacerbated in children and youth.
Close attention should be placed on how many unhoused Californians fall into each of these three subpopulations of people experiencing homelessness — single adults, families with children, and unaccompanied youth — to appropriately build the capacity of housing and service system needs, especially for adults without children who represent the vast majority of individuals experiencing homelessness.
3. Racial disparities are stark within California’s homeless population
Black Californians are disproportionately likely to experience homelessness, and American Indian and Pacific Islander Californians are also especially affected. While Black Californians make up roughly 5% of the state’s population, they comprised over 1 in 4 unhoused people who made contact with a homelessness service provider in the 2021-22 fiscal year. Separate data from the 2022 point-in-time count show a particularly large increase in the share of Californians experiencing homelessness who are Latinx. These stark racial disparities reflect harmful current and past racist policies that have created educational, housing, economic, and health barriers for people of color – all of which directly affect an individual’s ability to obtain and sustain stable, affordable housing.
Long-standing racist policies and practices have also concentrated marginalized communities in undervalued occupations, increasing their economic insecurity which is a primary driver of experiencing homelessness. We see this today as people of color are largely pushed into lower-paying occupations, the first to lose their jobs during economic downturns, and experience the highest rates of unemployment. Consequently, Californians of color face higher risk of housing instability and are more likely to pay unaffordable portions of their income towards rent. Institutionalized practices have also placed Black and other communities of color at highest risk of justice system-involvement, which can cause and exacerbate the length of homelessness.
4. Californians experience homelessness in every county throughout the state, with the most residing in Los Angeles County
Homelessness is a statewide problem that affects Californians in every county throughout the state — rural, suburban, and urban alike. In February 2022, the Los Angeles and South Coast region (49.9%) and the San Francisco Bay Area (22.2%) had the highest shares of unhoused individuals, followed by the Sacramento Region (7.2%). Los Angeles County specifically is home to more than 40% of unhoused Californians, based on point-in-time data. This is in part due to its dense population, high housing costs, and general lack of affordable housing. Understanding the geographic distribution of where people experiencing homelessness reside is needed to appropriately design the allocation of state funding in ways that account for the proportional share of the homeless population in each local area.
5. California’s unhoused population is aging and increasingly composed of older adults
Over 40% of unhoused Californians in adult-only households who came in contact with the homelessness response system in the 2021-22 fiscal year were aged 50 and older.3Data point from custom tabulations from the California Homeless Data Integration System. Financial and medical emergencies later in life can push those who were already struggling to make ends meet into homelessness. Challenges in accessing support and social safety net programs for older adults in crisis and inadequate benefit amounts are also a driving factor.
Older adults are more likely to have underlying health conditions and disabilities that may be exacerbated by the additional stressors of being unhoused. Experiencing homelessness is already tied to severe health declines as research shows unhoused adults develop similar rates of geriatric conditions as housed adults who are 20 years older. The distinctive circumstances older adults face require more assistive services to obtain and maintain housing. As such, older unhoused Californians have significant implications for current homeless intervention practices as specific service needs should be integrated with other service systems and funding sources.
Conclusion
Lifting all Californians out of homelessness is possible. However, this cannot be done without persistence and understanding the diverse needs and housing support required for each distinct group of Californians that is unhoused. Interventions must also target overrepresented Californians, including people of color and single adults who comprise the majority of the homeless population. The challenges unhoused individuals face are not theirs alone as severe shortages of affordable housing, stagnating wages, disinvestment in mental health services, and historical and current racist policies and practices that touch on every aspect of life in California further exacerbate homelessness across communities. And while recent state budgets have included significant funding for various homeless-related services and programs, there is still a need for more investments, capacity building, and tailored interventions.
Ending homelessness through effective and respectful practices has proven to be possible through evidence-based approaches supported by sufficient ongoing funding, and it fundamentally begins with housing. By understanding the needs of unhoused Californians and focusing on solutions that work, state policymakers have the opportunity to leverage our resources to ensure all Californians have access to a home.
Support for this report was provided by the Conrad N. Hilton Foundation.
This publication utilizes two separate sources of data for our analysis: 1) US Housing and Urban Development Point-in-Time Count which provides the number of unhoused people counted on a single night in January, and 2) the California Homeless Data Integration System through which local Continuums of Care report data to the state collected by homeless service providers throughout a year. The terms homeless and unhoused are also used interchangeably.
2
In the data presented here, “adults not with children” excludes young adults aged 18 to 24 who are only with other individuals under age 25 (and so are considered “unaccompanied youth”). “Adults not with children” includes a small number of young people aged 18 to 24 who are accompanied by adults aged 25 or older.
3
Data point from custom tabulations from the California Homeless Data Integration System.
You may also be interested in the following resources:
There was a problem processing your signup. Please try again. Or contact us
Please check your email to confirm your signup.
California’s subsidized child care providers offer vital early learning and care options for families struggling to make ends meet. These early educators — who are primarily women and disproportionately women of color — deserve fair and just wages for essential work that helps children learn and grow while parents are working or going to school to support their families.
Despite providers’ critical role in nurturing children and assisting families, state leaders have failed to consistently and adequately increase provider payment rates in recent years. Without sufficient payments, child care providers are unable to offer early educators fair wages, struggle to keep pace with the rising statewide minimum wage, and can’t afford the increasing price of food and supplies. Ultimately, California providers and families suffer when affordable child care is limited in their communities because of policymakers’ lack of investment.
How Are Subsidized Child Care Providers Paid in California?
Subsidized child care providers are paid in one of two ways in California: 1) by accepting vouchers from families or 2) by contracting directly with the state. Providers who accept vouchers are reimbursed by the state based on the Regional Market Rate (RMR) Survey. The RMR survey — administered every two to three years — provides “rate ceilings” based on provider setting and the age of the child for all 58 California counties. The rate ceiling is the highest payment a provider can receive from the state for the care of a child. Providers who contract directly with the state are paid based on a Standard Reimbursement Rate (SRR). The SRR is adjusted to reflect the additional cost of serving certain children.1In 2018-19, policymakers also increased the Standard Reimbursement Rate adjustment factors for certain higher-cost groups of children, such as infants and children with disabilities. However, some (but not all) of these adjustment factors were eliminated in the 2021-22 budget agreement as part of the transition to a single reimbursement rate system for subsidized child care providers. See Assembly Bill 1808 (Committee on Budget, Chapter 32, Statutes of 2018), https://leginfo.legislature.ca.gov/faces/billTextClient.xhtml?bill_id=201720180AB1808; and Assembly Bill 131 (Committee on Budget, Chapter 116, Statutes of 2021), https://leginfo.legislature.ca.gov/faces/billNavClient.xhtml?bill_id=202120220AB131. Moreover, beginning in 2022-23, state law requires an annual cost-of-living adjustment to the SRR, although the Legislature may suspend it for a given fiscal year.
Payment Rates for Voucher-Based Child Care Providers Are Not Keeping Pace Across 58 Counties
State leaders have updated voucher-based payment rates for child care providers just twice since the 2016-17 state fiscal year. During this same period, the state law requiring annual increases to the statewide minimum wage went into effect, raising the wage by 55% from 2016-17 to 2022-23 and increasing costs for providers.2Calculations are based on the minimum wage for employers with 25 employees or less. Senate Bill 3 (Leno, Chapter 4, Statutes of 2016), https://leginfo.legislature.ca.gov/faces/billNavClient.xhtml?bill_id=201520160SB3.
The rate ceilings for child care providers across all 58 counties generally have not kept pace with the rising minimum wage even after the most recent increase to payment rates enacted in 2021-22. In the state’s most populous county — Los Angeles — payment rates for licensed centers caring for preschool-age children increased by less than half as much as the statewide minimum wage. Providers in some counties, such as Riverside County, saw miniscule rate increases of less than 5%. And in 27 counties, due to weaknesses in the rate-setting methodology, licensed centers have not received a single rate increase for care for preschool-age children since 2016-17.3Market rate surveys collect data on the tuition and fees that families can afford to pay for child care in a geographic area. These rates typically do not cover the true cost of care, as many providers supplement tuition and fees with other sources of revenue, such as grants or donations. See Bipartisan Policy Center, The Limitations of Using Market Rates for Setting Child Care Subsidy Rates (May 2020), 4-6, https://bipartisanpolicy.org/report/the-limitations-of-using-market-rates-for-setting-child-care-subsidy-rates/
State Rate for Contract Providers Doesn’t Match Rising Child Care Business Costs
Policymakers have not consistently updated the SRR each year so that contract providers can keep pace with rising staff costs and the increasing price of food and supplies. From 2016-17 to 2022-23, the SRR increased by 36.6%, falling short of the 55% increase in the state minimum wage.
Even though contract-based providers are required to meet more program standards than voucher-based providers do, the payment rate is lower than the RMR ceiling in many counties, illustrating a key problem with the state’s bifurcated rate system. To correct for this, policymakers included a provision in the 2021-22 budget agreement to reimburse contract-based providers with either the SRR or the rate for voucher-based providers, whichever is higher.4Assembly Bill 131 (Committee on Budget).
Child Care Providers Urgently Need a Substantial Pay Raise
Child care provider rates are inadequate and further destabilize the state’s early care and learning system. Policymakers should significantly increase rates in 2023-24 to ensure child care providers can keep up with costs and continue to offer invaluable care to children and families. Doing so would offer needed relief to providers and support the longer-term implementation of a new rate system that will reflect the actual cost of providing care, including paying educators fair wages.
To fully and consistently fund these critical investments in child care, state leaders will have to develop solutions that raise ongoing revenues. One option is to scale back or eliminate costly tax breaks that provide outsize benefits to wealthy people and profitable corporations. Each dollar that goes to these poorly targeted tax breaks is a dollar that is not available to bolster core state services — such as subsidized child care. Moreover, the State Appropriations Limit (“Gann Limit”) may be a barrier to boost investments in child care and other public services. Policymakers should work to remove or significantly reform this spending cap so the state can plan and make bold investments that help families be healthy and thrive.
In 2018-19, policymakers also increased the Standard Reimbursement Rate adjustment factors for certain higher-cost groups of children, such as infants and children with disabilities. However, some (but not all) of these adjustment factors were eliminated in the 2021-22 budget agreement as part of the transition to a single reimbursement rate system for subsidized child care providers. See Assembly Bill 1808 (Committee on Budget, Chapter 32, Statutes of 2018), https://leginfo.legislature.ca.gov/faces/billTextClient.xhtml?bill_id=201720180AB1808; and Assembly Bill 131 (Committee on Budget, Chapter 116, Statutes of 2021), https://leginfo.legislature.ca.gov/faces/billNavClient.xhtml?bill_id=202120220AB131.
2
Calculations are based on the minimum wage for employers with 25 employees or less. Senate Bill 3 (Leno, Chapter 4, Statutes of 2016), https://leginfo.legislature.ca.gov/faces/billNavClient.xhtml?bill_id=201520160SB3.
3
Market rate surveys collect data on the tuition and fees that families can afford to pay for child care in a geographic area. These rates typically do not cover the true cost of care, as many providers supplement tuition and fees with other sources of revenue, such as grants or donations. See Bipartisan Policy Center, The Limitations of Using Market Rates for Setting Child Care Subsidy Rates (May 2020), 4-6, https://bipartisanpolicy.org/report/the-limitations-of-using-market-rates-for-setting-child-care-subsidy-rates/
4
Assembly Bill 131 (Committee on Budget).
You may also be interested in the following resources:
There was a problem processing your signup. Please try again. Or contact us
Please check your email to confirm your signup.
This website uses cookies to analyze site traffic and to allow users to complete forms on the site. The California Budget & Policy Center does not share, trade, sell, or otherwise disclose personal information. By using our website you agree to our Privacy Policy.